


Dashboards
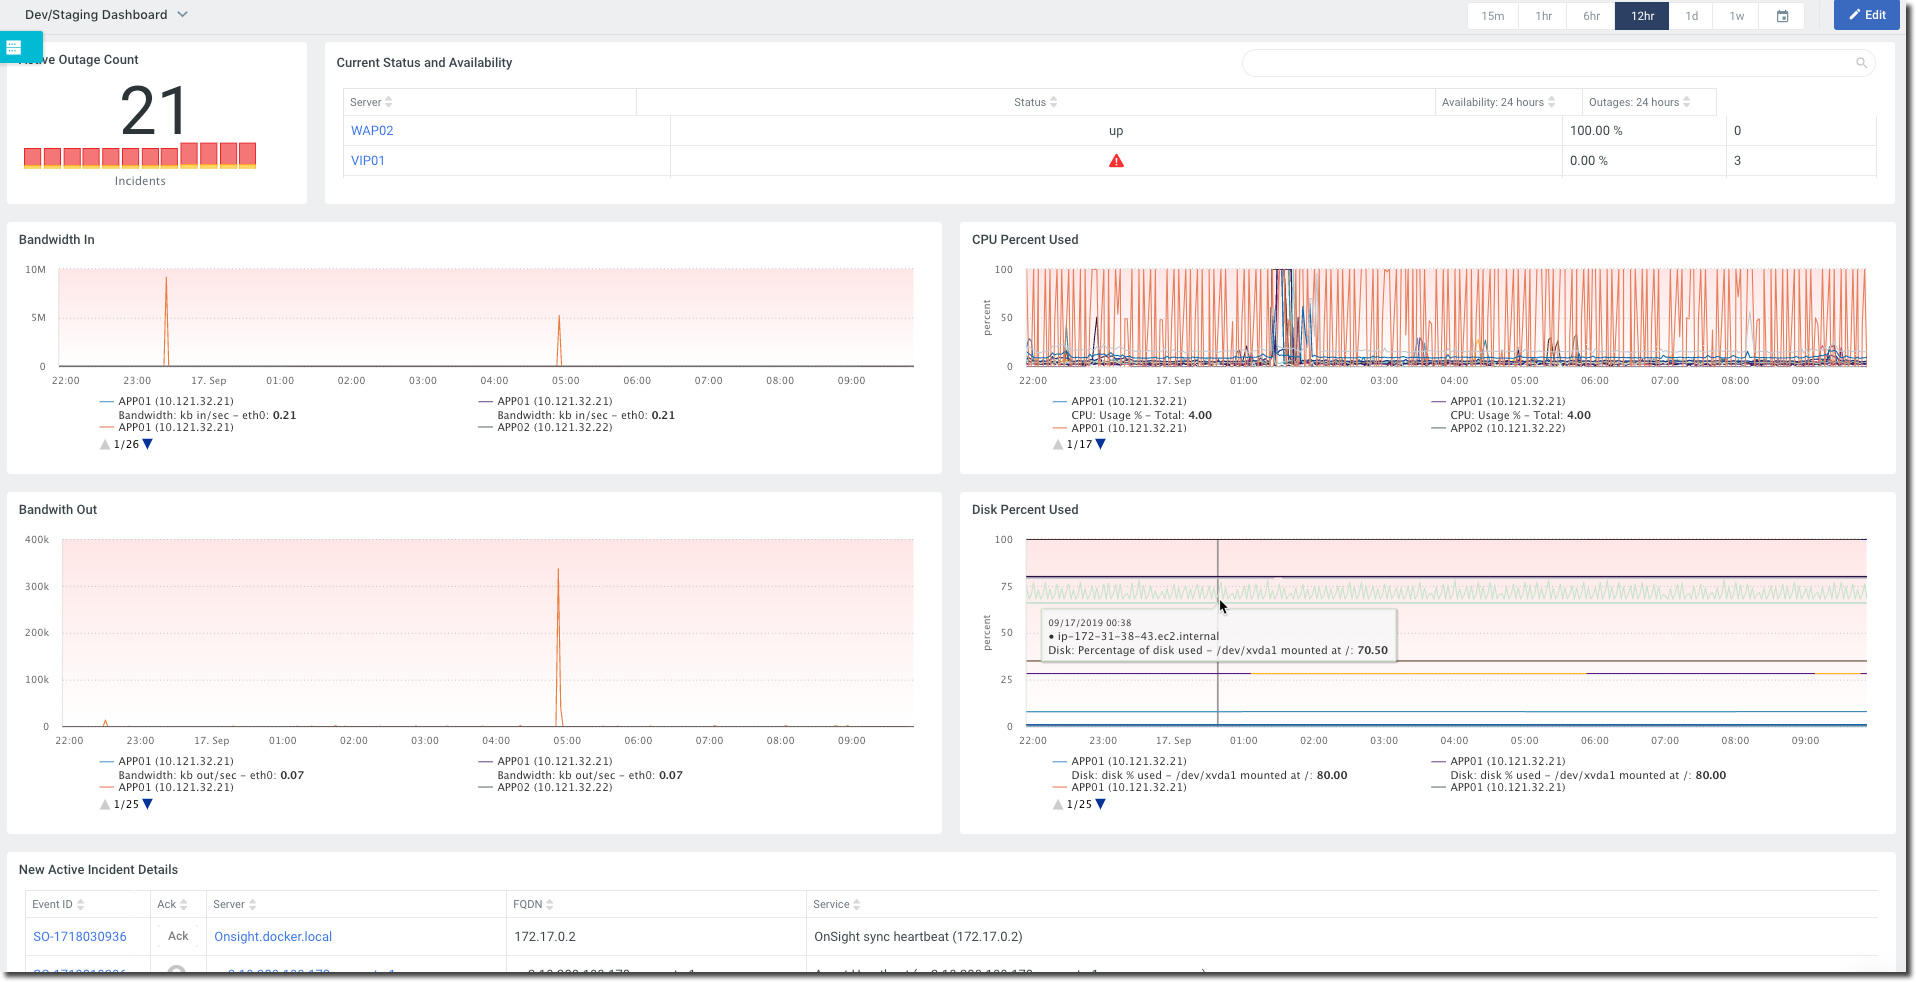
Dashboards are powerful mechanisms for displaying and visualizing the various streams of data that are being captured by the FortiMonitor Monitoring Cloud. Configuring a dashboard is easy and uses our simple drag and drop builder for widgets in order to achieve the layout you require. In addition, each of the widgets has several options for controlling different elements ranging from formatting, data selection, filtering, and data aggregation.
Create a dashboard
There are two ways to create a new dashboard:
-
From the navigation menu, select Dashboards > My Dashboards. Click the name of the dashboard then click Create New Dashboard.
-
Click Add from the navigation menu. From the Alerting & Reporting section of the catalog, select the Dashboard card.
Doing either of the following will show the Ceate a Dashboard drawer. From here you can then set the basic properties for your new dashboard, like name, tags, access level, templates, and whether this dashboard should be made available with a public URL.
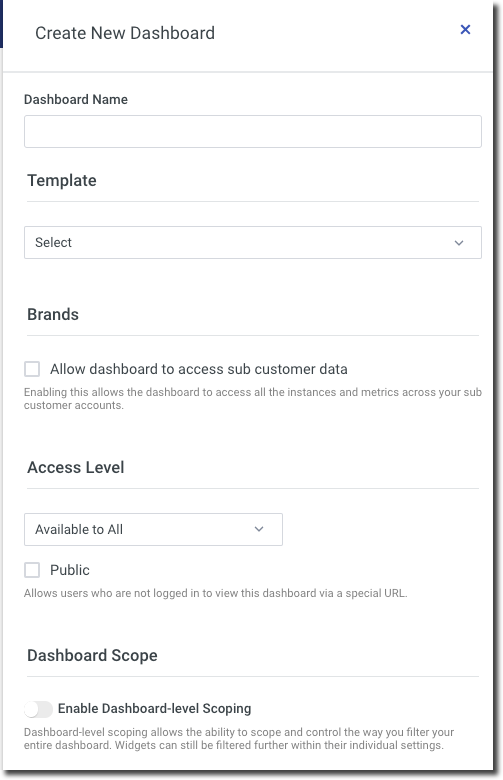
The Access Level options allow you to limit which of your users can see which dashboards.
-
Available to all - All users with a login and who have access to the dashboards menu can see these Dashboards
-
Limited by tag - Dashboard access will be limited by which tags are set on this dashboard and tags set on a user. The tag filter uses
ORlogic when matching dashboard tags and user tags -
Only for me - These dashboards will only show under your login
Once you select Create Dashboard, a blank dashboard canvas will be created. Select Add Widget to start building your dashboard.

Configure dashboard widgets
We have provided extensive details on each widget and their options here.
Instance and metric tags
If you are not already using tags to further segment and categorize your infrastructure, dashboards are a great reason to start. Every widget provides options for dynamically displaying the appropriate infrastructure and metrics by tag, rather than hardcoded selections. This allows your infrastructure to expand and contract as needed without requiring constant changes on what is being shown in your live dashboards. For more information on tagging, read Tags.
Dashboard-level scoping
Dashboard-level scoping allows you to control the way you filter your entire dashboard. You can scope your dashboard by tags or by key attributes. Individual widgets can then be filtered further within their individual settings.
To enable dashboard-level scoping, perform the following steps.
-
From the dashboard where you want to apply dashboard-level scoping, click Edit.
-
Click the gear icon. The Dashboard Settings drawer will slide out.
-
Under Dashboard Scope, enable dashboard-level scoping.
-
Select Scope dashboard by tags or Scope dashboard by key attributes.

-
If you select Scope dashboard by key attributes, click Add new Value to add a key attribute.
-
Select a value from the dropdown list.
-
Repeat steps a and b to add more attributes.
-
-
Click Save.
If you have selected Scope dashboard by tags, the field Scope dashboard by tags will become available. Enter any number of tags to filter the dashboard.
If you have selected Scope dashboard byattributes, a dropdown field containing all of the values stored in the attribute will become available. Select one or more values to filter the dashboard.

Favorites and search
Favoriting dashboards makes them easier to access by prioritizing them at the top of the dashboard menu and within the dashboard selector dropdown (shown below).
