SD-WAN monitor table view
You can monitor SD-WAN devices and interfaces in the Table View section.
To monitor SD-WAN with Table View:
-
Go to the SD-WAN Manager > Network > Monitor or Device Manager > Monitors > SD-WAN Monitor pane.
-
Select Table View, you can view information about SD-WAN devices.
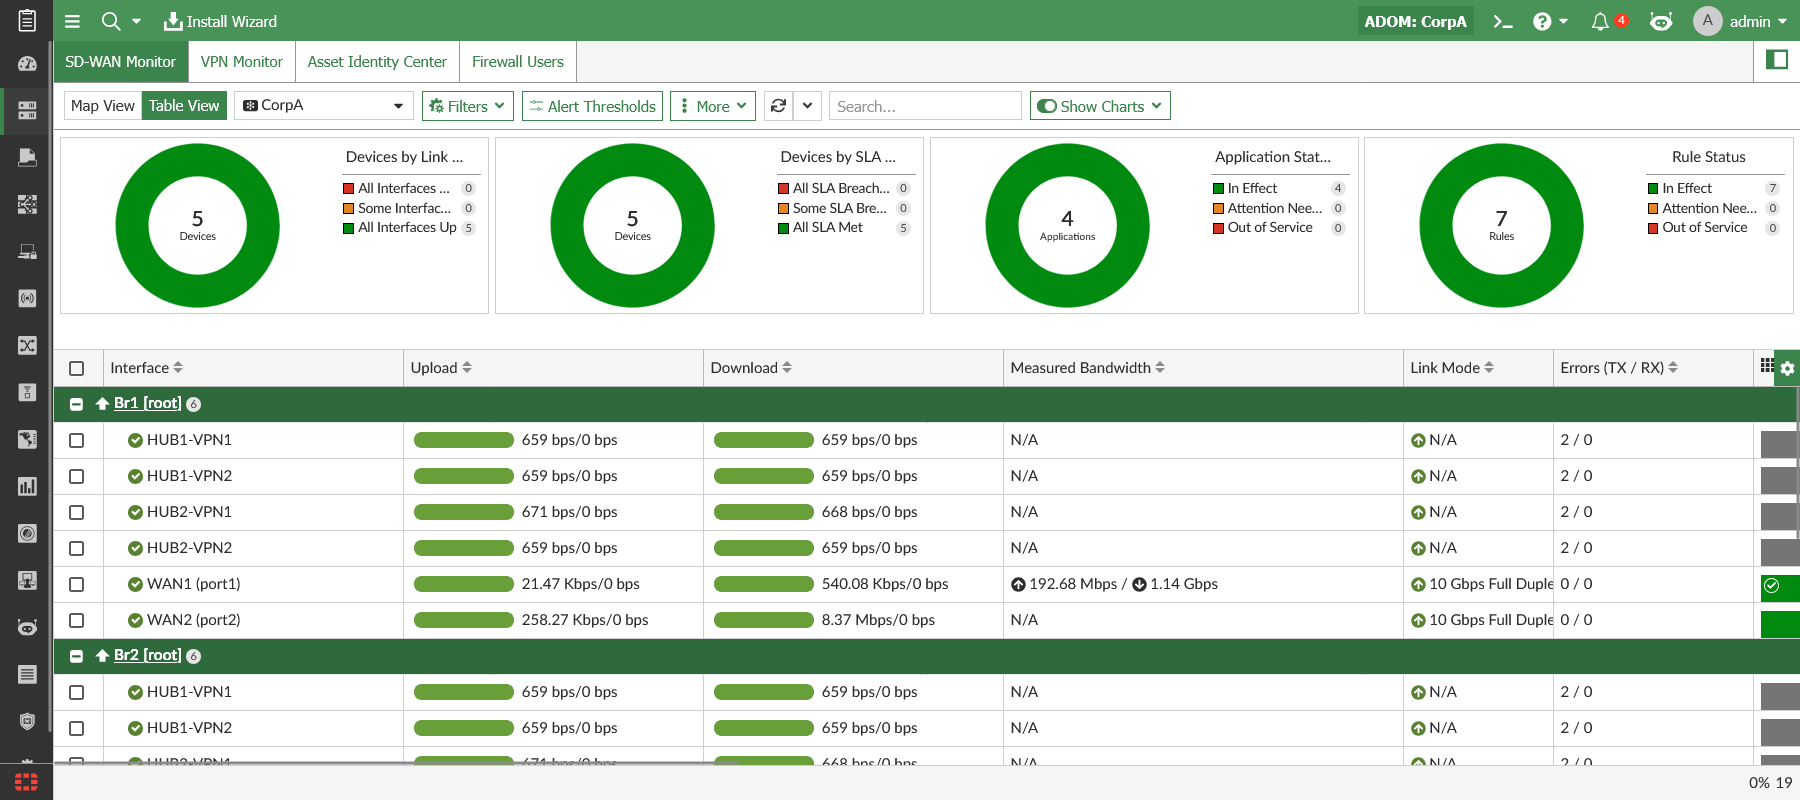
The following columns of information are shown for each device:
Interface
Interface members.
Hover your mouse over an interface that is shown in red to display a dialog that shows the parameters that have failed the SLA criteria.
Upload
Volume of data transmitted up stream.
This field is color coded to indicate the bandwidth usage for an interface based on a configured threshold. See Bandwidth alert thresholds.
Download
Volume of data transmitted down stream.
This field is color coded to indicate the bandwidth usage for an interface based on a configured threshold. See Bandwidth alert thresholds.
Measured Bandwidth
Displayed the measured bandwidth.
Link Mode
Displays the link status, speed, and duplex. Speed and duplex information is only available for physical interfaces.
Errors (TX/RX)
Displays the number of errors that have occurred during transmission (TX) and receiving (RX).
Applications
Add or remove the Applications from the Services Settings dropdown. The data is shown for the selected applications. The applications are specified in SD-WAN Rules > Destination type > Internet Service in FortiGate.
Automatic Refresh
FortiManager extracts the data from FortiGate devices based on the refresh settings. Select the automatic refresh interval from Every 5 Minutes to Every 30 Minutes.
When a single device is specified, additional realtime refresh options from Every 30 Seconds to Every 3 Minutes are available.
You can select Manual Refresh to refresh the data manually.
-
(Optional) Apply filters. Multiple filters can be applied simultaneously.
-
Click the Filters dropdown to view options to Show Unhealthy Devices Only and/or Show Unhealthy Interfaces Only.
-
Selecting one or more segments displayed in donut charts will apply corresponding filters to the table.
For example, selecting All Interfaces Down in the Devices by Link Status chart will filter the table to display only devices with all interfaces down.
-
Drilling down on SD-WAN interfaces
You can drill down on an interface displayed in the SD-WAN monitor table view to view information about the interface's bandwidth, byte, and session usage by applications.
To drill down on an SD-WAN interface:
-
Go to Device Manager > Monitors > SD-WAN Monitor or SD-WAN Manager > Network > Monitor.
-
Select Table View.
-
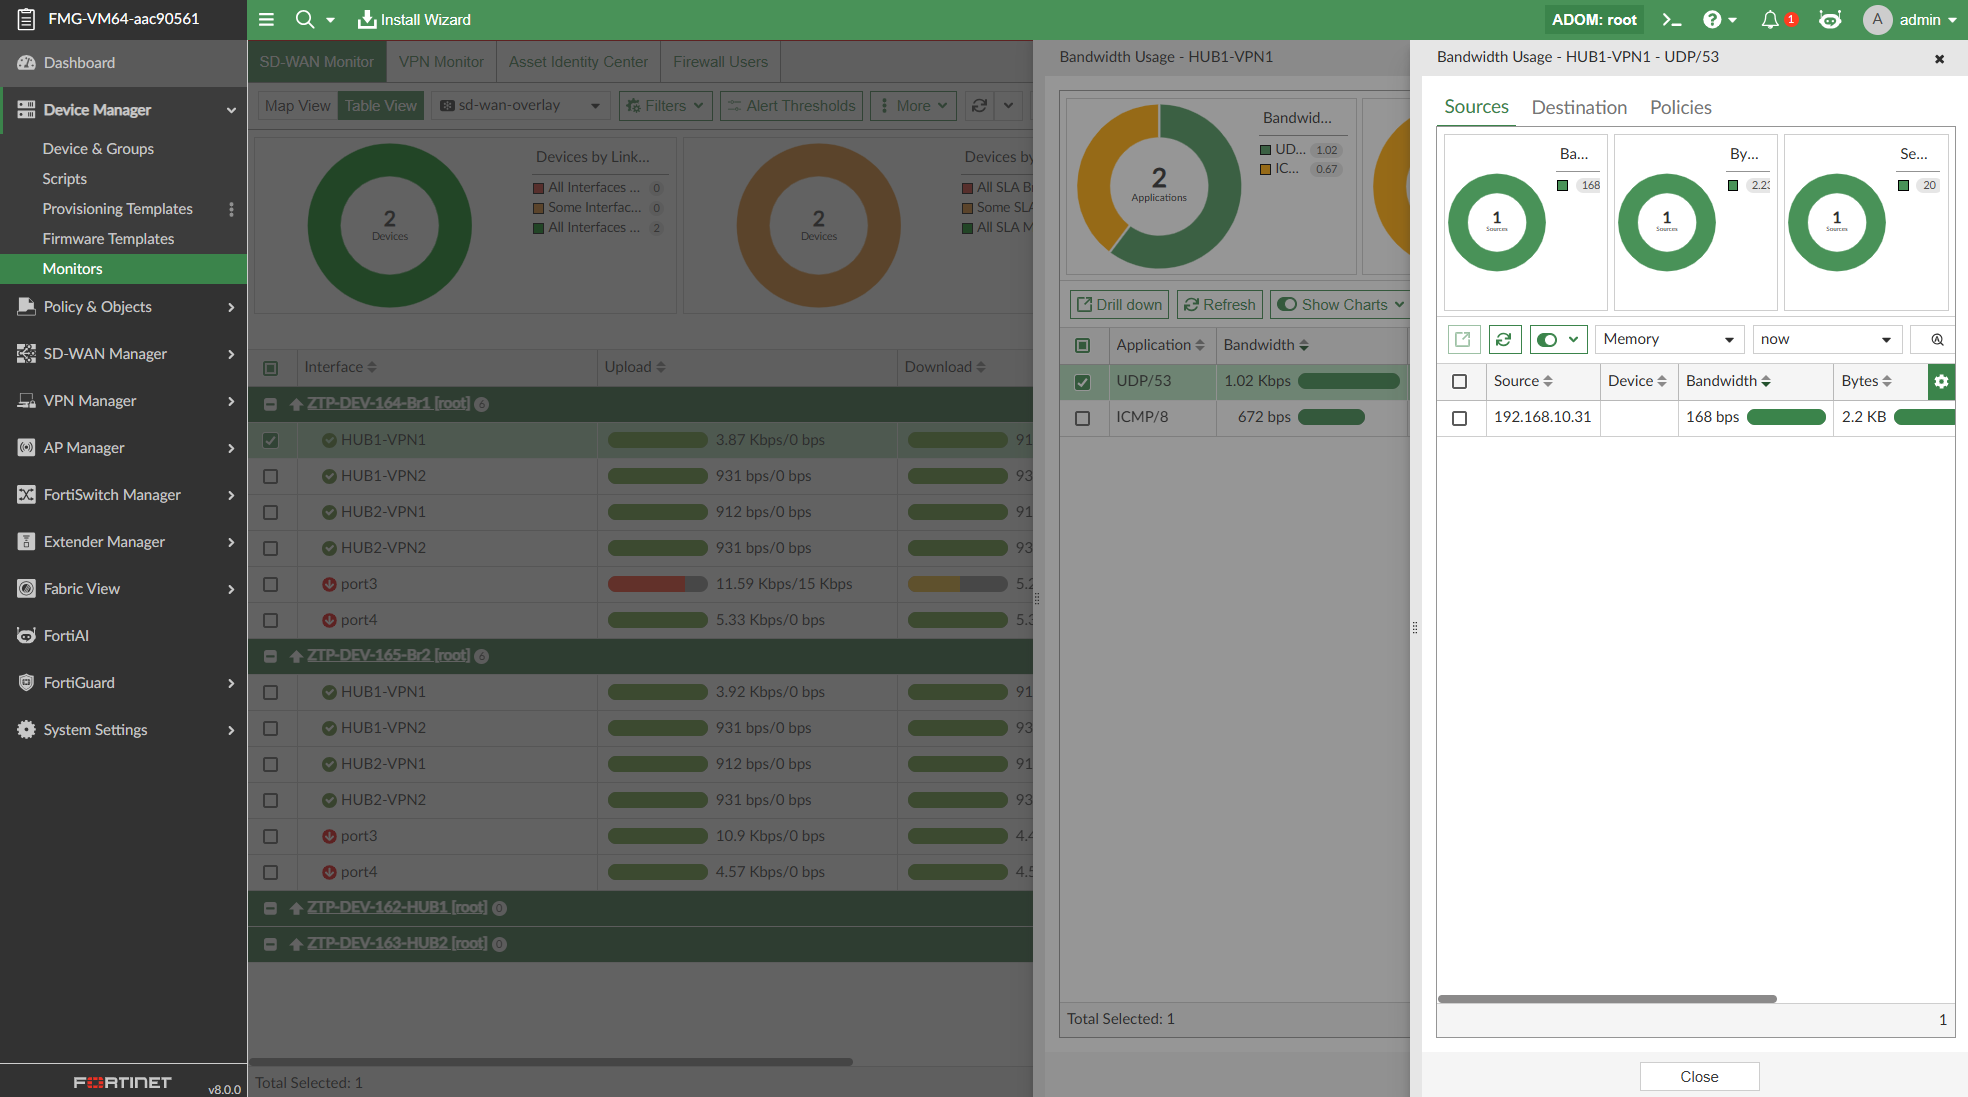
Right-click on an interface displayed in the table, and click Drill down.
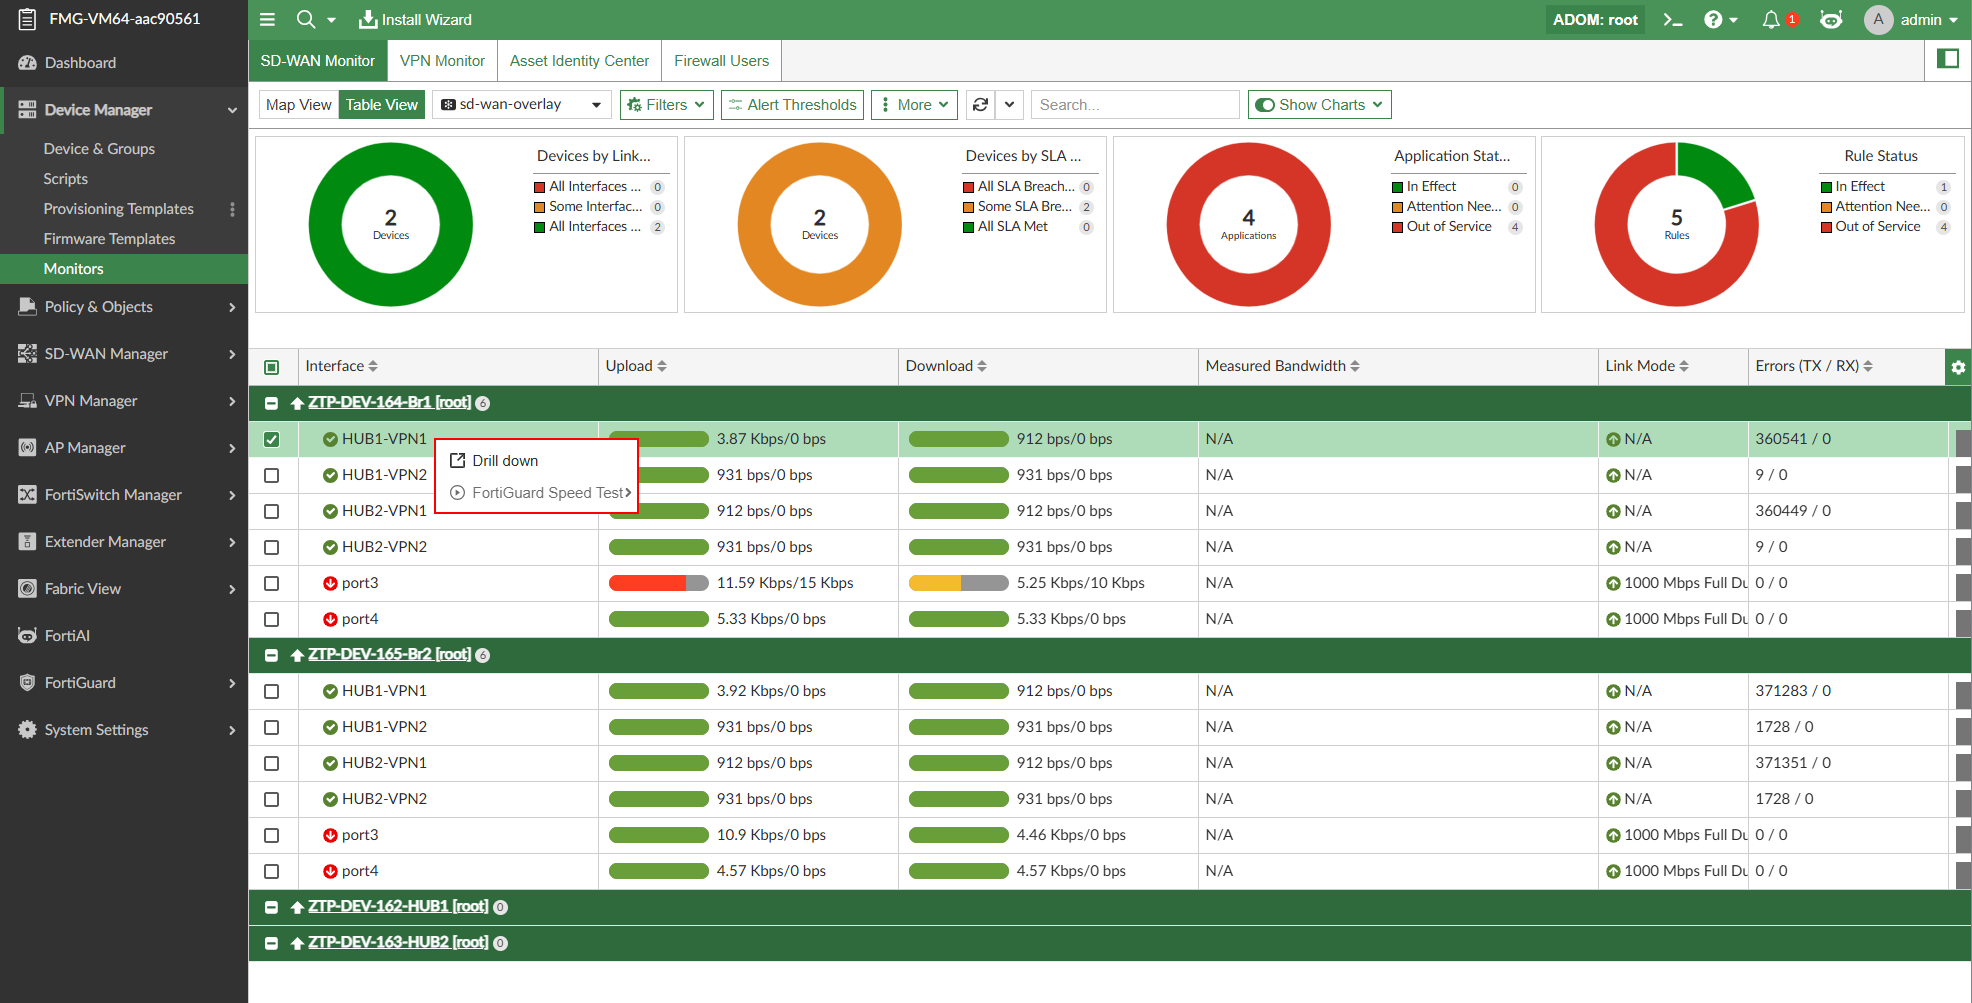
The Bandwidth Usage slide in menu is displayed which includes bandwidth usage, bytes, and session counts for each application.
-
Donut charts display the top applications by bandwidth, bytes, and sessions. You can toggle the display of these charts by enabling/disabling the Show Charts option in the toolbar.
-
You can choose different log device data sources and time frames from the dropdown menus in the toolbar.
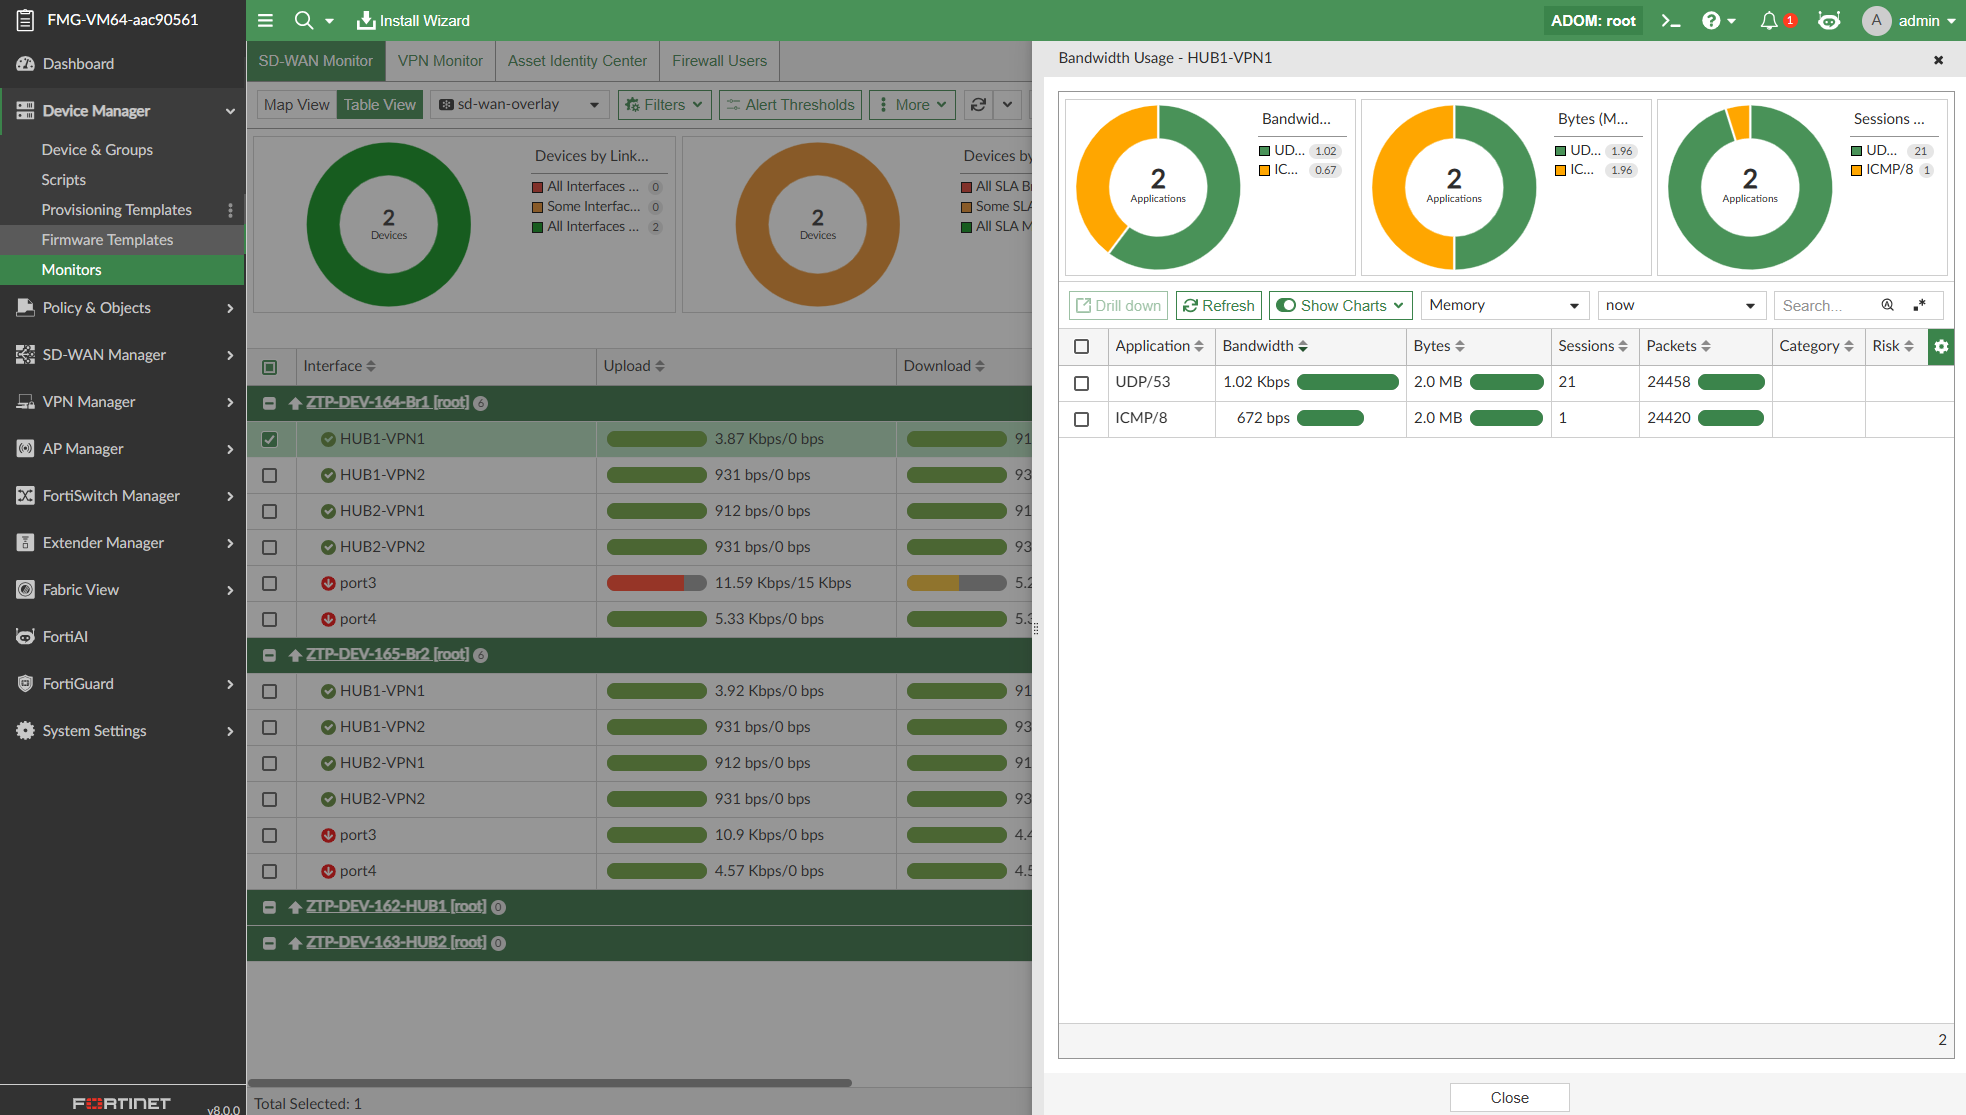
-
You can further drilldown on an application displayed in the table to view the source, destination, and policy information related to the application.
-
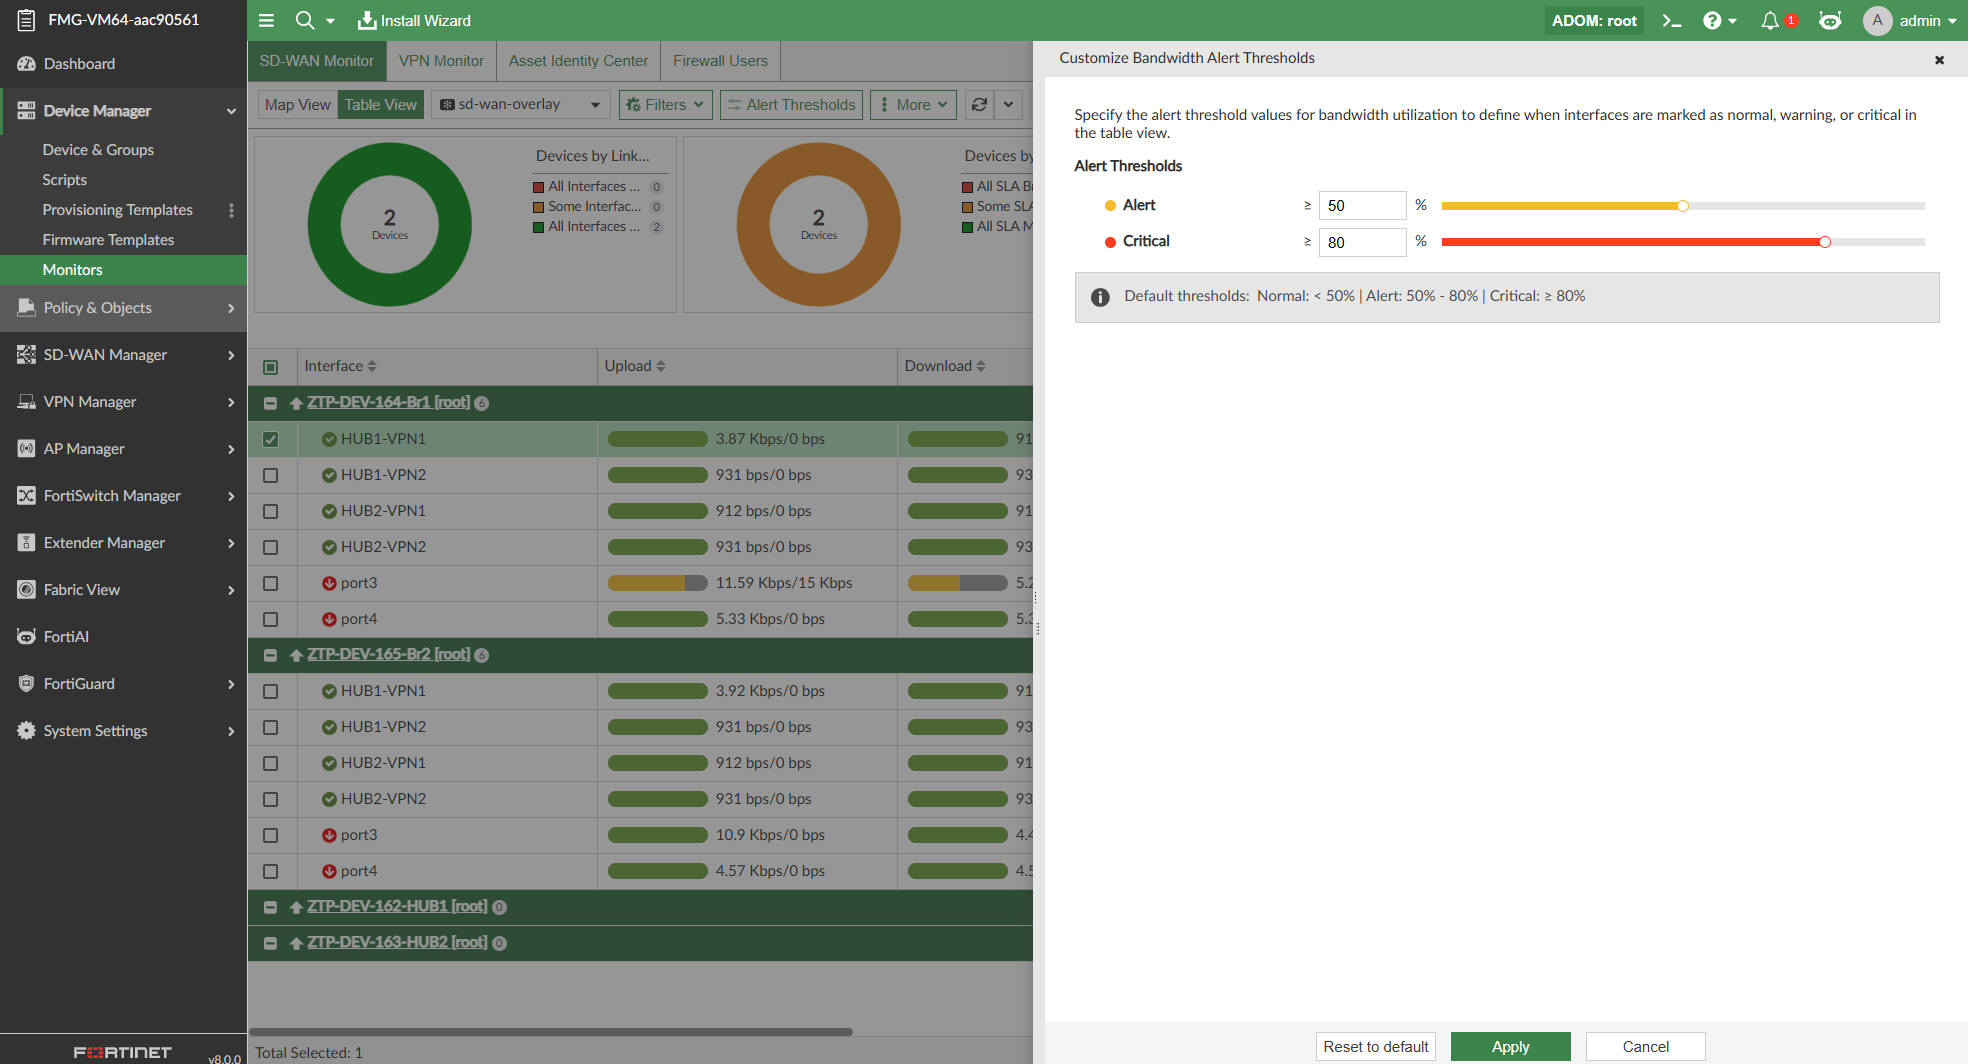
Bandwidth alert thresholds
The Upload and Download bandwidth usage displayed in the table are color coded to identify the interface's bandwidth usage based on normal, alert, or critical thresholds. You can configure the threshold values. The default threshold values are:
|
Color |
Interface alert |
Default Threshold Value |
|---|---|---|
| Green | Normal | <50% |
| Orange | Alert | 50% - 80% |
| Red | Critical | ≥ 80% |
To configure threshold values:
-
Go to the SD-WAN Manager > Network > Monitor or Device Manager > Monitors > SD-WAN Monitor pane.
-
Select Table View.
-
Click Alert Threshold in the toolbar.
-
Set the threshold value for the Alert and Critical thresholds.