


Custom Dashboards and Reports
You can create customizable dashboards with a set of pre-defined dashlets and the provision of exporting dashboard data to PDF reports. This feature enables you to monitor specific network aspects based on your requirements. There is a default dashboard with the overall network statistics, you can create a custom dashboard and set it as the default.
Note: Each user in an account can create a maximum of 5 custom dashboards.
To create a new custom dashboard, update the following tabs.
-
General – Enter the name of the custom dashboard (2 ~ 32 characters) and an optional description (upto 255 characters).

-
Network - Select which networks to monitor in the custom dashboard. You can either select a few networks to monitor or you can select all networks and optionally exclude a few from monitoring.

-
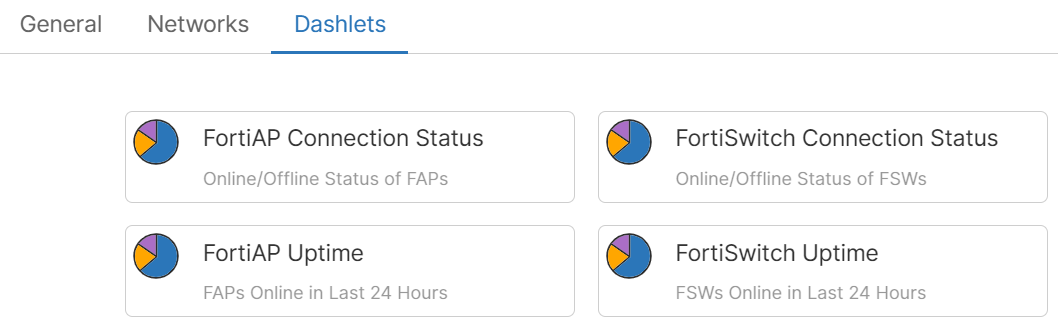
Dashlets – Select the one or multiple pre-defined dashlets to include in the custom dashboard.
-
FortiAP Connection Status
-
FortiSwitch Connection Status
-
FortiAP Uptime
-
FortiSwitch Uptime
-
When you select the dashlets for FortiAP/FortiSwitch uptime statistics, you are prompted to specify the duration.
You can add and remove dashlets after the custom dashboard is created. To export dashboard statistics into a PDF report, click Export As PDF.
Click on the Actions menu for the following additional operations that you can perform on the custom dashboard.
-
Edit Dashboard – You can edit all the parameters set for the custom dashboard and also view the time stamp for the dashboard creation and last update.
-
Delete Dashboard – You can delete the custom dashboard permanently.
-
Set as Default – You can set the custom dashboard as the default, this dashboard is then displayed at the time of login.