
Switch
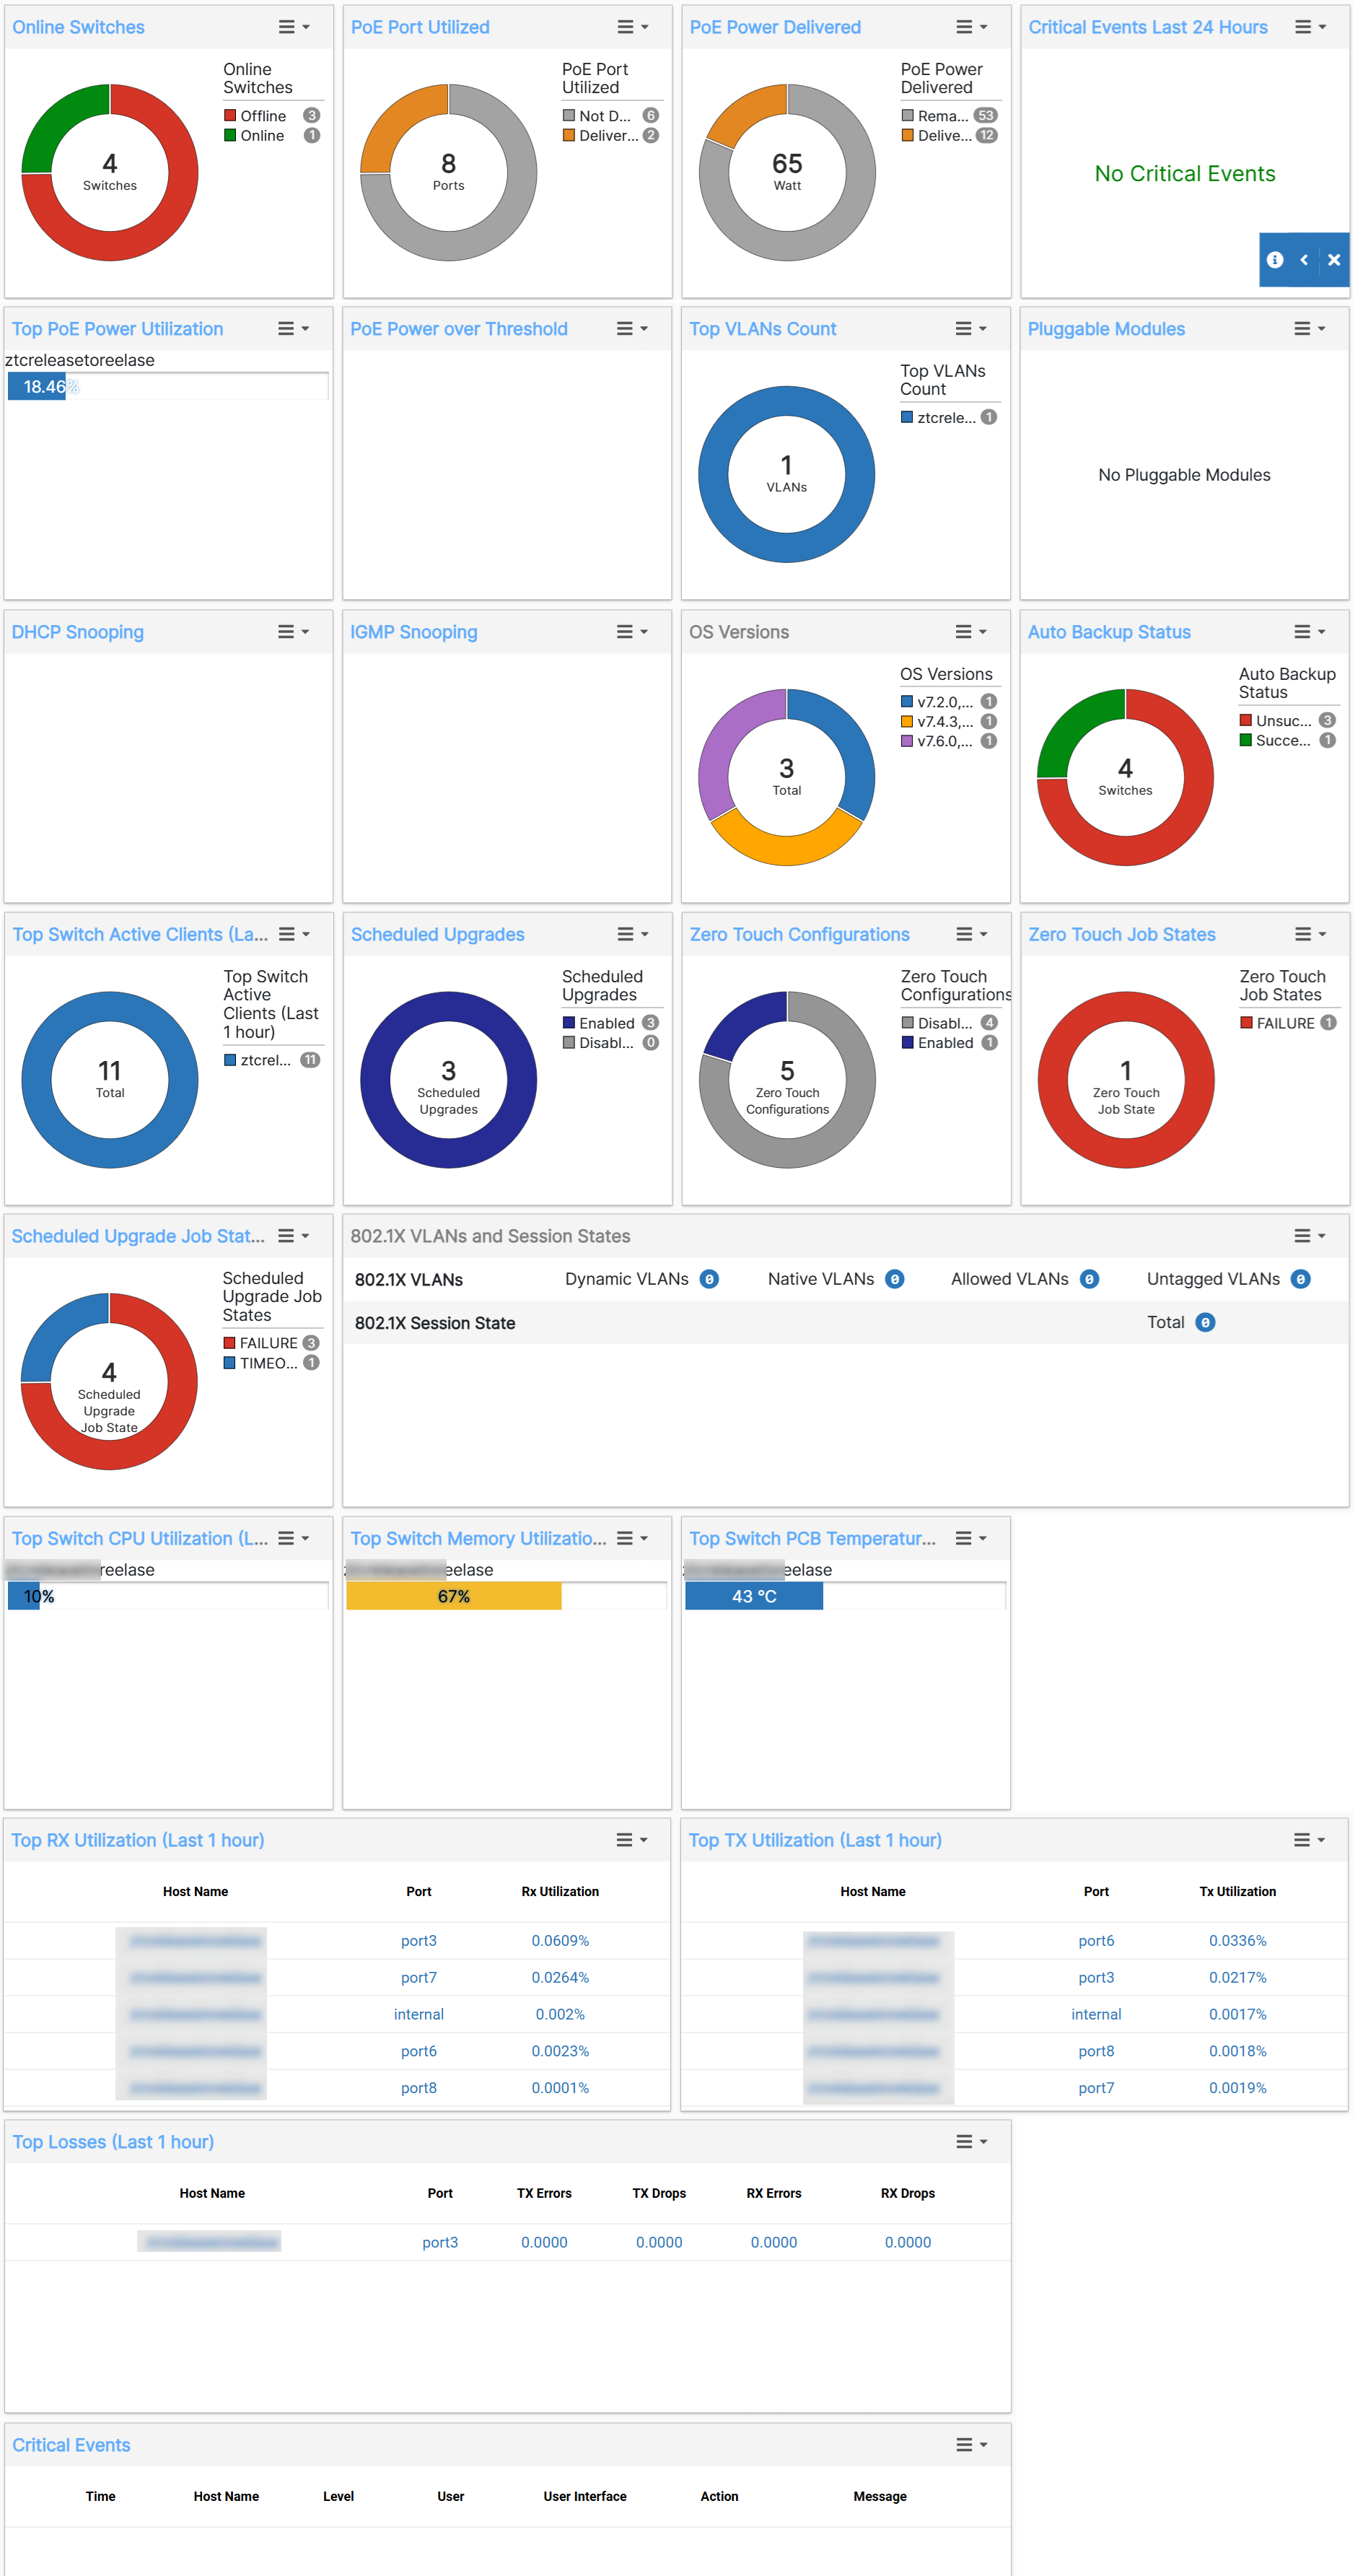
This dashboard provides a snapshot of FortiSwitch activity that occurred in the last 24 hours.
Use the Quick Links drop-down list to view the switch topology, deploy switches, add zero-touch configurations, or add scheduled upgrade configurations.
The Dashboard page provides the following information.
-
Online Switches—The number and percentage of managed devices that are online
-
PoE Port Utilized—The number and percentage of Power over Ethernet (PoE) ports that are being used
-
PoE Power Delivered—The number of Watts and the percentage of PoE delivered.
-
Critical Events Last 24 Hours—The number of critical events in the last 24 hours
-
Top PoE Power Utilization—The five FortiSwitch units with the highest PoE usage
-
PoE Power over Threshold—The five FortiSwitch units that have a current power budget that exceeds a specified percentage of the total power budget.
-
Top VLANs Count—The five FortiSwitch units with the most VLANs.
-
Pluggable Modules—The number and types of modules inserted in FortiSwitch units, as well as any warnings or alerts
-
DHCP Snooping—The number of DHCP-snooping-enabled VLANs, the number of dynamically learned DHCP snooping entries in the client and server databases, and the number of DHCP-snooping entries in the limit database.
-
IGMP Snooping—The number of switches and VLANs enabled for IGMP snooping and the number of dynamic IGMP-snooping groups.
-
OS Versions—Which FortiSwitchOS versions are being used by managed FortiSwitch units.
-
Auto Backup Status (Last 24 hours)—The number of scheduled configuration backups that failed and succeeded in the last 24 hours and which FortiSwitch units were not backed up.
-
Top Switch Active Clients - The FortiSwitches with the highest number of active clients in the last one hour.
-
Scheduled Upgrades - The number of scheduled upgrades that are enabled for the FortiSwitch units.
-
Scheduled Upgrade Job States - The status of the scheduled upgrade jobs, such as, timed out, failed, and so on.
-
Zero Touch Configurations - The number of ZTCs enabled for the FortiSwitch units.
-
Top Switch CPU Utilization - The FortiSwitches with the highest CPU utilization in the last one hour.
-
Top Switch Memory Utilization - The FortiSwitches with the highest memory utilization in the last one hour.
-
Top Switch PCB Temperature - The FortiSwitches with the highest PCB temperature in the last one hour.
-
Top Rx/Tx Utilization - The FortiSwitches with the highest percentage of Rx/Tx utilization in the last one hour.
-
Top Losses - The FortiSwitches with the highest Rx/Tx drops and errors in the last one hour.
-
Switches & Licenses - The FortSwitch license details with the status, used, available, grace period.
-
Active Configurations - The active FortiSwitch configurations with their status.
-
802.1X VLANs and Session States - The VLANs are listed along with the session state.