
GSLB Dashboard
The GSLB Dashboard provides real-time metrics on total queries, query per second (QPS) rates, load balancer health checks, fully qualified domain name (FQDN) status, and virtual server operational status.
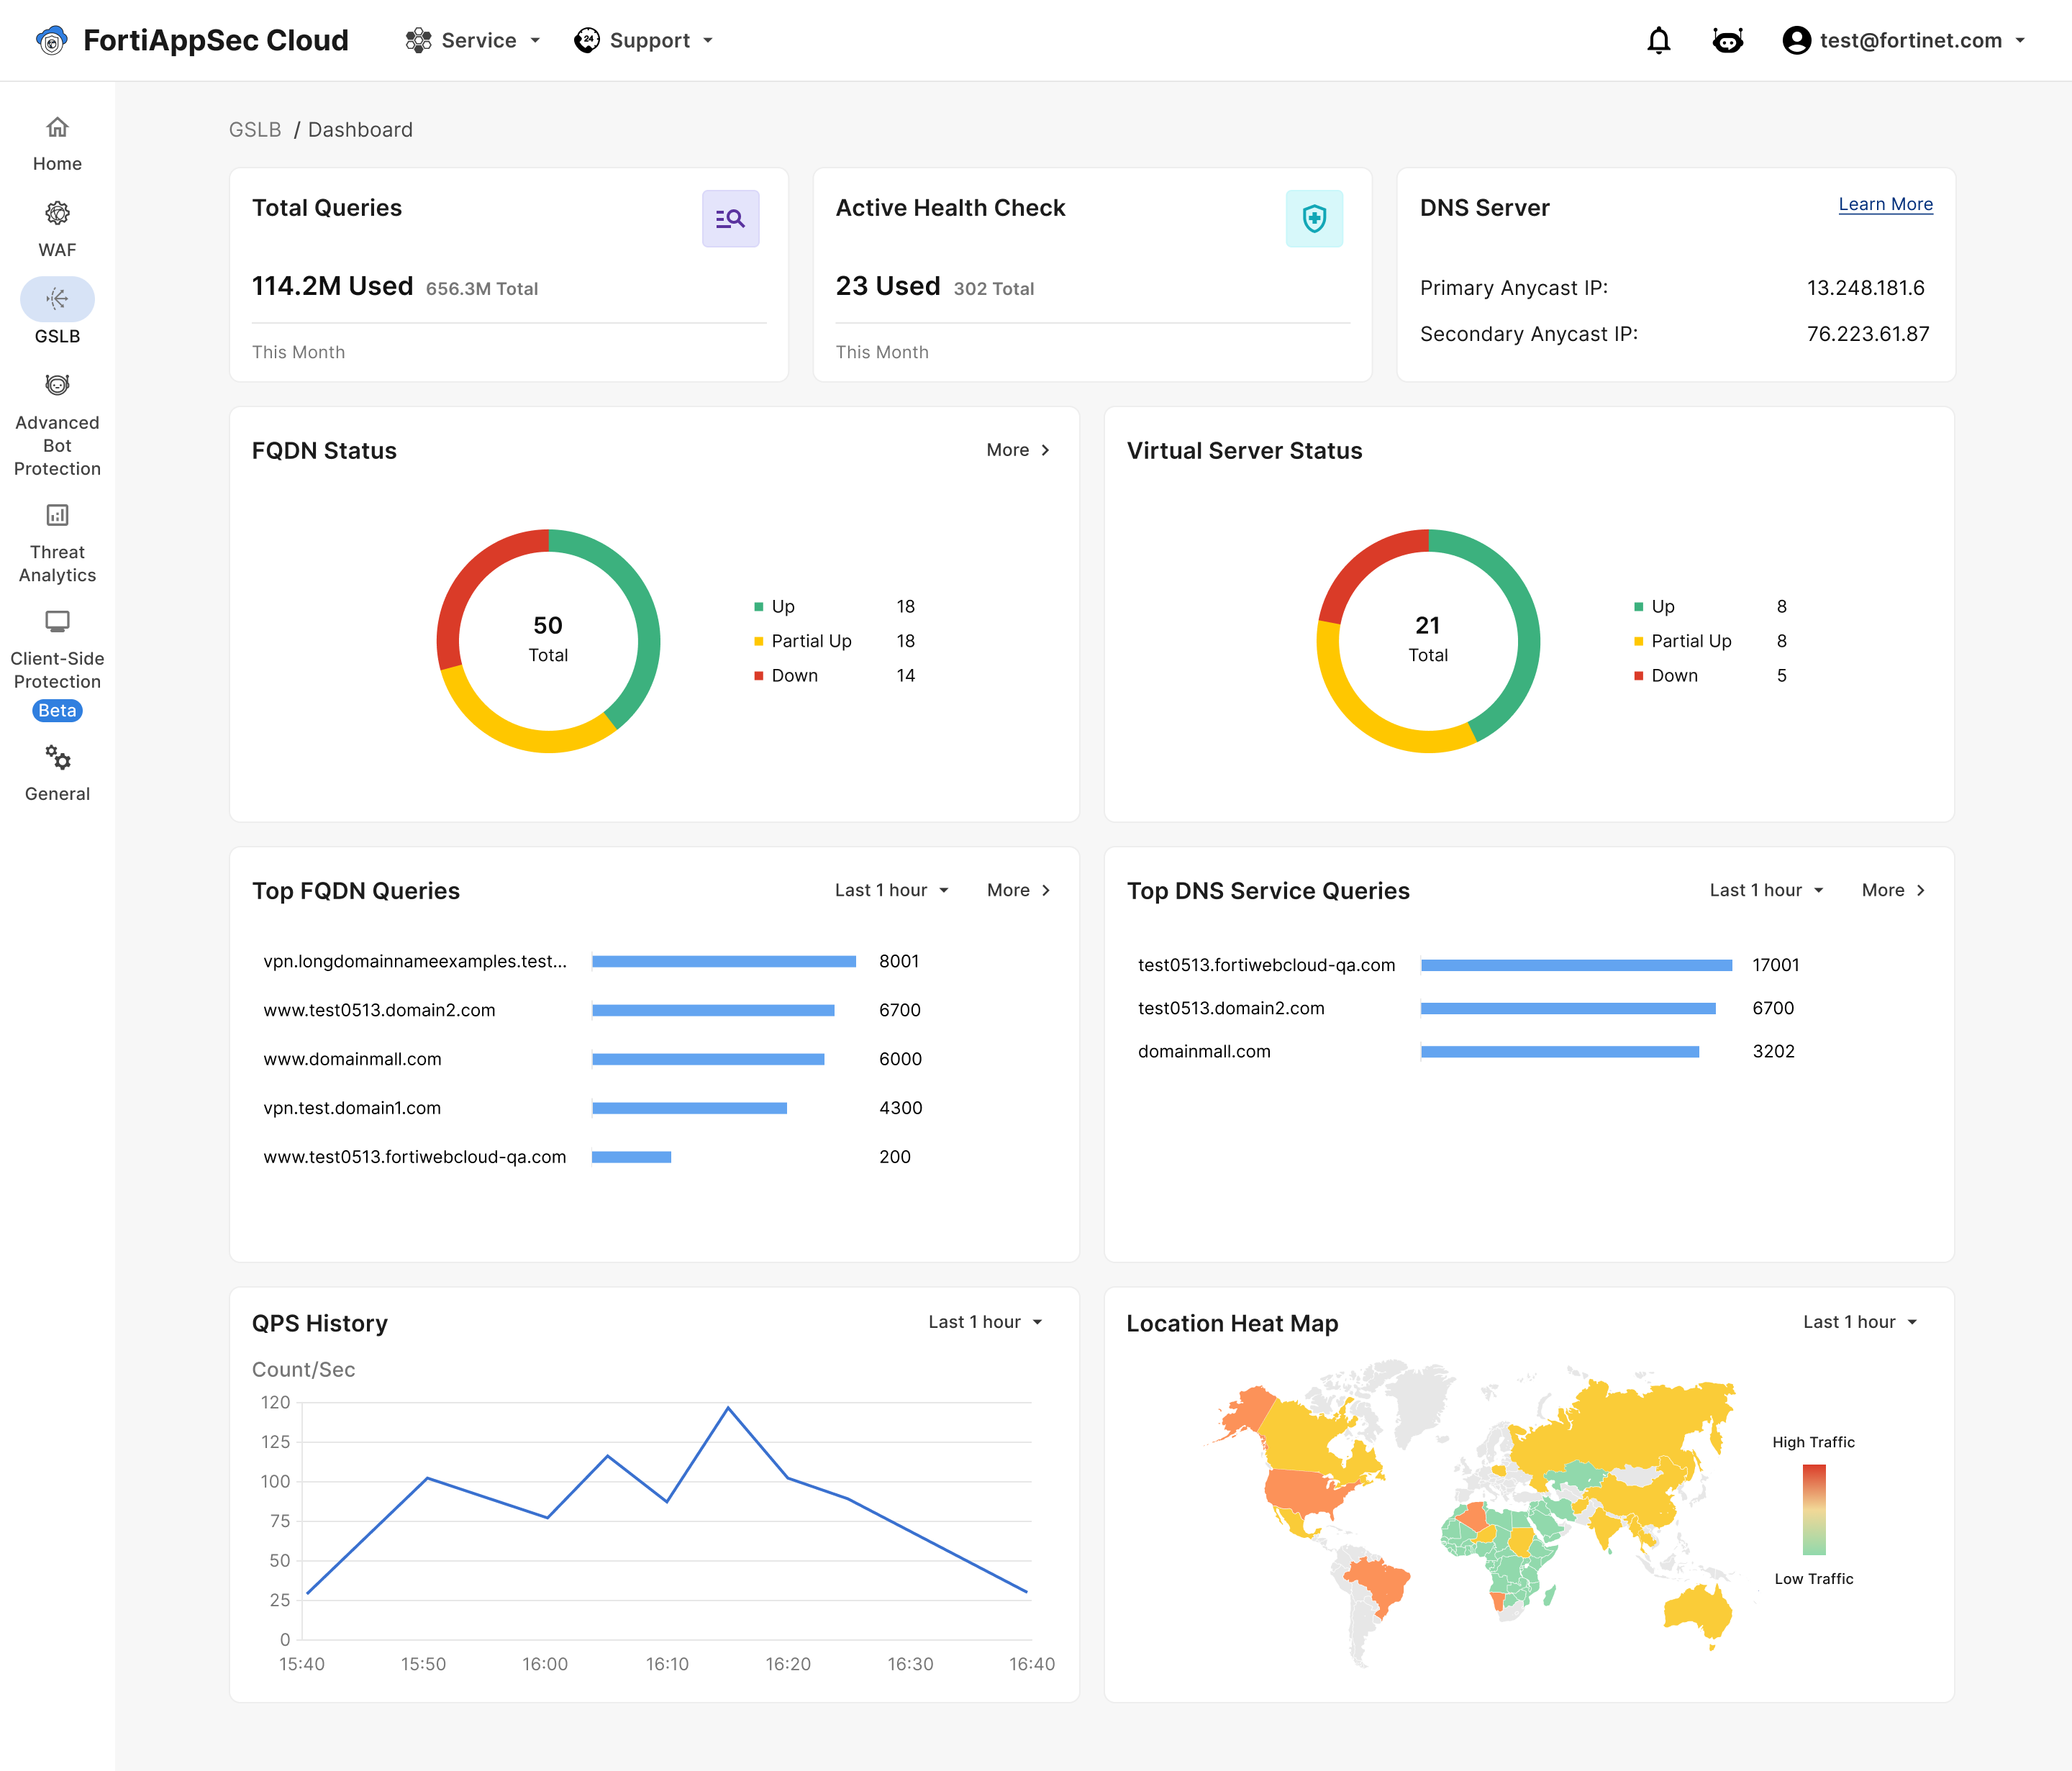
| FQDN status |
Shows the status of the FQDN. Red is down; yellow is partially up; green is completely up. |
| Virtual server status |
Shows the status of virtual servers. There are three statuses: up, down, and unknown. |
|
Top FQDN Queries |
The FQDNs receiving the highest number of queries over the selected time frame. |
|
Top DNS Queries |
The DNS domains that received the highest number of client queries over the selected time frame. |
| Queries per second (QPS) History |
Queries per second over the selected time frame. |
| Total Queries |
Total queries used by the account over the selected time frame. |
|
Location Heat Map |
A color-coded map showing the geographic origin of queries over time. |
For comprehensive details regarding the functionalities within the GSLB services WebUI and its various pages, please see Service