
GSLB Dashboard
The GSLB Dashboard provides real-time metrics on total queries, query per second (QPS) rates, load balancer health checks, fully qualified domain name (FQDN) status, and virtual server operational status.
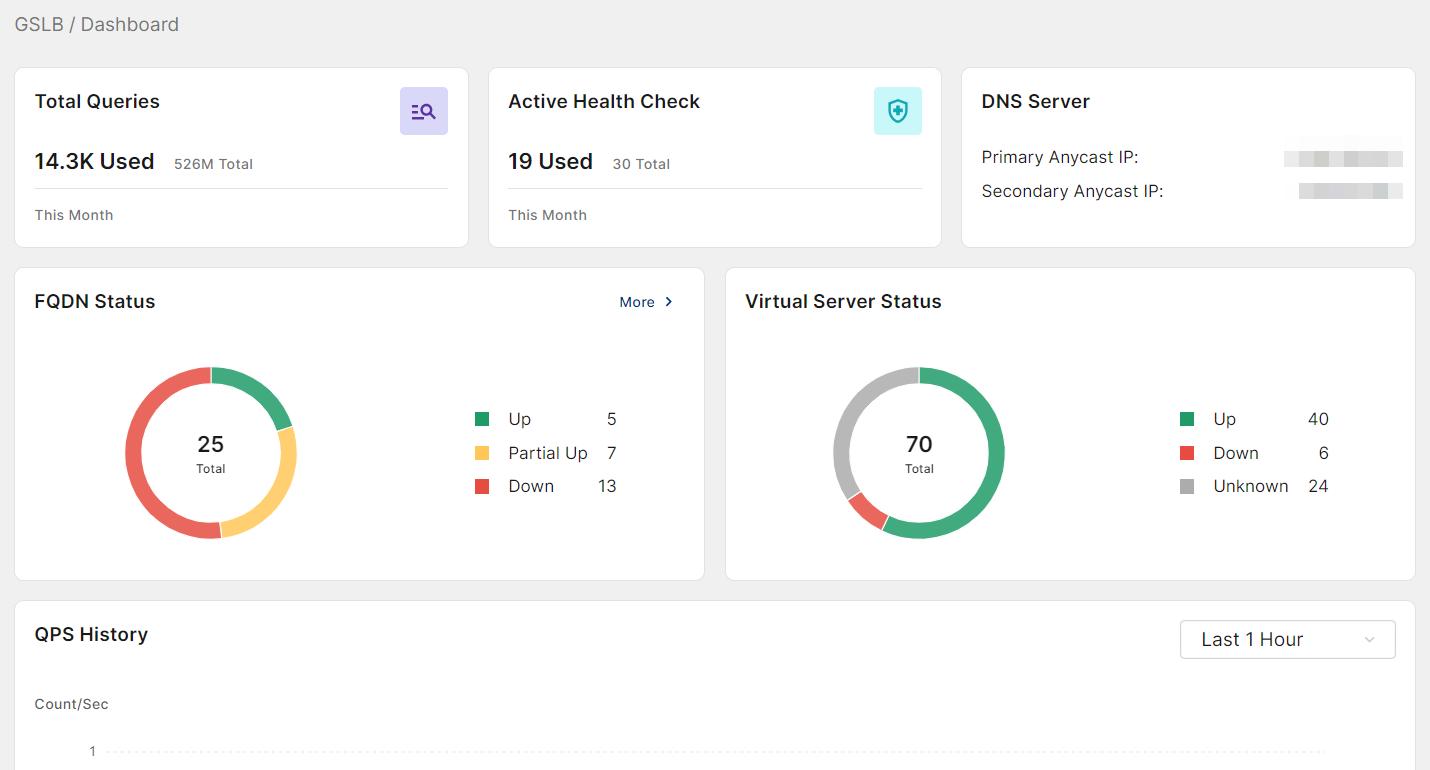
| Total Queries |
Total queries used by the account; total capacity in the current month. |
| Active health check |
Active health check used by the account; total capacity in the current month. |
| Queries per second (QPS) |
Queries per second currently |
| FQDN status |
Shows the status of the FQDN. Red is down; yellow is partially up; green is completely up. |
| Virtual server status |
Shows the status of virtual servers. There are three statuses: up, down, and unknown. |
| Licenses |
Licenses and capacity status of this account |
For comprehensive details regarding the functionalities within the GSLB services WebUI and its various pages, please see Service