
Explorer
The Explorer pane allows you to efficiently monitor alerts using a timeline and quick filters.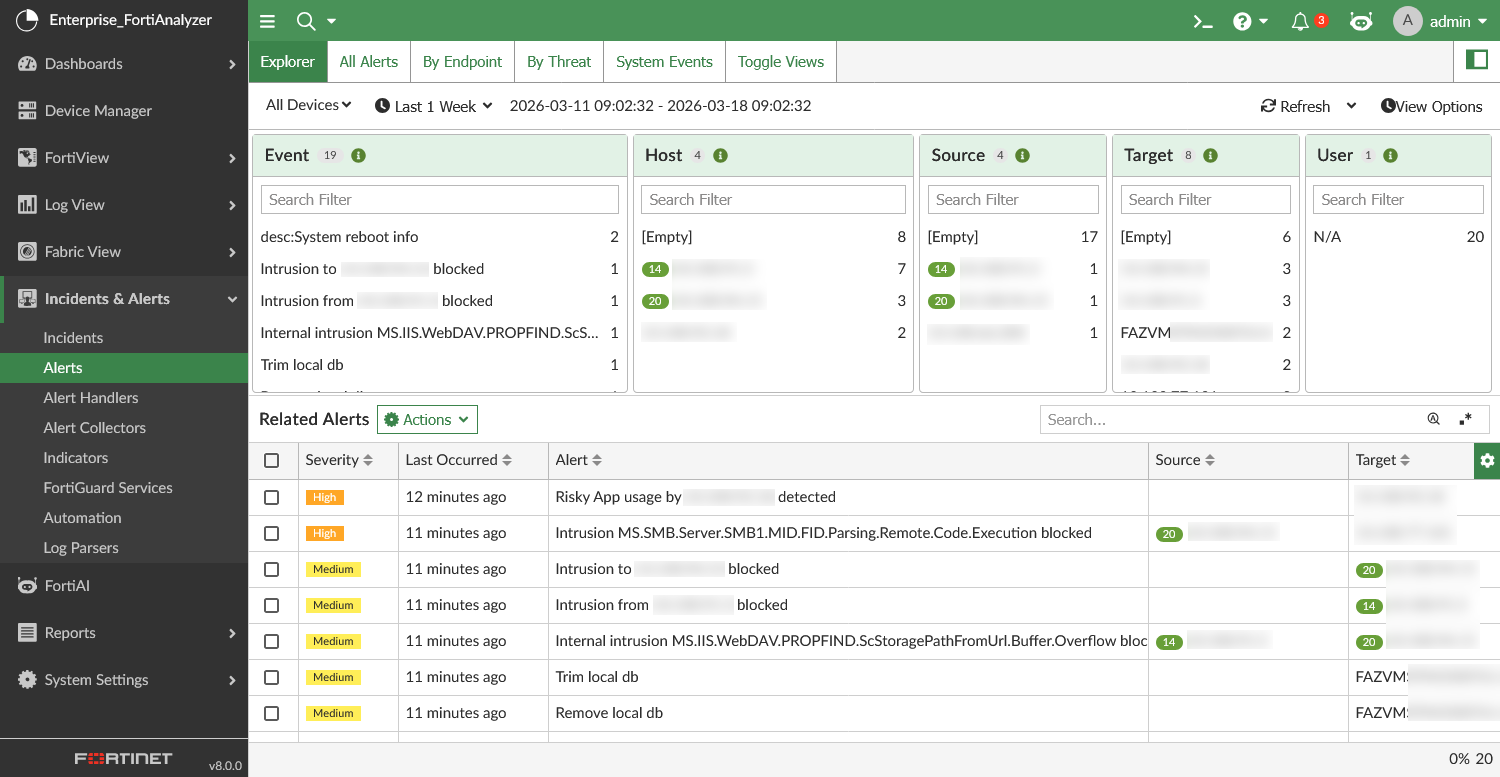
You can perform the following actions from the toolbar:
|
Option |
Description |
|---|---|
|
Devices |
Select devices from the dropdown to filter the pane. |
|
Time Period |
Select a time period to filter the pane. Select Custom to specify a time period not in the dropdown list. |
|
Refresh |
Click to manually refresh the pane. From the dropdown, you can select an automatic refresh interval. |
|
View Options |
Toggle visibility for the timeline and quick filters. |
The Explorer pane includes the following sections:
|
Section |
Description |
||||||||||
|---|---|---|---|---|---|---|---|---|---|---|---|
|
Timeline |
Displays the number of alerts by severity in a stacked bar chart on a timeline. A legend for the severity displays next to the timeline. You can click a severity level in the legend or on the bar chart to filter the pane by that severity level. Click the severity level again to remove the filter. The timeline is disabled by default. You can enable it from the View Options dropdown. |
||||||||||
|
Quick Filters |
Displays the available values to filter the pane by according to the following fields:
The available values are impacted by the device, time period, and quick filters that are already set in the pane. The total number of records is displayed at the top of the quick filter. Click a value in the quick filter widgets to filter the pane by that value. Click multiple values to apply the filters with an AND relationship. You can use the Search filter bar in the quick filter widgets to find specific values. To remove filters, click the X in the search bar for the quick filter widget. The quick filters are enabled by default. You can disable the quick filters individually from the View Options dropdown. |
||||||||||
|
Displays the alerts in a table view. Use the search bar to find specific alerts in the table. You can perform the following actions on the alerts:
|
When applicable, the risk score will appear next to the endpoint or user in the quick filters and related alerts table.
The following columns are available for the Related Alerts table view:
|
Column |
Description |
|---|---|
|
Severity |
The alert severity level. |
|
Last Occured |
How long ago the most recent log occured related to the alert. |
|
Alert |
The alert subject line. |
|
Endpoint |
The affected endpoint. |
|
Source |
The source of the alert activity. This is the actor or system that initiated the action; it could be a user, IP, device, or process. See additional explanation below the table. |
|
Target |
The affected target. This could be a device, user, service, or file. See additional explanation below the table. |
|
User |
The affected user. |
|
Alert Type |
The alert type, such as Traffic. |
|
Alert Status |
The alert status, such as Unhandled or Mitigated. |
|
Details |
A breakdown of target IPs and endpoints. |
|
Device Name |
The device that sent logs to trigger the alert. |
|
Rule |
The rule that triggered the alert. |
|
Alert Handler |
The alert handler containing the rule that triggered the alert. |
The Source and Target fields can support incident triage and prioritization. They can help determine if a threat is external or internal, and they make it easier to understand the attack impact and intent.
Examples:
-
If a hacker tries to break into a server:
Source = hacker’s IP or device
Target = the server
-
If a user logs into a system:
Source = the user
Target = the system being accessed
FortiAnalyzer assigns the Source and Target based on the group-by fields in the triggered alert handler.
-
Source: source IP, source user, process name
-
Target: destination IP, target host, affected user or object
For more information about alert handler configuration, see Creating a custom alert handler.
Alert details pane
You can double-click a record in the Related Alerts table to open an alert details pane. 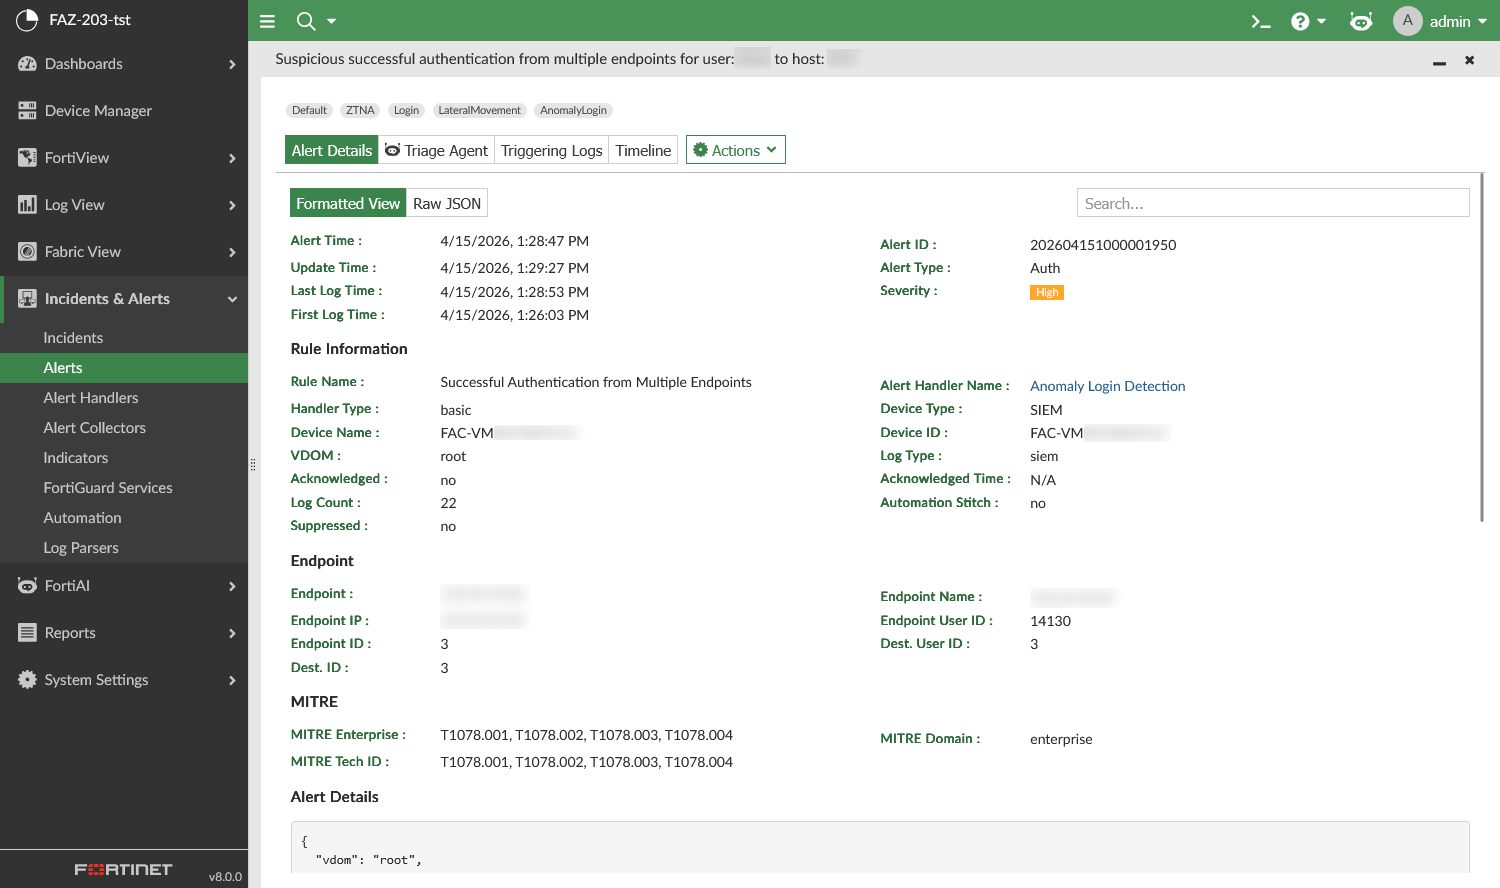
This pane is named after the alert, and it displays with the following tabs:
|
Tab |
Description |
|---|---|
|
Alert Details |
Displays the alert details in a formatted view. You can toggle to view the raw JSON. You can use the search bar to find specific information within the alert details. At the bottom of the Formatted View, you can add or edit a Note for the alert. In the Formatted View, you can click the value in the Endpoint field to display the endpoint details pane. For more information about this pane, see Asset List. |
|
Triage agent |
The triage agent is available with a valid license for FortiAI. For more information, see Alert triage agent. |
|
Triggering Logs |
Displays a sample of logs that triggered the alert. You can view the log details in this tab. |
|
Rule Summary |
Displays information about the alert handler rule that triggered the alert. This includes the rule name, description, log type, severity, pattern, threshold, and group by information. |
|
Timeline |
Displays a timeline for related alerts. From the Entity dropdown, select the entity/entities to include in the timeline. Click alerts in the timeline to open the alert details pane. |
The Actions dropdown in this pane includes the same actions as available from the Related Alerts table. See Related Alerts above.
To support investigation, you can also access the alert details pane from endpoints and users in the Asset Identity List. For more information, see Asset List and Identity List.