Creating a custom correlation handler
You can create a custom correlation alert handler from scratch or clone a predefined correlation alert handler and customize its settings. See Cloning alert handlers.
To create a basic alert handler, select Correlation for the Alert Handler Type when creating the alert handler.
Configuring an correlation handler includes defining the following main sections in the GUI:
|
Option |
Description |
|---|---|
|
Correlation alert handler attributes |
The name, description, alert handler type (correlation), MITRE techniques, automation stitch, data selector, and threshold duration for the correlation handler. You can also enable the alert handler to automatically create an incident, if needed. |
|
Correlation Sequence |
The rules for alert generation in sequence and logic group.
|
|
Correlation Criteria |
The correlation criteria to specify the type of logs that the alert handler will look for. The criteria is applied to two rules on a field from each rule. |
|
Handler Settings |
The alert fields, including the alert type, message, status, severity, indicators, and tags. This section also includes the notification profile for the correlation handler. |
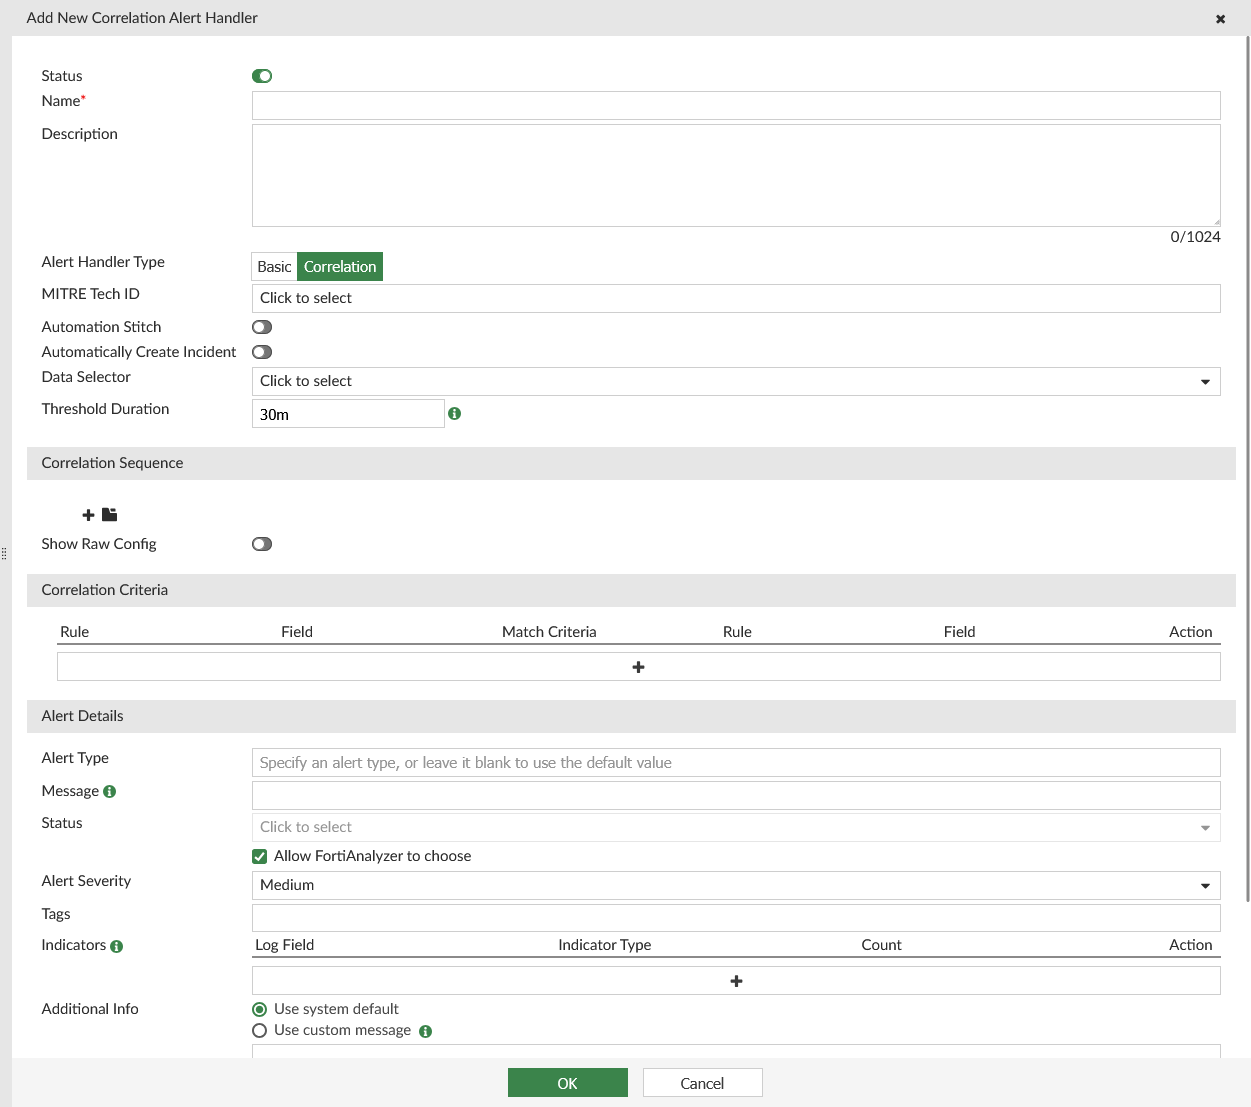
To create a new correlation alert handler:
-
Go to Incidents & Alerts > Alert Handlers > Alert Handlers.
-
In the toolbar, click Create New.
-
For Alert Handler Type, select Correlation. For more information, see the table below.
-
Configure the following options, and click OK to save the alert handler.
Option
Description
Status
Enable or disable the alert handler.
Enabled alert handlers show a
 icon in the Status column. Disabled alert handlers show a
  icon in the Status column.
Name
Enter a name for the alert handler.
Description
(Optional) Enter a description for the alert handler.
Alert Handler Type
Select one of the following:
-
Basic: an alert is generated when one of the rules in the alert handler is met. Each rule in the basic alert handler has an OR relationship with the others.
-
Correlation: an alert is generated when a set of rules are met in correlation sequence. For correlation handlers, you can define both the rules and the operators (AND, AND_NOT, OR, FOLLOWED_BY, and NOT_FOLLOWED_BY).
Once the alert handler is saved, you cannot edit the Alert Handler Type. You must instead recreate the alert handler with the correct alert handler type.
In this case, select Correlation.
MITRE Tech ID
Select the MITRE ATT&CK technique ID(s) that the alert handler provides coverage for. For more information, see MITRE ATT&CK®.
Automation Stitch
Enable or disable automation stitch.
When enabled, FortiAnalyzer sends a notification to FortiGate when alerts are generated by the alert handler. The alerts are available in the FortiAnalyzer GUI as well. For more information, see Using the Automation Stitch for alert handlers.
Automatically Create Incident
Enable or disable if incidents are automatically created through this alert handler.
When enabled, once the handler triggers an alert, a new incident is created with the name as
<Handler Name>: <Alert Subject>. If there are new alerts with same subject, they will be directly attached to the same incident. A new incident is created if the alert has a new subject, or if the existing incident's status has changed to Closed.The incidents created from alert handlers can be identified in Incident & Alerts > Incidents > Incidents. The automatically created incidents display
<alertid>/Auto-Raisedin the Incident Reporter column .Data Selector
Select a data selector for the alert handler.
This selects devices, subnets, and filters used for the alert handler. See Creating data selectors.
Threshold Duration
Enter the threshold duration for the correlation handler in minutes.
The logs must match the criteria in correlation sequence within this time to generate an alert.
Correlation Sequence
Add Rule
Click the plus icon (+) to add a rule. The Add New Rule pane displays. Configure the options below and click OK to save the rule.
After creating the rules, make sure they are in the correct correlation sequence. You can drag and drop the rules to re-order them, if needed.
Select the correlation between each of the rules:
- AND
- AND_NOT
- OR
- FOLLOWED_BY (if selected, enter a time limit for the correlation to occur in)
- NOT_FOLLOWED_BY (if selected, enter a time limit for the correlation to occur in)
The rules must be met in the correlation sequence for the alert handler to generate an alert.
Click the trash icon to delete a rule.
Name
Enter a name for the rule.
Choose Your Logs
Log Device Type
If you are in a Fabric ADOM, select the log device type from the dropdown list. If you are not in a Fabric ADOM, you cannot change the Log Device Type.
The Fabric log device type can be used to generate alerts from SIEM logs when SIEM logs are available.
Log Type
Select the log type from the dropdown list.
When Devices is set to Local Device, you cannot change the Log Type or Log Subtype.
If generating alerts from SIEM (Fabric) logs, select Normalized Log.
Log Subtype
Select the category of alert that this alert handler monitors. The available options depend on the platform type.
This option is only available when the Log Type has a subtype. For example, Event Log and Traffic Log have log subtypes which can be selected from the dropdown.
Log Field
Select the log fields for the system to categorize logs into smaller groups.
For example, consider the scenario where the Log Field is set using
Source IP (srcip). When log entries are recorded with source IPs such as 192.168.1.1, 192.168.1.2, and 192.168.1.3, the system will categorize these logs into distinct groups:-
Group 1: Logs with the source IP 192.168.1.1
-
Group 2: Logs with the source IP 192.168.1.2
-
Group 3: Logs with the source IP 192.168.1.3
This grouping mechanism allows analysis of log data based on the specified source IP addresses.
If you are using SIEM logs to generate alerts, you can find available log fields for existing log parsers using the Fabric Normalization Reference on the Fortinet Document Library.
Log Filters
Select All or Any of the following conditions.
Configure the condition(s):
-
Log Field: Select a log field from the dropdown.
After the log device and log type are selected, the Log Field dropdown list will only include log fields that belong to the specified log type. For example, the Botnet IP log field is available when the Log Type is DNS, but not available when the Log Type is Event Log. -
Match Criteria: Select an operator from the dropdown. The available options depends on the selected log field.
Some log fields, such as Source Port, will provide a variety of operators in the dropdown list, such as Equal To, Not Equal To, Greater Than or Equal To, Less Than or Equal To, Greater Than, and Less Than.
Other log fields, such as Log Description, will be limited to Equal To and Not Equal To. -
Value: Select a value from the dropdown list or enter a value in the text box. The available options depends on the selected log field.
If there is no dropdown list provided by FortiAnalyzer, you must manually enter a value to find in the raw log.
If a dropdown list is provided, you can select a value from the list. For some log fields, such as Level, the dropdown list also allows you to enter a custom value. If there is no textbox to enter a custom value in the dropdown list, you must use the Generic Text Filter instead.
In the Action column, click plus (+) to insert a new filter below. You can insert multiple filters. To delete a filter, click the x next to the filter.
When generating alerts from SIEM logs, you must include the Data Source Type is Equal To each of the supported third-party logs. For example, if using Windows and Ubuntu log sources, you may configure the following:
-
Log Filters = Any One of the Filters
-
Data Source Type Equal To Windows
-
Data Source Type Equal To Ubuntu
To view the available third-party log parsers, go to Incidents & Alerts > Log Parsers > Log Parsers.
-
Generic Text Filter
Enter a generic text filter. See Using the Generic Text Filter.
For information on text format, hover the cursor over the help icon. The operator
~means contains and!~means does not contain.Define Alert Conditions
Trigger an alert when:
Select the radio button for one of the following options and configure the criteria:
-
A group contains
<integer>or more log occurences -
Within a group, the log field
<log field>has<integer>or more unique values-
Click the toggle icon to change to "[...] has fewer than
<integer>unique values"
-
-
The sum of
<measure>is greater than or equal to<integer> -
Safeguard Risk Score is more than
<value> -
Advanced Mode: This field is used for specialized configuration in select predefined alert handler rules. For example, see Geo-alerting alert handlers and ZTNA login alert handlers.
The "sum" option is used for data exfiltration detection.
This option is only supported in Fabric ADOMs. It is not available when using Web Filter, Application Control, or Email Filter log types.
The "Safeguard Risk Score" option is only available when using Web Filter, Application Control, or Email Filter log types. For an example of a predefined alert handler using this trigger, see Safeguarding alert handler.
Add Logic Group
Click the folder icon to add a logic group.
You must select a correlation between groups (AND, AND_NOT, OR, FOLLOWED_BY, or NOT_FOLLOWED_BY). All groups must be met in correlation sequence for the correlation alert handler to generate an alert.
Click the trash icon to delete a logic group.
Show Raw Config
Enable to display the raw config of the correlation sequence.
Edits made to the raw config will appear above in the correlation sequence fields. If there is an error in the text, the fields will not display and you will not be able to save the changes.
Correlation Criteria
Specify the fields that the alert handler will look for to correlate the rules. Each correlation criteria is applied to two rules, using a field from each rule.
Configure the following options for each correlation criteria:
-
Rule: Select two rules to create a correlation criteria for.
-
Field: Select a field for each rule in the correlation criteria. The fields available in the dropdown are determined by the Group By field in the rule.
-
Match Criteria: Select an operator from the dropdown. The available options depends on the selected fields.
Use the buttons in the Action column to add (+) or remove (x) correlation criteria.
Alert Details
Alert Type
Specify a custom alert type, or leave this field blank to use the default value.
Message
(Optional) Enter a custom alert message.
By default,
Group by key-value pair(s)will be displayed as the alert message in Alerts.Examples:
-
Virus:JS/Runfile.B!tr
-
Endpoint:172.17.58.118 Virus:BlackMoon
You can customize alert messages by using Group By variables: $groupby1 and $groupby2
Examples:
-
Virus $groupby1 found in traffic
-
Endpoint $groupby1 infected with virus $groupby2
Status
Select Allow FortiAnalyzer to choose or select a status from the dropdown list: Unhandled, Mitigated, Contained, (Blank). You can use a custom alert status by clicking the plus (+) that appears in the Alert Status dropdown.
Alert statuses, including custom statuses, are displayed in the Alert Status column in Alerts.
Alert Severity
Select the severity from the dropdown list: Critical, High, Medium, or Low.
Tags
(Optional) Enter custom tags.
Tags can be used as a filter when using default or custom views.
Indicators
(Optional) Add indicators by clicking the plus (+). You can configure the Log Field, Indicator Type, and Count for each indicator created in an alert handler. Use the buttons in the Action column to add (+) or remove (x) indicators. Up to five indicators can be created.
When Indicators is selected in Alerts > Display Options, the Indicators column displays indicator types for detected alerts. You can see additional details when clicking on an indicator. See Alerts.
If an incident is raised from an alert that includes indicators, they can be viewed in the Indicators tab of the incident analysis page. See Analyzing an incident.
Additional Info
Specify what to show in the Additional Info column of Alerts.
Select Use system default or Use custom message. A custom message can include variables and log field names. For more information, hover over the help icon.
You can decode the attackcontext in IPS logs in alert notifications by including the following in the custom message:
${b64_decode(attackcontext)}. For more information, see Decode the attackcontext field in IPS.Notifications
Select a notification profile for the alert handler. See Creating notification profiles.
-