Blocking indicators
You can block suspicious indicators directly from FortiAnalyzer. This can help you to reduce potential risks and quickly respond to known threats by blocking suspicious IPs, URLs, domains, or MAC addresses.
FortiAnalyzer can use the following connectors to block indicators:
-
FortiMQ Connector: This connector enables direct transmission of blocked indicators to FortiGate devices.
For configuration instructions, see To setup the FortiMQ connector on FortiAnalyzer:.
-
FortiManager Connector: This connector distributes block lists to FortiGate devices from the FortiManager.
For configuration instructions, see To setup the FortiManager connector on FortiAnalyzer:.
When both FortiManager and FortiMQ connectors are active, priority is given to the FortiMQ connector. Blocking via FortiManager remains supported; however, indicators are sent via FortiManager only if the FortiMQ connector is disabled.
Unlike FortiManager, which operates at a global level, the FortiMQ connector is ADOM-specific. Blocked indicators through FortiMQ are applied only to FortiGate devices within the same Fabric or FortiGate ADOM in FortiAnalyzer.
If both connectors are not setup or active, the Block option will be grayed out in the Incidents and Indicators panes.
When the FortiMQ connector is setup and active, a tooltip displays when mousing over the Block option: “Block/Unblock will be carried out by FortiMQ connector.” 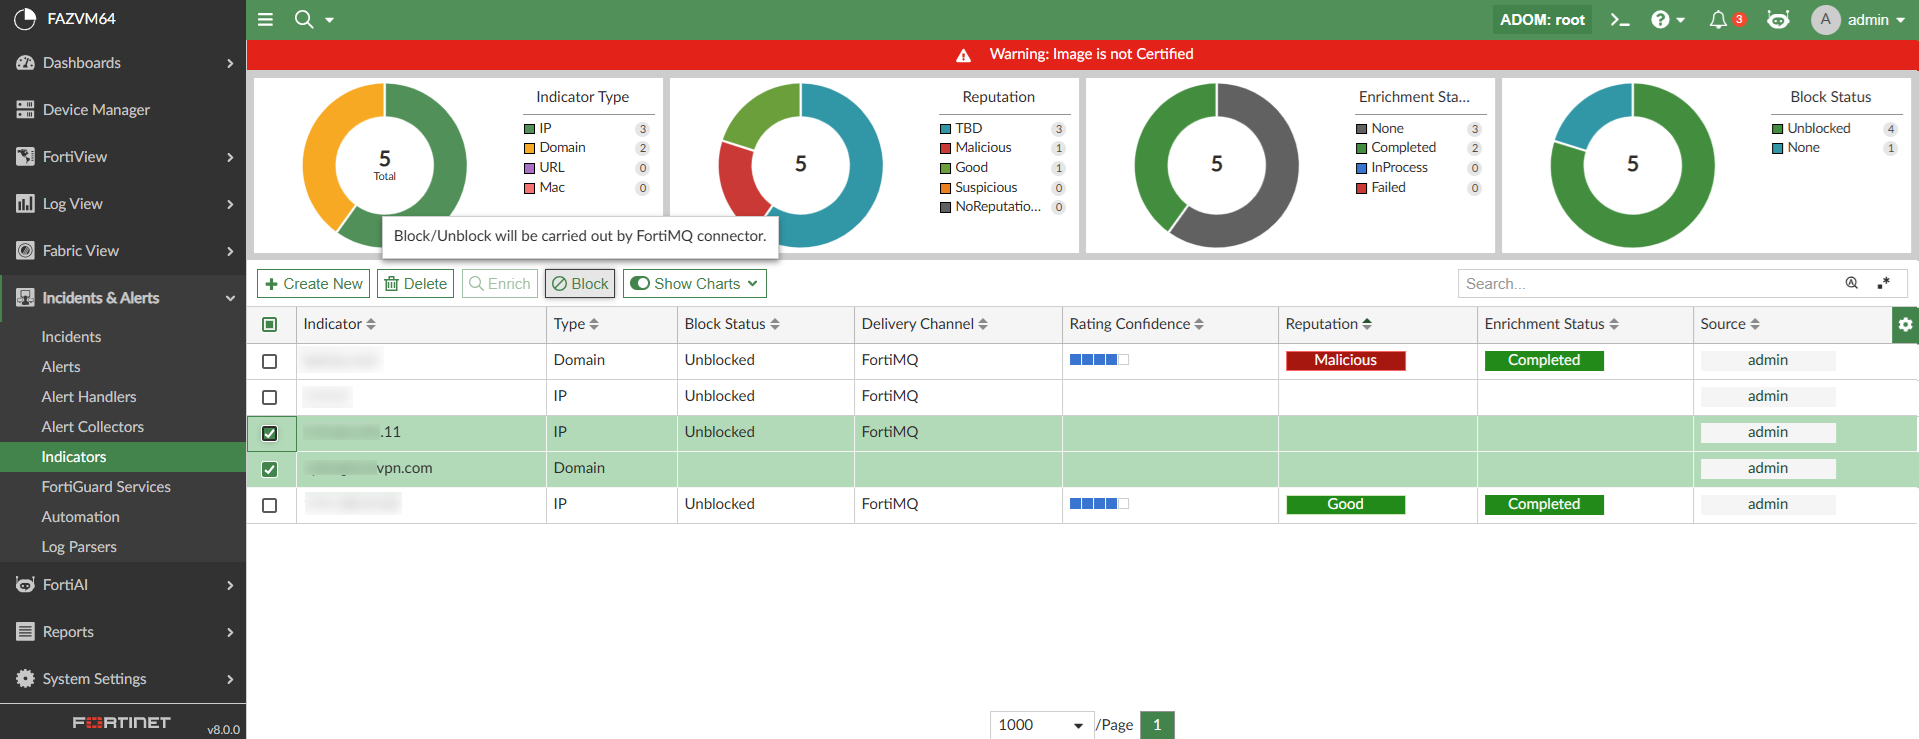
The Block indicator option is available in:
-
Incidents & Alerts > Indicators
-
Incidents & Alerts > Incidents > Incidents
-
Incidents & Alerts > Incidents > Incidents > Incident Analysis
You can also block indicators from Log View by right-clicking the ip, url, domain, or mac-address in the table view or detailed view and selecting Create indicator and block from the shortcut menu. This action adds a new indicator and blocks it automatically.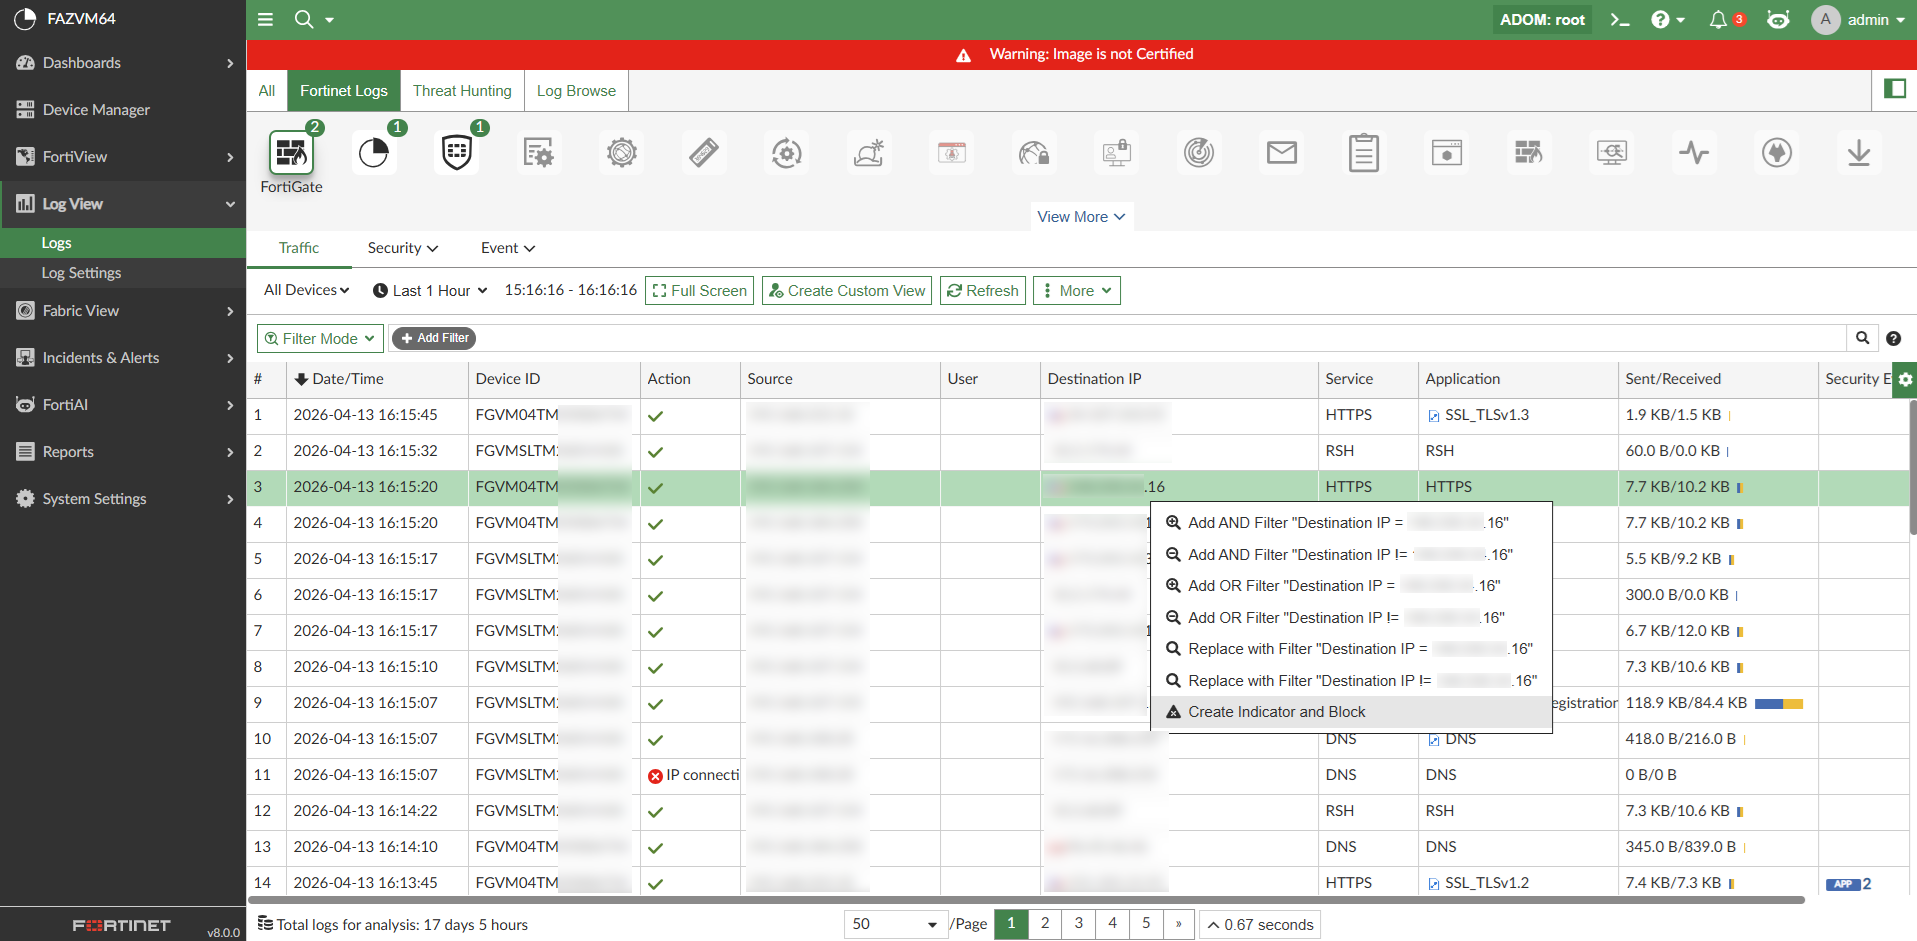
Indicators can also be unblocked from the FortiAnalyzer GUI as well. When a blocked indicator is selected in Incidents & Alerts > Indicators, the Unblock action becomes available in the toolbar and shortcut menu.
In Incidents & Alerts > Indicators, there is a pie chart and column to display the Block Status of the indicators: TBD, Blocked, and Unblocked. 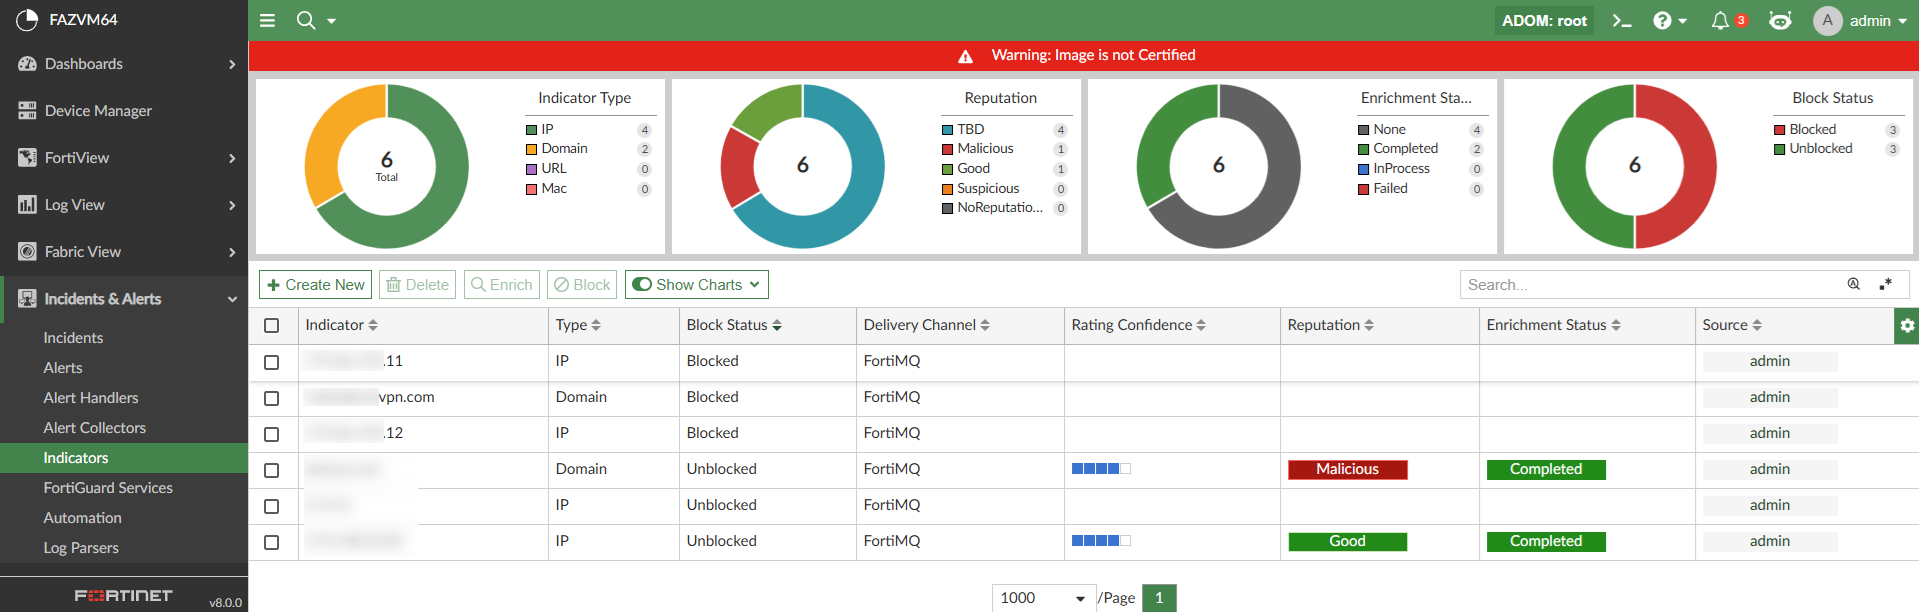
Blocking indicators with the FortiMQ connector
After blocking or unblocking indicators using the FortiMQ connector, the block_indicator playbook runs in the background and sends the indicators to FortiMQ.
FortiGate retrieves these indicators from FortiMQ and updates them in the external feeds. These feeds can then be used in policies or profiles to deny access. External feeds are updated on FortiGate with the indicators sent from FortiAnalyzer. For example, see below: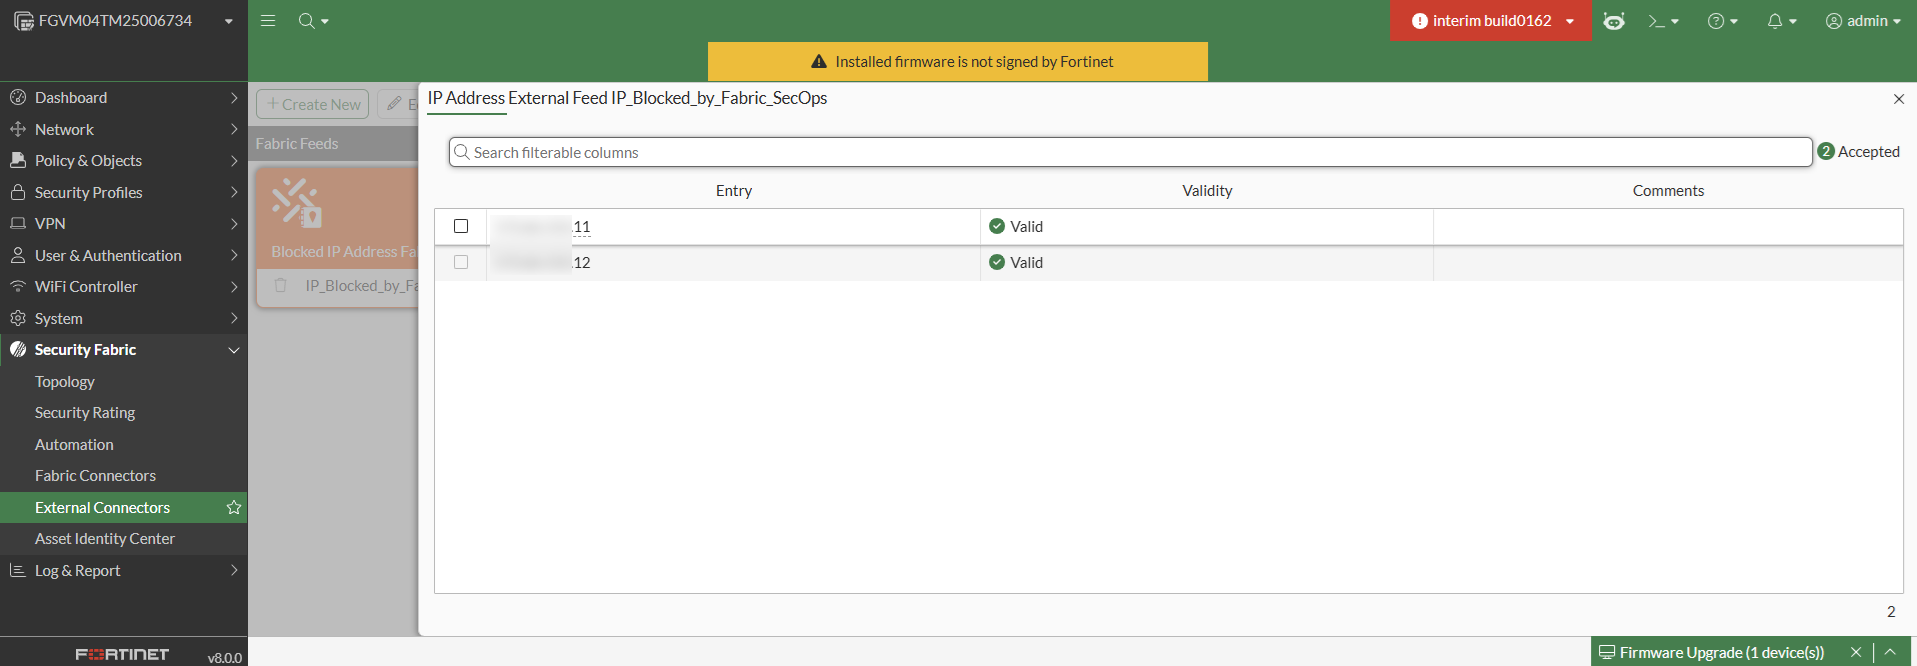
To setup the FortiMQ connector on FortiAnalyzer:
-
Go to Incidents & Alerts > Automation > Active Connectors, and enable the FortiMQ Connector.
The FortiMQ connector is available and disabled by default in all Fabric and FortiGate-type ADOMs.
When enabled, this connector automatically establishes a connection to the FortiMQ cloud service; no additional configuration is required. The connector status reflects its health, indicating whether the API connection is successful.
To use the FortiMQ Connector to block indicators, you must also complete the following in addition to enabling the connector:
-
Enable logging from the FortiGate devices to FortiAnalyzer. For more information, see the FortiAnalyzer Administration Guide and the FortiGate/FortiOS Administration Guide.
-
Verify that both FortiAnalyzer and FortiGate are registered under the same FortiCare account to allow proper communication and integration.
-
Enable and configure Cloud-based Fabric Feed synchronization on FortiGate to consume and enforce the block indicators received. For more information, see the FortiGate / FortiOS 8.0 New Features Guide.
After blocking indicators using the FortiMQ connector, the block_indicator playbook runs in the background and sends the indicators to FortiMQ.
FortiGate retrieves these indicators from FortiMQ and updates them in the external feeds. These feeds can then be used in policies or profiles to deny access. External feeds are updated on FortiGate with the indicators sent from FortiAnalyzer. For example, see below:
Blocking indicators with the FortiManager connector
When an indicator is blocked using the FortiManager connector, the Block Status column in Indicators will initially display Blocked (Pending). In the backend, the block_indicator playbook runs every five minutes to send the information to FortiManager. After the playbook is run, the status for the indicator will change to Blocked. In this case, the Blocked status on FortiAnalyzer confirms that the list is updated on FortiManager, but it is not synced to the FortiGate.
When the block_indicator playbook is successfully run, the blocked indicator will be pushed to FortiManager's External Resource list. This list will be used to create threat feeds, security profiles, and policy blocks on FortiManager to push the policies to the identified FortiGate. It can also be used to update all FortiGates to block the suspicious indicators.
The External Resource is saved in FortiManager as "<FortiAnalyzer ADOM name>-BLK<indicator-type>". For example the root ADOM's blocked IPs will be named root-BLKIP. For example, see below.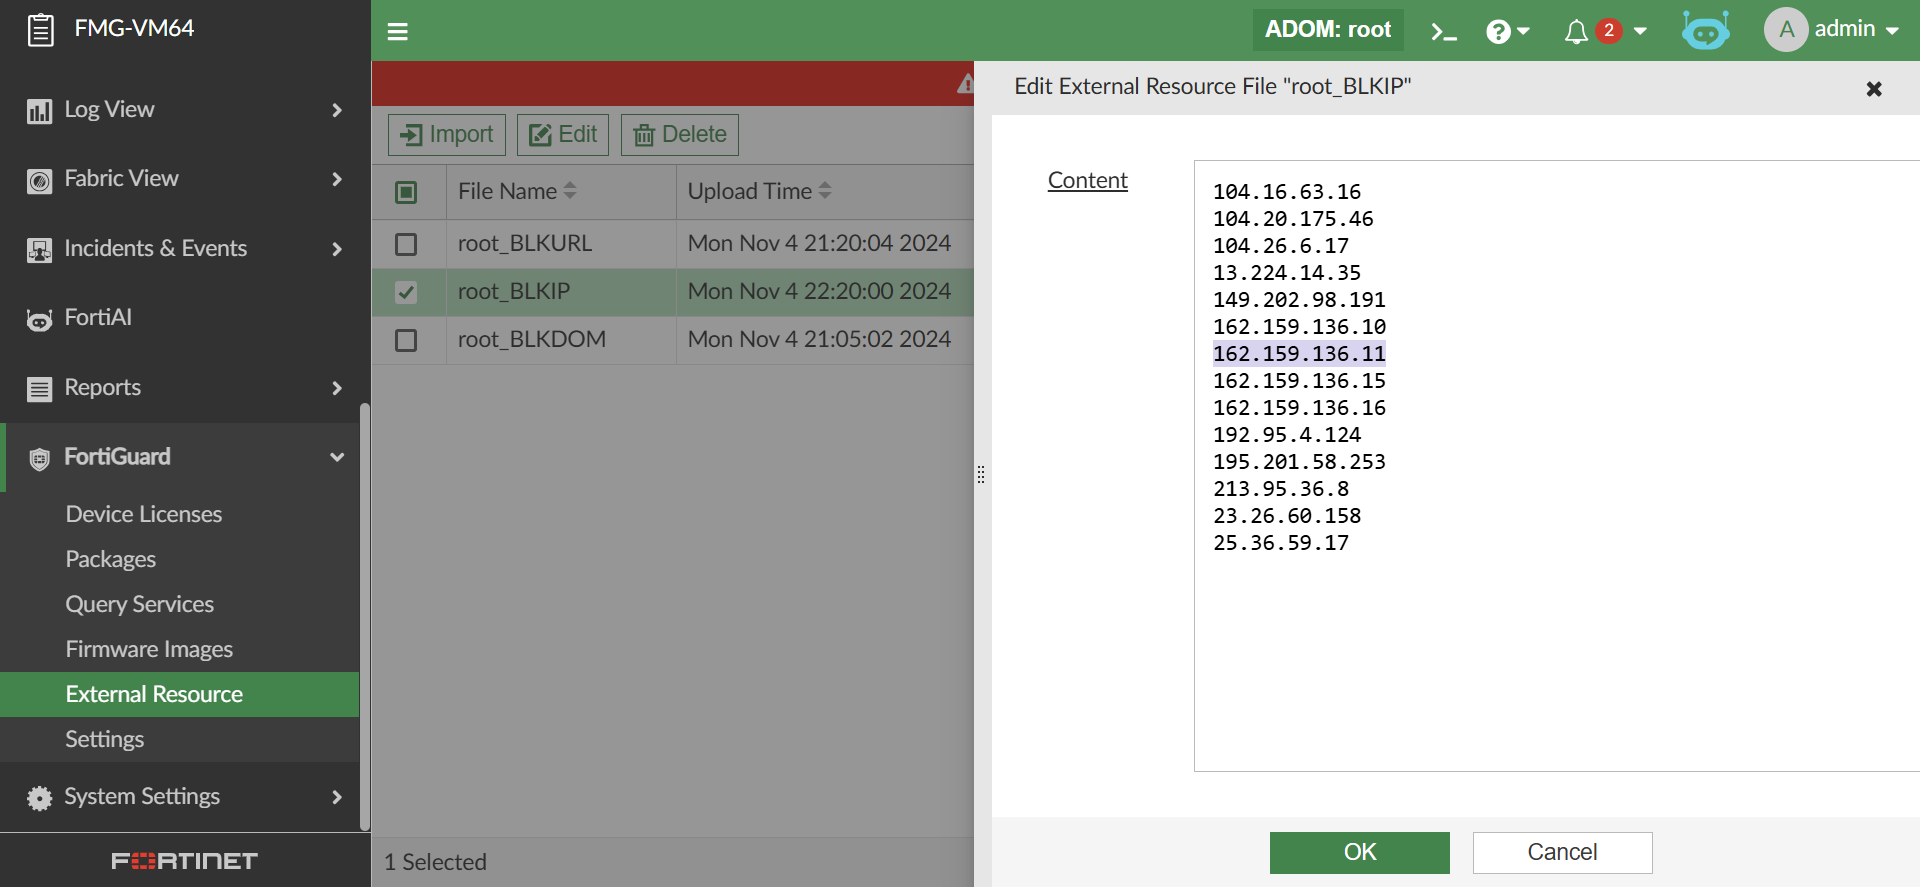
The FortiManager firmware version must be the same as FortiAnalyzer for the block list to be pushed to FortiGates.
Unblocking the indicator updates the External Resource on FortiManager by removing the unblocked indicator information. Once complete, the status of the indicator changes to Unblocked.
To setup the FortiManager connector on FortiAnalyzer:
The following configuration is required in the FortiManager CLI before adding a FortiAnalyzer using a fabric connection:
config system csf
set status enable
set accept-auth-by-cert enable
end
In both the FortiAnalyzer and FortiManager CLI, under config system interface, the port's allowaccess setting must include fabric.
For more information, see the FortiManager Administration Guide.
-
In the FortiAnalyzer, go to Incidents & Alerts > Automation > Active Connectors.
-
Double-click the FMG Connector.
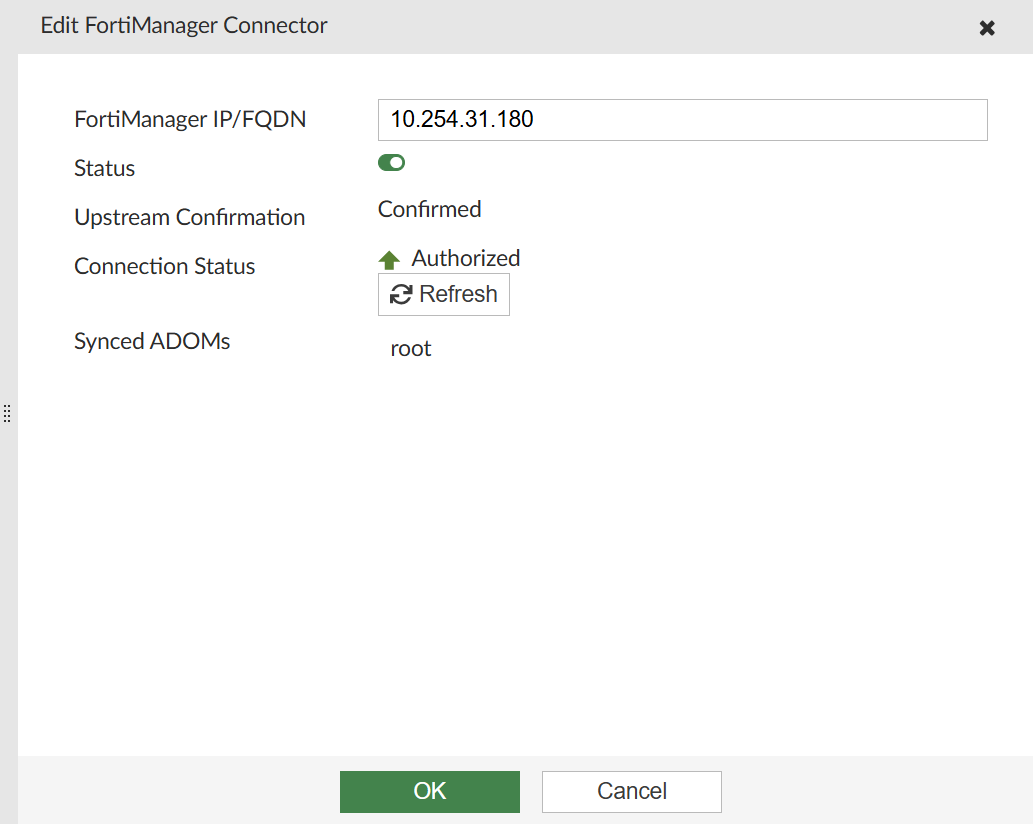
The Edit FortiManager Connector pane displays.
-
In the FortiManager IP/FQDN field, enter the IP of the FortiManager.
-
Toggle the Status to Enabled.
-
Click OK and wait for the connection.
-
Once the connection status is Pending Authorization, click Authorize.
-
In the authorization page, select the ADOM to add the FortiAnalyzer to and click Next.
-
After authorizing, the FortiAnalyzer is added to FortiManager under Device Manager > Device & Groups > Managed FortiAnalyzer.
Alternatively, you can authorize the FortiAnalyzer from the FortiManager GUI.