


Digital Experience Monitoring
To assist network administrators with troubleshooting remote user connectivity issues to common SaaS applications, FortiSASE includes a digital experience monitoring (DEM) page accessible from Network > Digital Experience Monitoring.
You can also add a Digital Experience Monitoring widget to Dashboards > Status.
To monitor end-to-end network performance from an endpoint to a FortiSASE PoP and to a SaaS application, see Digital Experience.
|
|
To be configurable, the DEM feature requires either an Advanced remote users FortiSASE license or a Comprehensive remote users FortiSASE license. See the FortiSASE Ordering Guide. |
Network > Digital Experience Monitoring displays a list of SaaS applications and health check metrics for first-mile connectivity between the geographical points of presence (PoPs) provisioned for your FortiSASE instance and these SaaS applications. An administrator can use this information to determine if remote user traffic is passing through a PoP with ideal connectivity or with some ongoing connectivity issues.
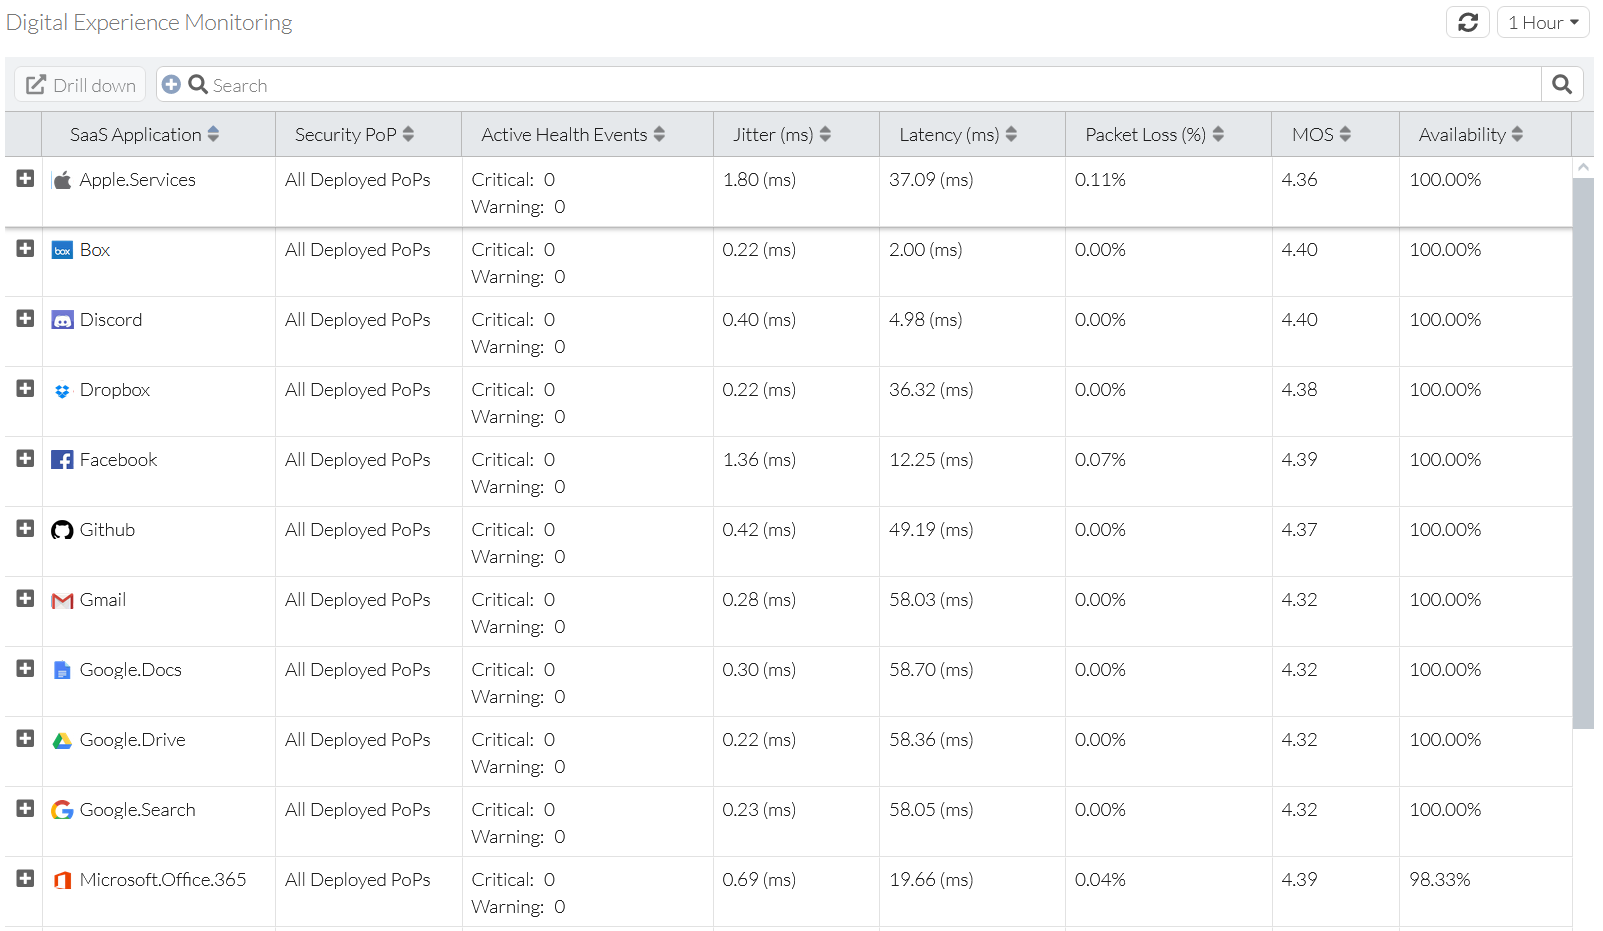
Digital Experience Monitoring displays historic data that you can filter by the following durations:
- One hour (default)
- One day
- One week
- One month
- One year
You can also refresh data for the selected time duration.
You can view more details for each metric by hovering the mouse over a metric to display tooltips.

You can view more details for a specific SaaS application using one of these methods:
- Selecting an application and clicking Drill down
- Double-clicking an entry
- Right-clicking while an application is selected and selecting the drilldown option
The drilldown page provides more detail for the time duration selected in the form of charts and tables.

From the main or the drilldown page, you can perform the following operations:
- Best Fit Columns
- Reset Table
- Export displayed data to a file in CSV or JSON format
- Select Columns