
New features and enhancements
This document provides information about FortiNDR version 7.6.3 build 0656.
The following is a summary of new features and enhancements in version 7.6.3.
- View user account information in the Sessions tab
- Detection context
- View device inventory by Mac or IP address
- Log settings
- ML configuration and discovery
- Sample processing widget
- Notifications widget
- Global investigations
- Device enrichment
- CLI
- Other improvements
For details, see the FortiNDR7.6.3 Administration Guide in the Document Library.
View user account information in the Sessions tab
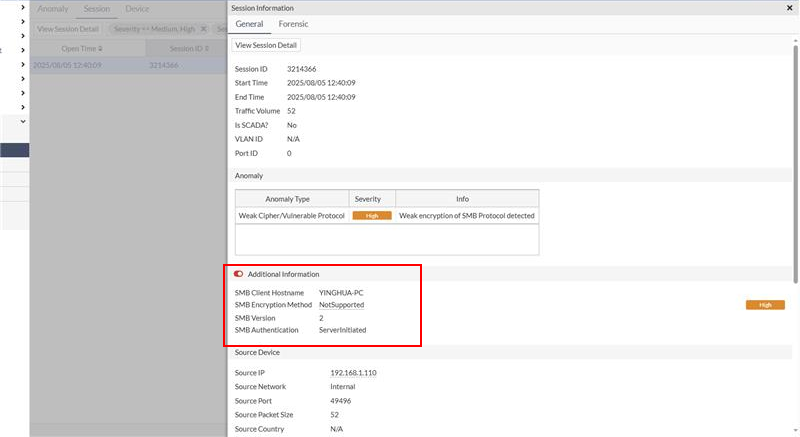
FortiNDR supports extracting and displaying user account information from legacy and unencrypted protocols. This includes:
- SMB (Server Message Block) y version 1
- POP3 (Post Office Protocol version 3)
- IMAP (Internet Message Access Protocol)
- SMTP (Simple Mail Transfer Protocol)
- Kerberos
When these protocols are used in network communications, the system can extract and display the account information such as the username or email address.
To view the account Information:
- Open the Sessions tab.
- Double-click on an individual session.
Within the session details, you will find extracted account information under Additional Information .
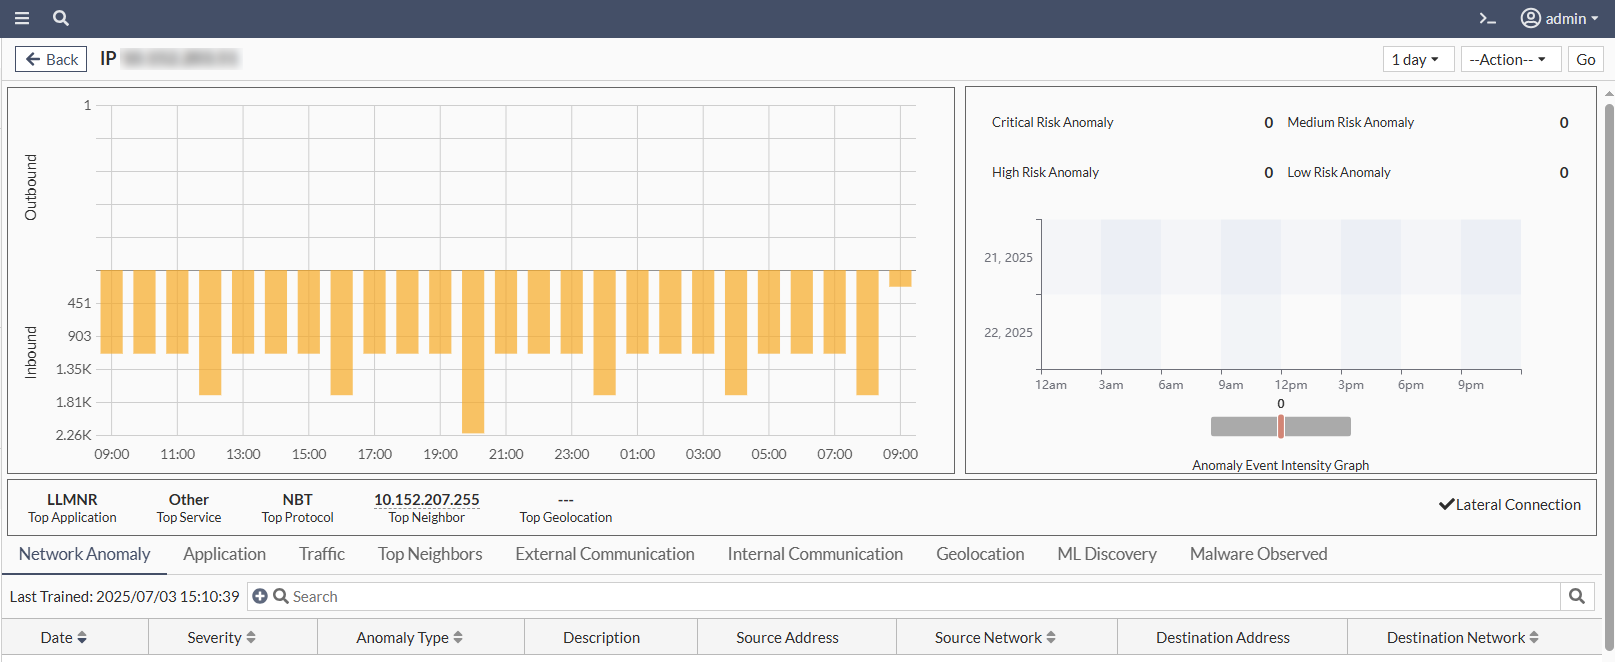
Detection context
The Detection Context page allows you to view both malware and NDR detections in a single timeline. The page focuses on a specific IP address and a selected anomaly event, displaying all anomaly events surrounding the targeted event within a chosen time frame (1 day, 1 week, or 1 month). The timeline graph supports a maximum of 5,000 events: 2,500 before and 2,500 after the selected network attack event.
Identical anomaly events (defined by the same source IP, destination IP, anomaly type, and anomaly content) are grouped into a single event block. Each block includes a count indicating the number of actual occurrences. When these identical events are separated by other types of anomalies in the timeline, the block is anchored to the timestamp of the first occurrence, which is labeled as the Discovery Date.
The Network Anomaly and Malware Observed tables below the timeline display ungrouped anomaly events or malware detection events individually, as shown in the timeline graph. The table can support up to 5,000 entries.
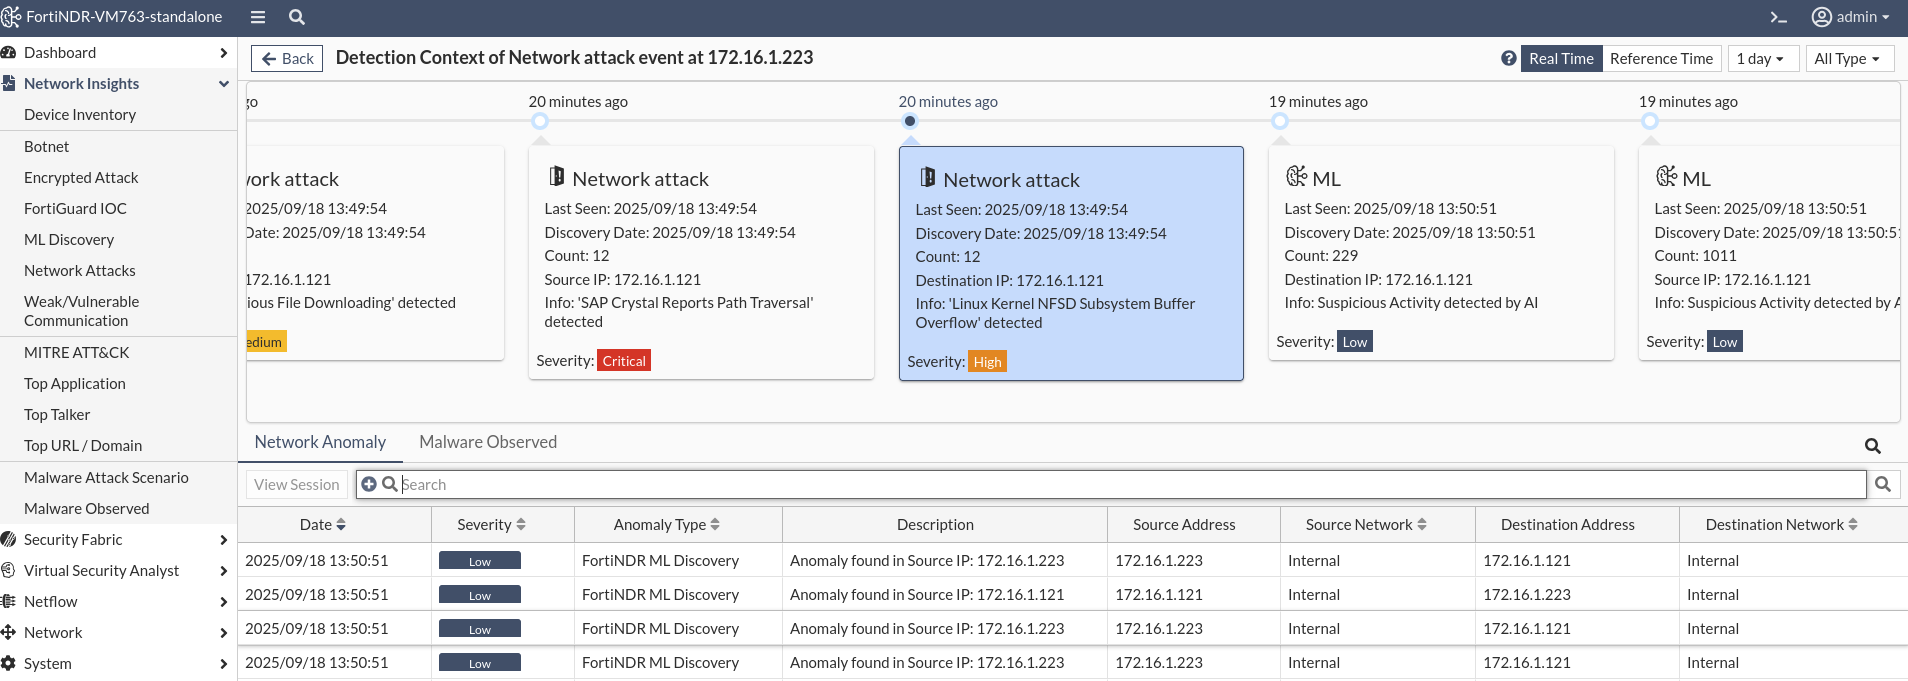
You can access the Detection Context by selecting a session in the Session tab, clicking View Detection, and then selecting either View Detections by Source or View Detections by Destination.
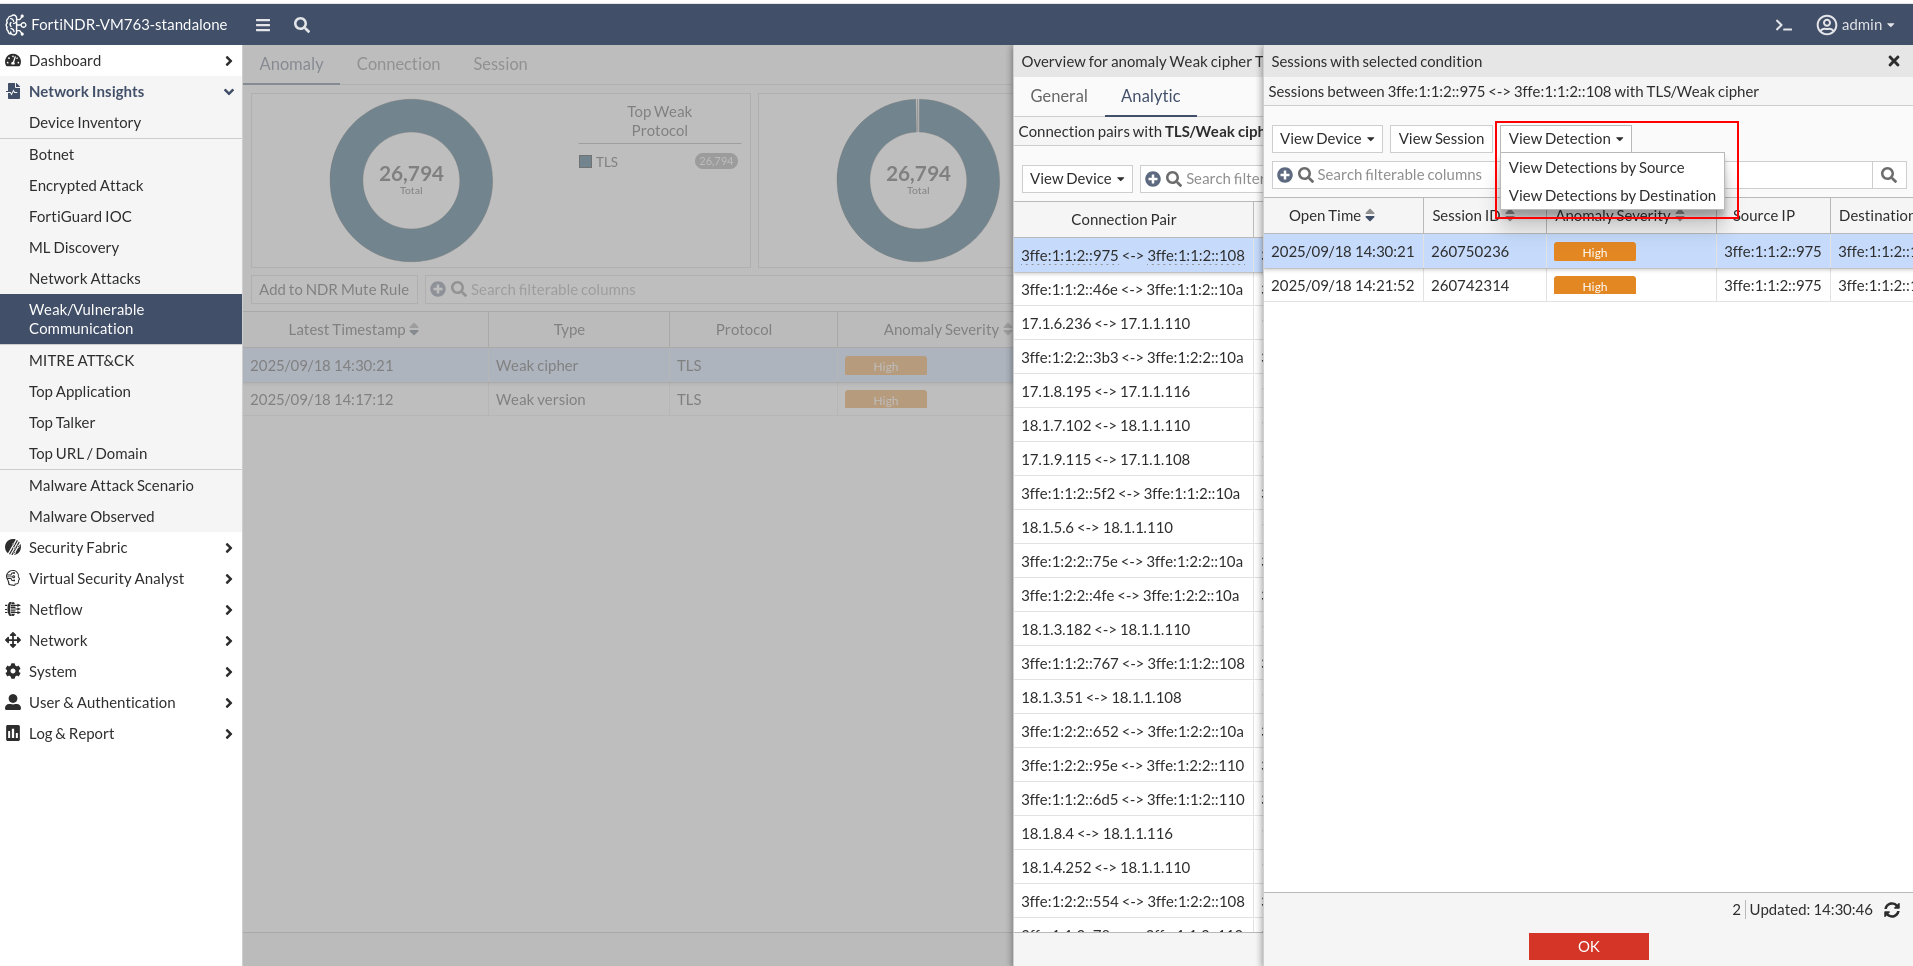
You can also access the Detection Context from the Anomaly tab or NDR logs by clicking a detection pair in the Analytic tab.
View device inventory by Mac or IP address
You can now use the view selector on the right corner of the Device Inventory table to view devices By Mac or By IP.
- By MAC: Each row represents a unique device identified by its MAC address. The IP address shown is the most recent one used by that device.
- By IP: Each row represents a unique IP address. The MAC address shown is the most recent device that used that IP.
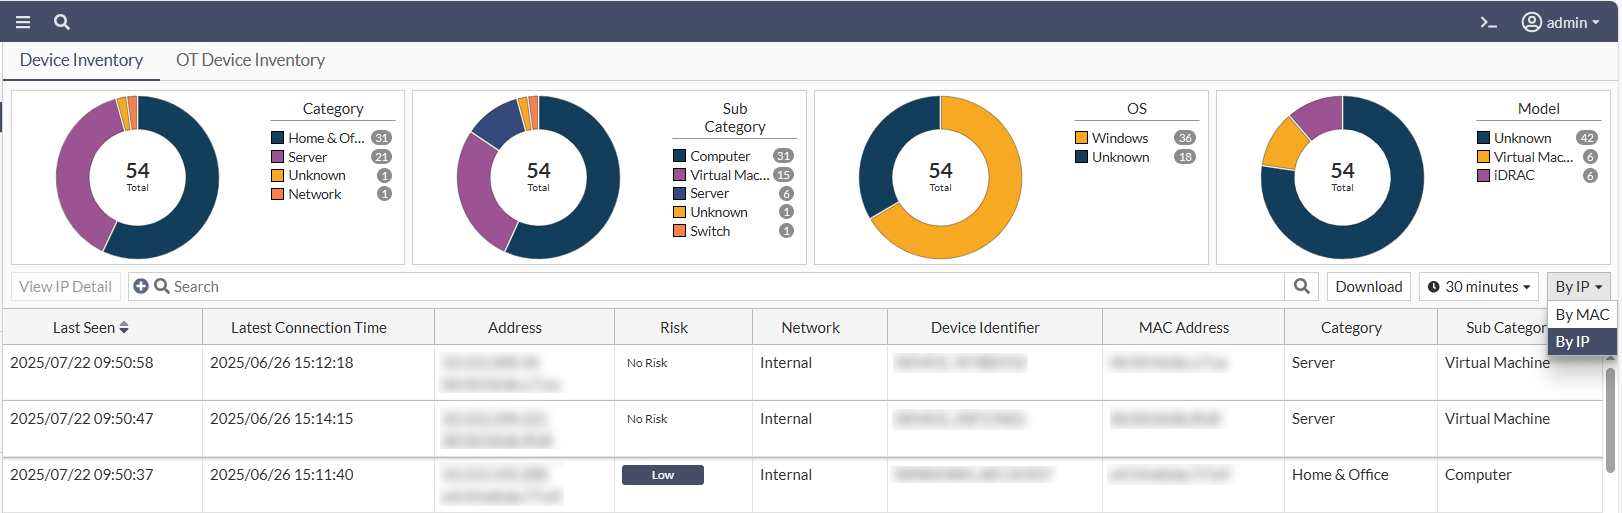
In By IP mode, selecting a row and clicking View IP Detail opens a page similar to the Device Detail view in By MAC mode. However, all information is based on the selected IP rather than the MAC address.
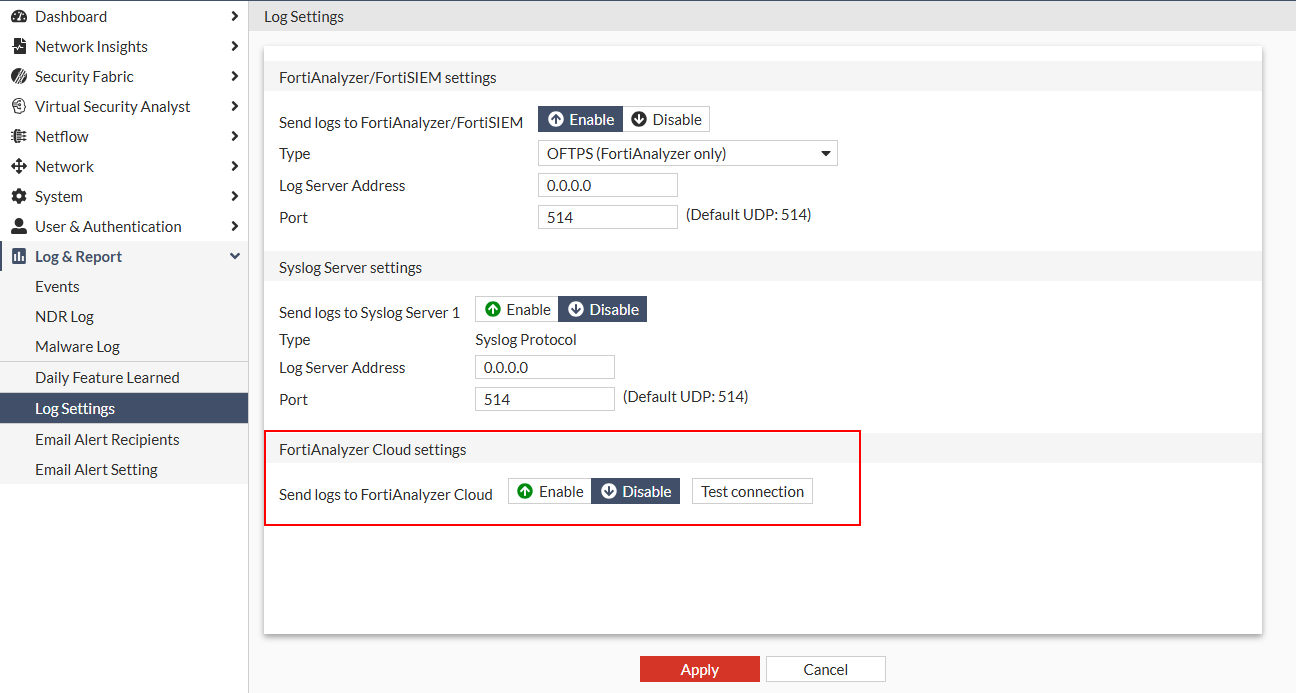
Log settings
The Log Settings can now be configured to send logs to FortiAnalyzer Cloud.
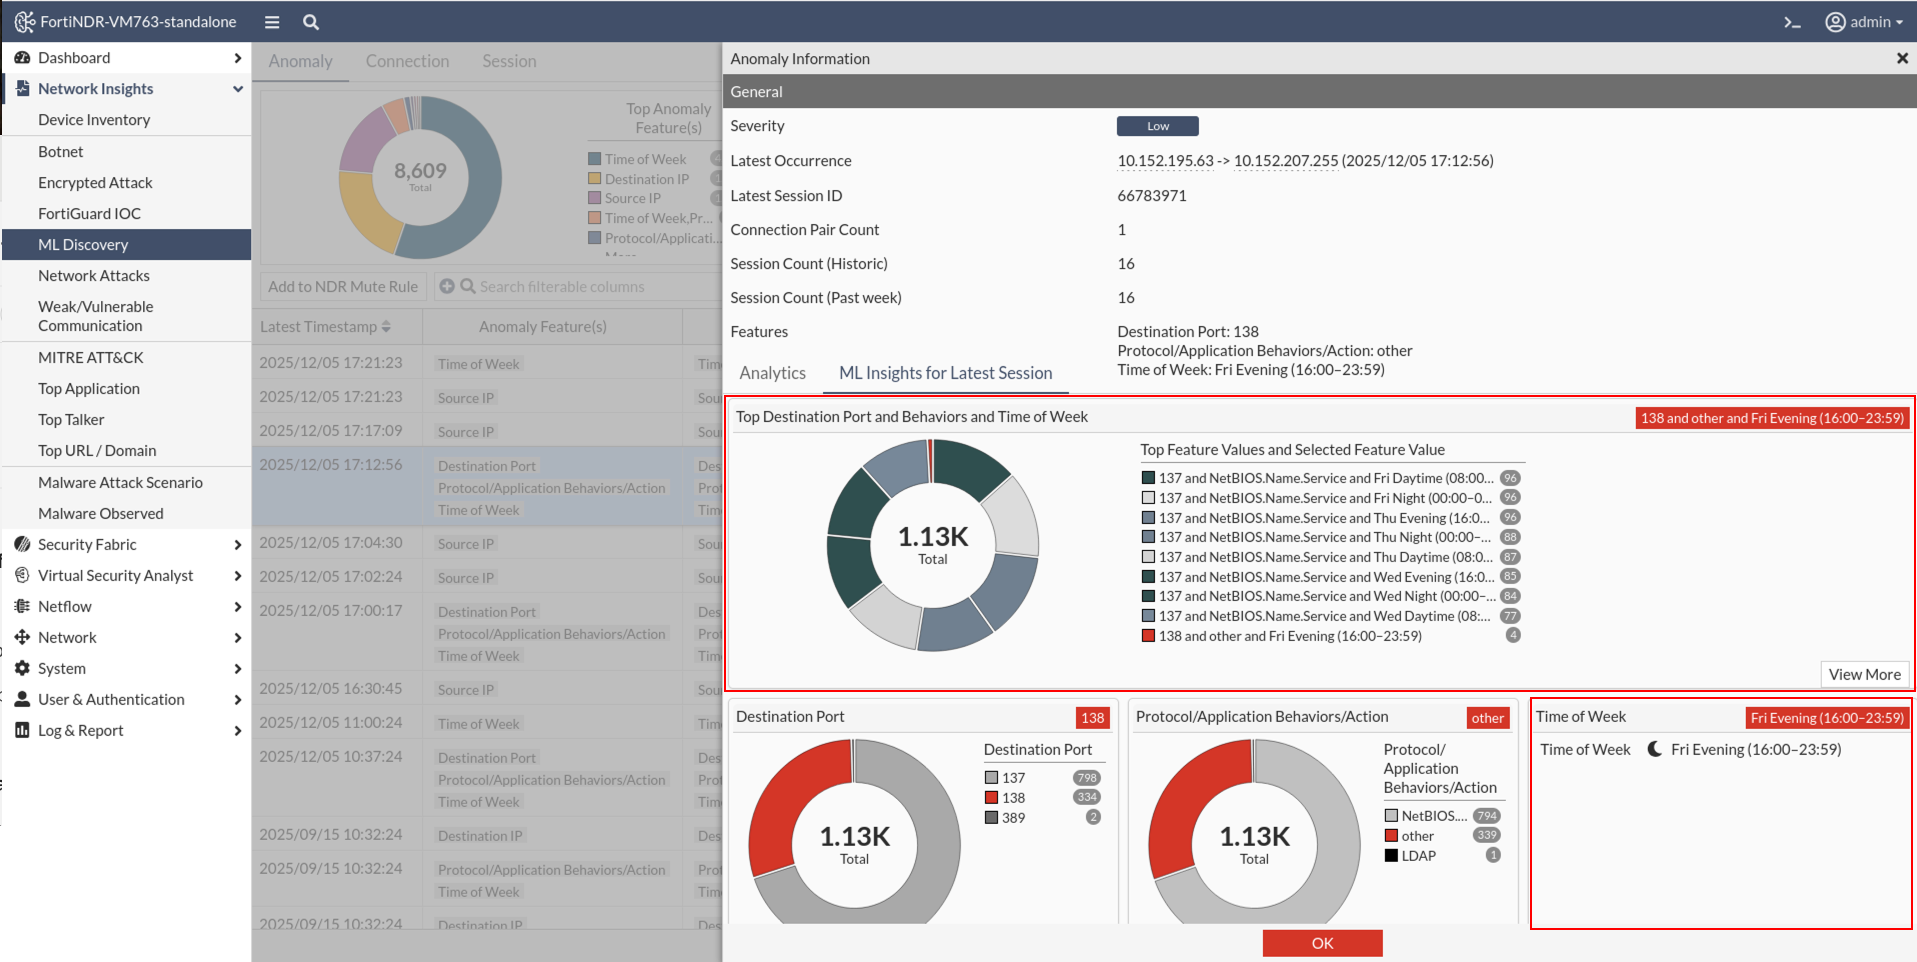
ML configuration and discovery
A new Time of Week option was added to the ML Configuration page to view anomalies based on the time of the week. During Machine Learning training, the system establishes a baseline of activity for each source IP. If traffic is observed during a time period where the baseline is zero (meaning no activity is expected) it is flagged as an anomaly. These anomalies are displayed in the Time of Week widget on the Anomaly Information page.
The time ranges are defined as follows:
- Daytime: 08:00-15:59
- Evening: 16:00 – 23:59
- Night : 00:00 – 07:59
The ML Insights charts displays the cumulative number of sessions observed since the start of training. You can hover over any time period to view the exact session count.
- A red tile indicates anomalous time periods. These had zero sessions during training but now show activity.
- An empty tile represent time periods with no sessions recorded since training began.
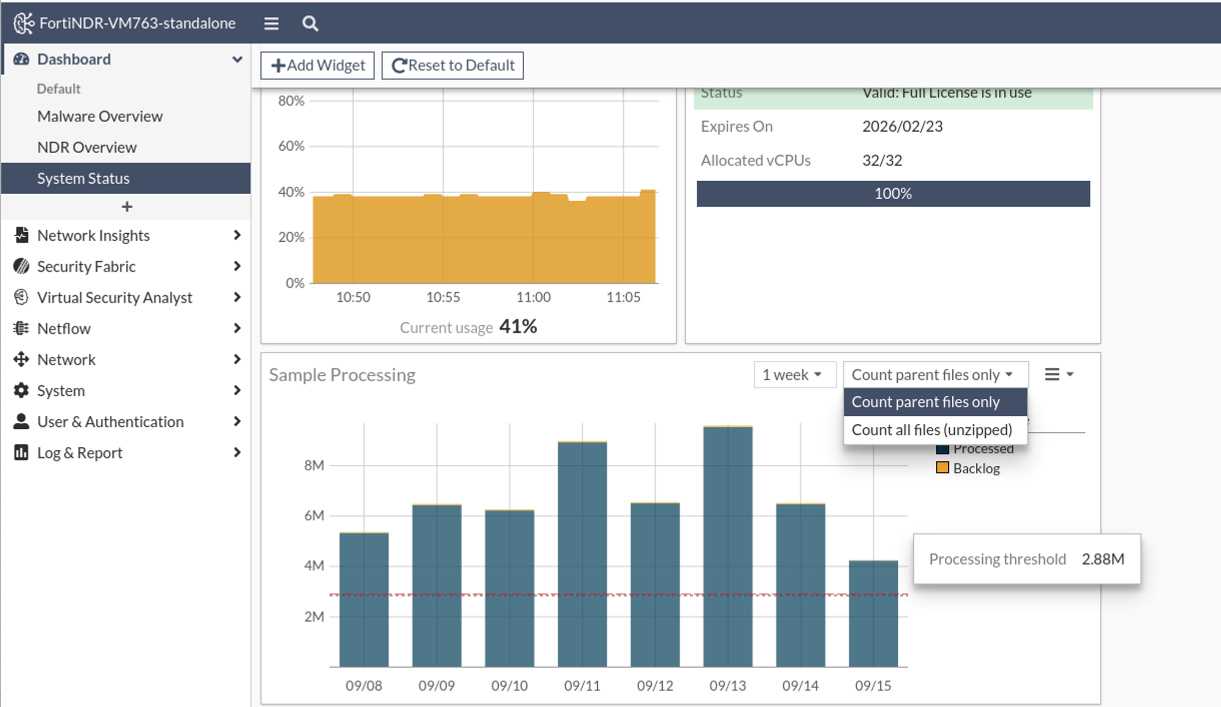
Sample processing widget
The Sample Processing widget has been enhanced with a new Processing threshold indicator. This red dotted line represents the maximum recommended processing rate for the specific appliance or VM model in use, based on the system’s expected capacity as defined in the product datasheet. The performance threshold indicator will only appear when the number of accepted files approaches the threshold. The line remains hidden when file volume is significantly lower.
For example, in a VM32 deployment, the system is rated to process approximately 120,000 files per hour. Multiplied over 24 hours, this equates to a daily capacity of 2.88 million files, which is reflected by the Processing threshold line on the graph.
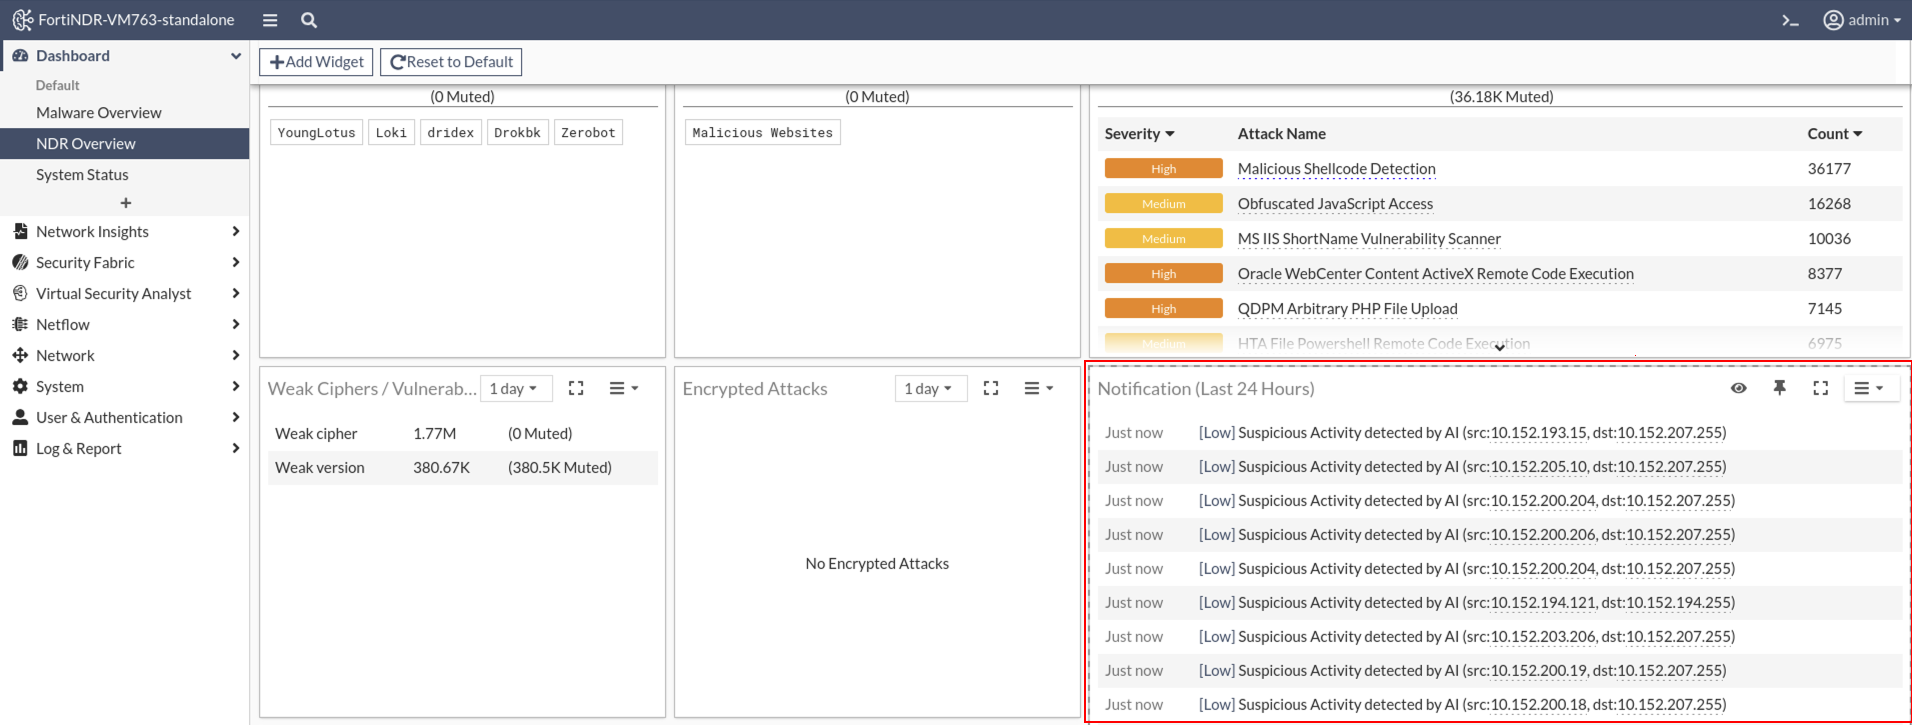
Notifications widget
Push notification functionality has been added to the Notifications widget.
IOC detection improvements
WebFilter and IOC queries can now be directed to FortiManager. WebFilter queries will use FortiManager’s web filter database, while IOC queries are proxied to FortiGuard servers.
Security Risk Groups are used during web filtering to help identify potentially malicious traffic. When HTTP or TLS traffic is processed, the system checks if the URL (HTTP) or CN/SNI (TLS) belongs to one of the following groups:
- Newly Observed Domain
- Newly Registered Domain
- Dynamic DNS
- Spam URLs
- Phishing
If a match is found, an Indicator of Compromise (IOC) lookup is performed. Depending on the result, the system may trigger an IOC detection with or without an IOC tag. If no match is found, no IOC detection occurs.
Global investigations
Global investigations are now supported in Central Management VM in addition to FNR-3600G. Before upgrading, please be aware of the following:
- After upgrade, queries used in 7.6.2 or earlier will not work with the new enhanced table. Users are recommended to run the existing queries and save results before upgrading to 7.6.3. All preconfigured queries have been updated to be compatible with the new enhanced tables.
- Queries in 7.6.3 do not support file-based operations (e.g.
virus_name, hashes etc). - Tags from 7.6.2 in previous NDR sessions and Malware file logs will be removed after upgrade.
Device enrichment
Version 7.6.3 introduces Active Directory (AD) integration for both Sensor and Center modes. This update also adds Import and Export Configuration options to the settings, making it easier to replicate, back up, or restore configurations.
Custom IP Signature
The new config ips custom CLI command
allows you to create or modify custom Intrusion Prevention System (IPS) signatures on a FortiGate device. You can use the command to define detection patterns, assign severity levels, add comments, and enable or disable the signature as needed.
CLI
For detailed information about CLI commands, please refer to the FortiNDR CLI Reference.
New CLI:
config system fortiguard ioc: Use this command to configure FortiNDR to query IOC (Indicator of Compromise) data from a custom FortiGuard server instead of the default.config system fortiguard webfilter: Configure how FortiNDR connects to the FortiGuard Web Filter service, which classifies URLs and domains during traffic analysis and threat detection.config system syslog cloud settings: Use this command to configure FortiAnalyzer Cloud as the syslog destination. FortiNDR will send logs with the specified type and severity (applicable only to NDR-type logs) to the configured destination.-
diagnose system db-fix-metadata: This command diagnoses and resolves database loading issues caused by incompatible metadata. diagnose system kafka-reset: Use this command to reset the NetFlow Kafka flow by dropping and recreating the related NetFlow Kafka tables.execute backup entire-db: Use this command to create a full backup of the entire ClickHouse database and store it at the specified location<filename-to-be-saved>. The backup includes all databases, tables, and metadata except for System tables, temporary information and cache tables.-
execute export logs: Use this command to export the FortiNDR debug logs into a single compressed archive file. It helps gather diagnostic logs in an organized manner, thereby facilitating issue analysis, troubleshooting, and system verification. execute factoryreset-shutdown: Use this command to reset FortiNDR to its factory default settings for the currently installed firmware version. The system will shut down after execution and all current configurations will be lost.execute restore entire-db: Use this command to perform a full restoration of the ClickHouse database from a previously saved backup file<saved-filename>. The restore operation retrieves the backup from the specified source and restores it to the local device.
Updated CLI:
diagnose debug application: Updated to includefilearchlogs for Standalone and Sensor modes.execute tac report: Addeddiagnose debug application filearch lines 10000(for Standalone and Sensor Modes) anddiagnose debug application ldaprich display lines 10000(for Standalone and Sensor Modes).-
execute db restore: Updated to remove all locally stored files, including detected samples and anomaly PCAP files.
Other improvements
- Improved risk level accuracy on the Device Profile page by resolving ambiguity caused by multiple IPs mapping to a single MAC address. Risk is now evaluated based on the selected timeframe and method (By IP or By MAC). This applies to new detections post-firmware upgrade; existing data remains unchanged.
- Streamlined device filtering by disabling the Latest Device Enrichment Filter in both the Device Log and Device Inventory.
- Resolved an issue preventing addition of the Bandwidth widget to dashboards.
- Fixed a query error that occurred during outbreak searches, improving reliability.
- Restored functionality of the Download button in the OT Device tab of Device Inventory.
- Fixed an issue that prevented users from changing to the Neutrino theme.
- Corrected the display when NDR Muting failed to delete a profile; it now accurately reflects deletion status.
- Improved the filtering in the Traffic Volume columns to ensure consistent behavior.
- Fixed a filtering issue for the Data Source column in the Connection tab on the Weak Cipher page.
- Enhanced login experience by ensuring users land on the NDR Overview Dashboard after logging in.
- Removed invalid cloud storage types from the Cloud Storage page for better clarity and usability.
- Fixed ML discovery detection time column filters to support accurate data sorting and analysis.
- Expanded configuration backup permissions. Now any user with Configuration read access can export GUI configuration, and users with read/write access can import it. This no longer limited to Superadmins.