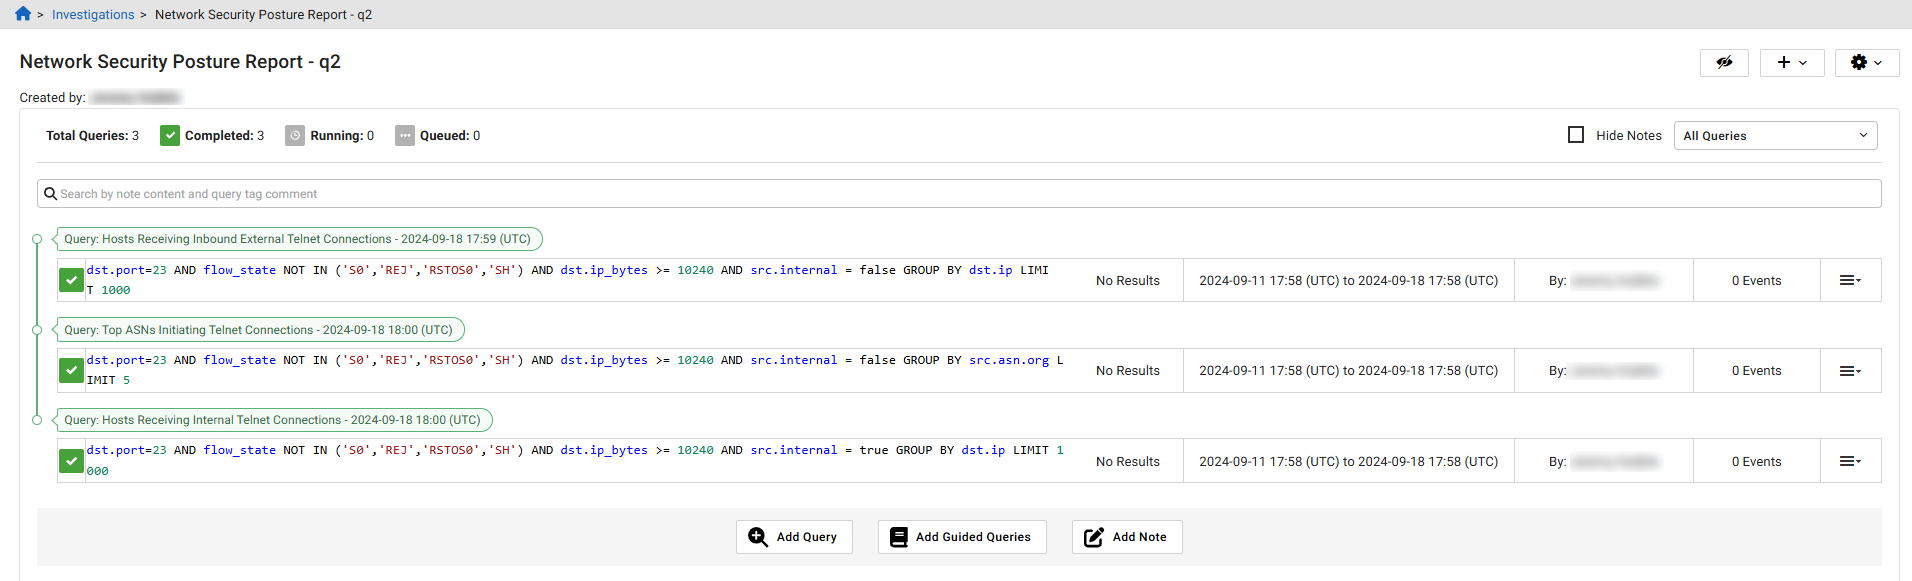
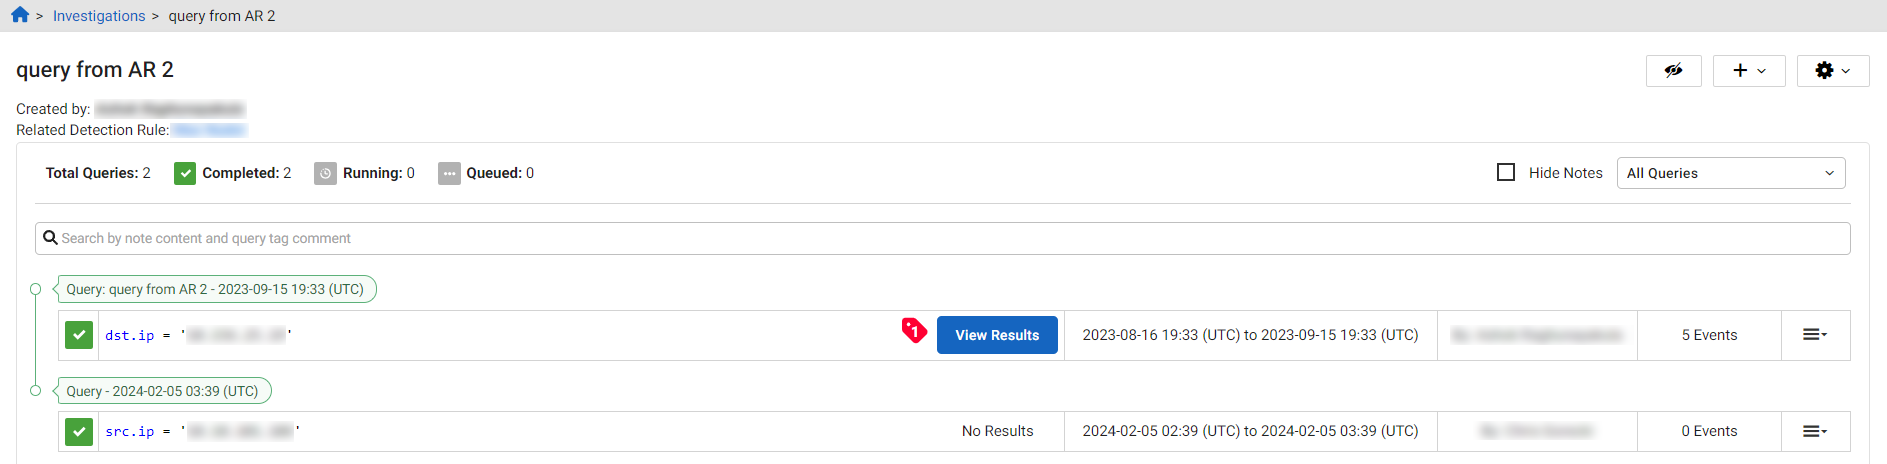
Viewing investigation details
To view the investigation details, go to Investigations, and click an investigation name. The investigations details page displays the following information:
- Investigation Creator
- Link to single or multiple related detections
- IQL query
- Notes (if any)
- Date/time the query was added
- Number of events (if complete)
- Executed Guided Queries that are part of that investigation
- Close date (if investigation was closed)
If the investigation contains more than one related detection, the MORE>> link appears. You can click the link to view all the related detections.
Query Status Icons
|
|
Query completed successfully. Results (if any) are available. |
|
|
Query is currently running. |
|
|
Query is queued to run. It will run automatically when resources are available. |
|
|
Query failed due to an internal error. If problem persists, please contact Fortinet support. |


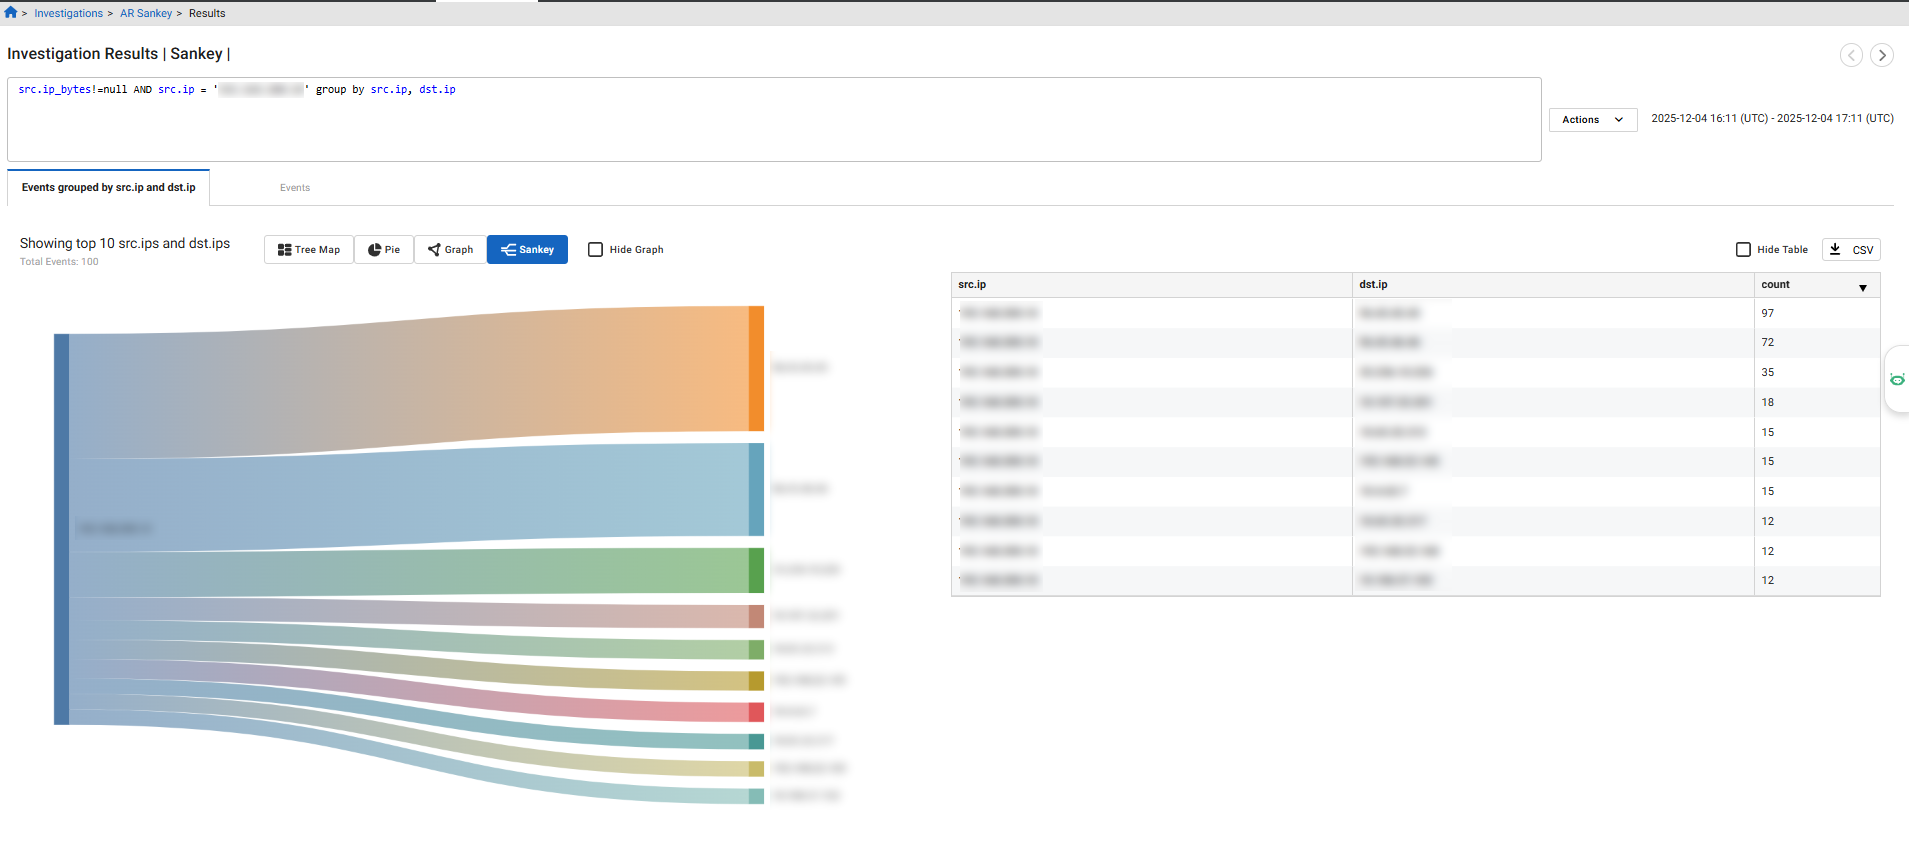
Viewing results
To view the investigation results, click the View Results button in the investigation details.
The following information is displayed:
-
IQL Query string
-
Date Range
-
Number of events
-
A table of the events where you can:
-
Click on column filter to change the visible columns in the way that the current event search does including column visibility sets.
-
Click the CSV button to export the results as a CSV file
-
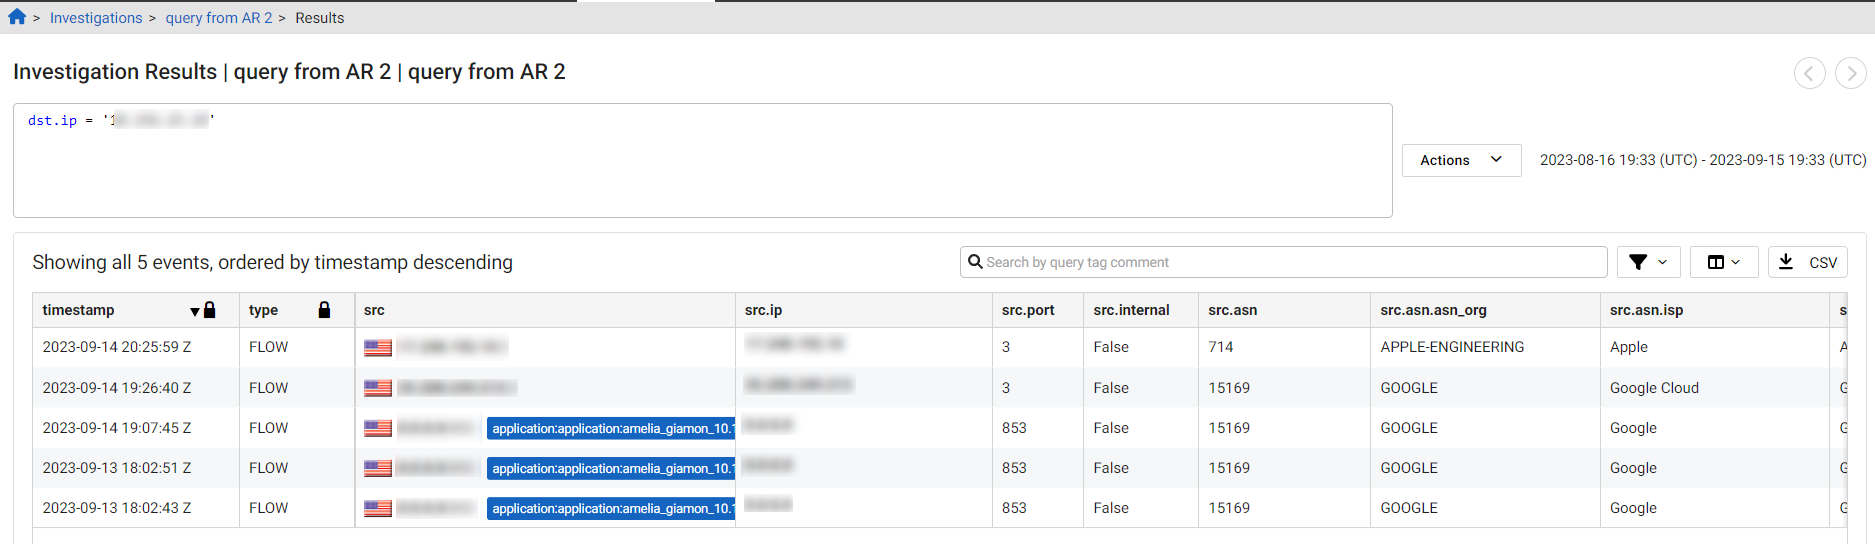
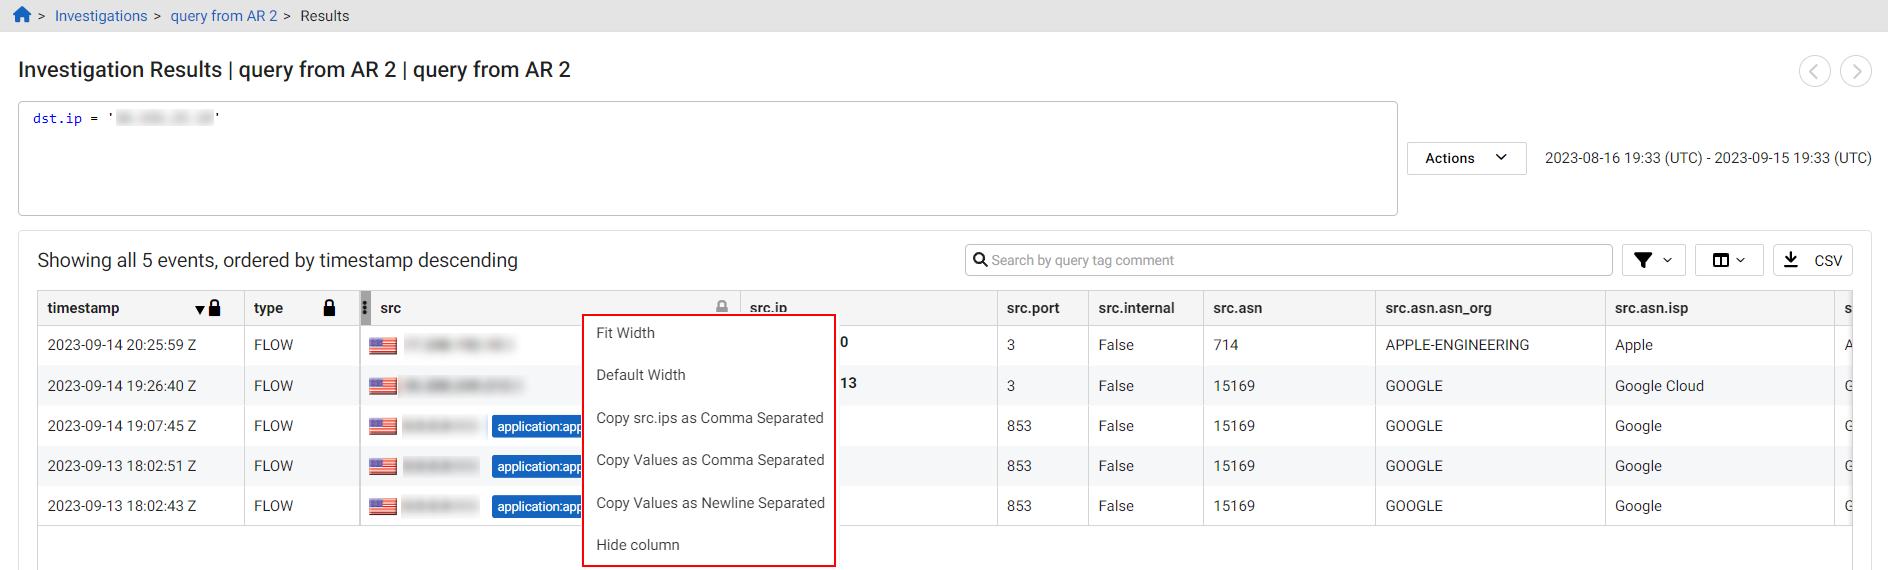
Viewing column data
To quickly scroll through the column headings, hold down the Shift key and use the scroll wheel on your mouse.
To adjust the columns to fit the widest cell in the table or to hide a column, right-click the column header.
Single event view
You can view all details for a single event by double-clicking a blank area within the event row. This opens a pop-up displaying the full row data in JSON format. To copy the JSON, click the copy icon next to the first line. This saves time by eliminating the need to scroll through individual cells in the investigation results table.
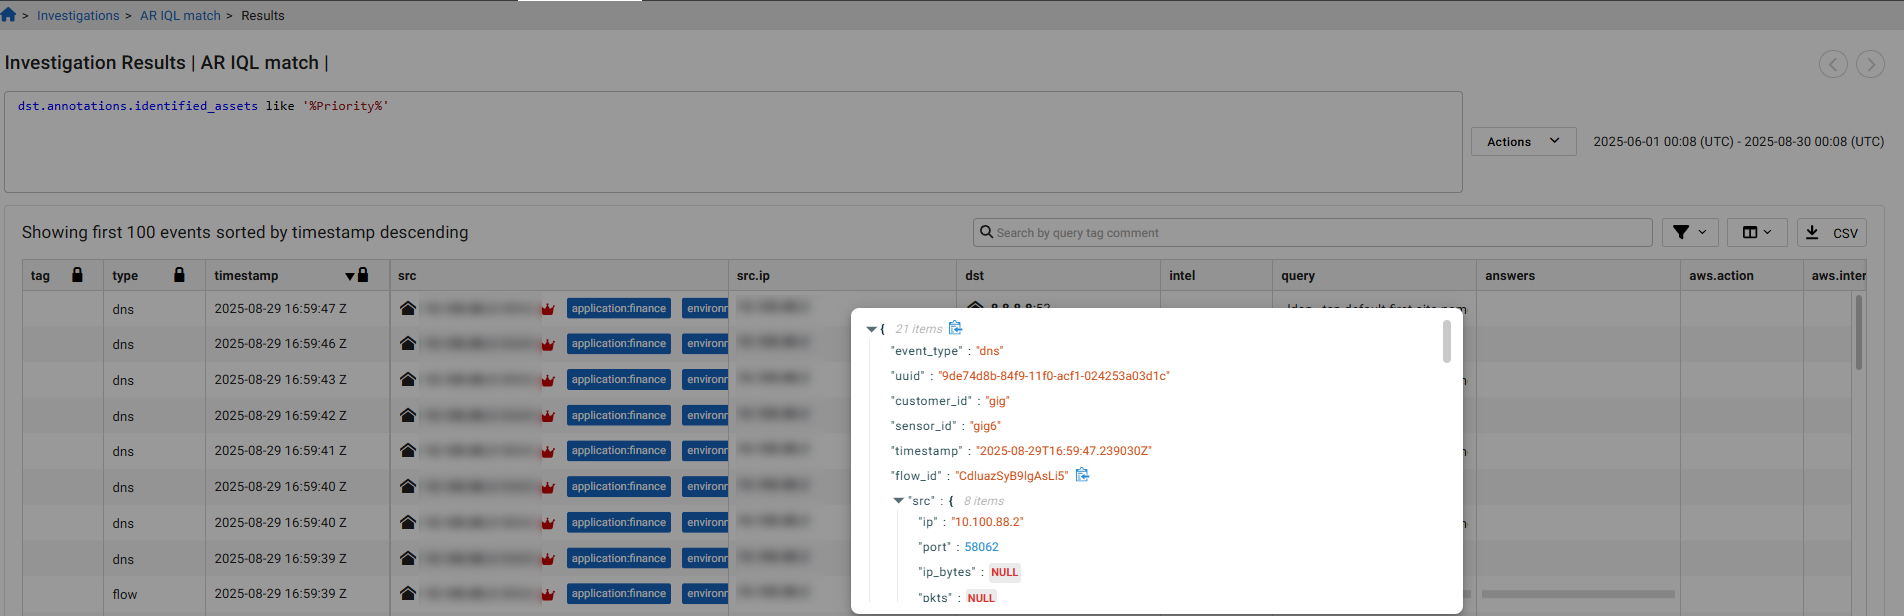
Chart types
Investigations results can be viewed as a Tree Map, Pie chart, or Graph. A Sankey chart is available for aggregations where the Group By includes two IP fields or when there are two dimensions and a measure. The Sankey chart type appears only when there are 50 or fewer dimensions.