
Version 26.1.a
New functionality
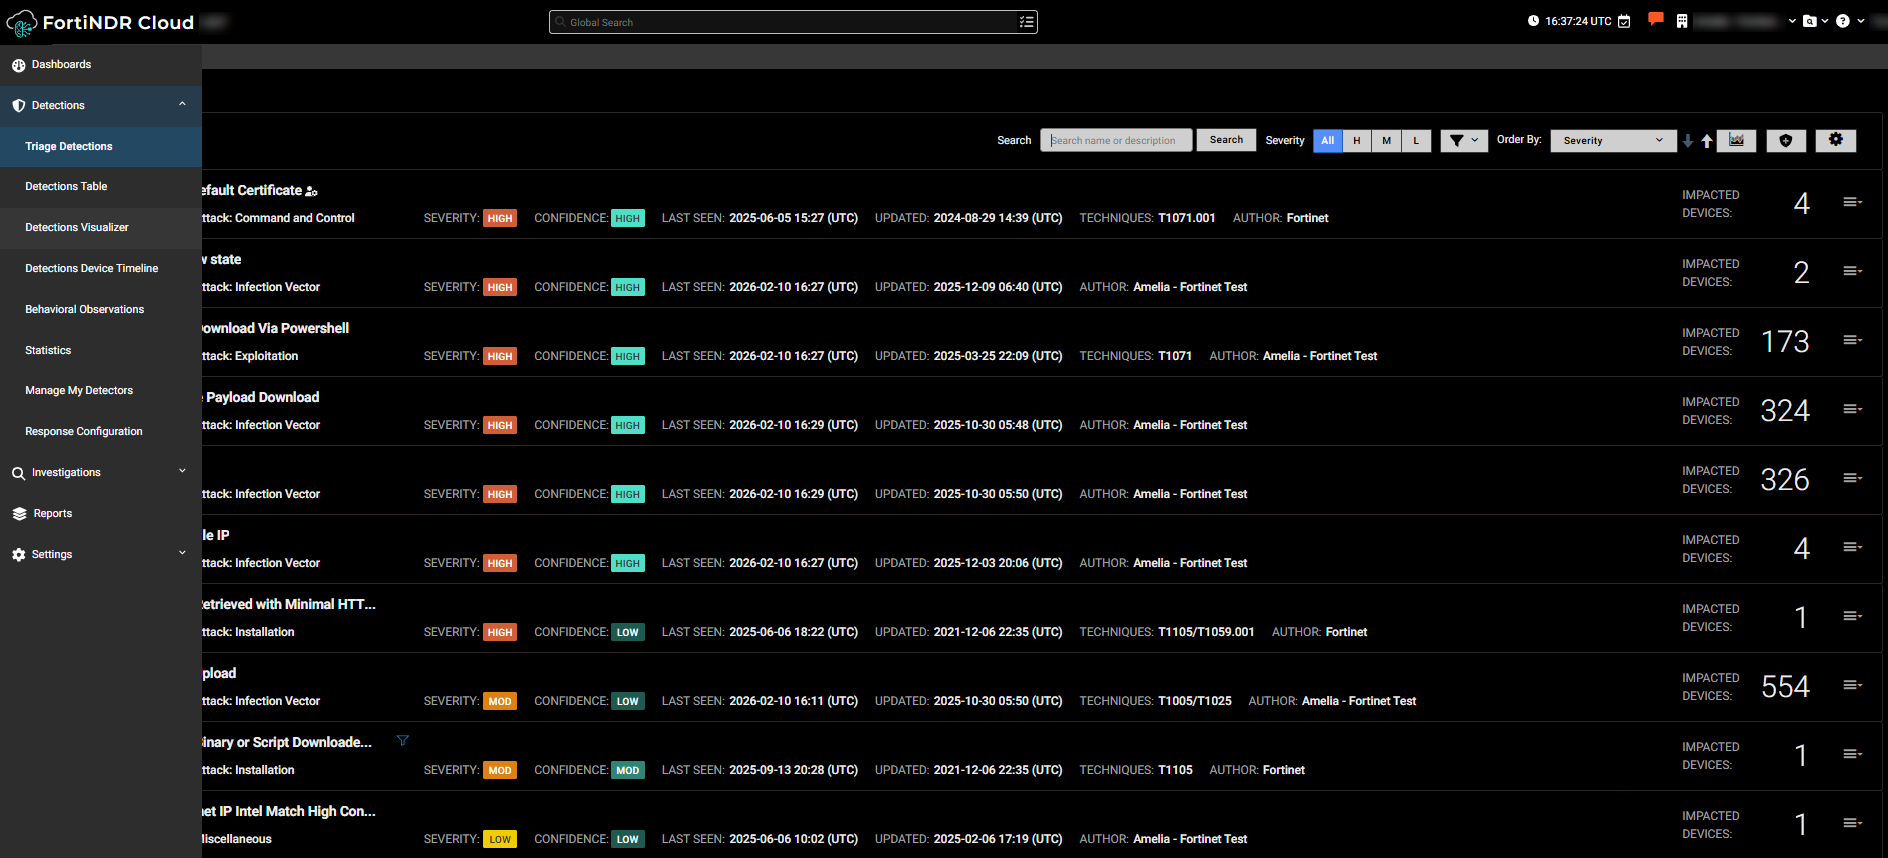
Advanced filtering for Investigation and Detection Event Tables
We have enhanced the overall filtering experience across investigation and detection tables by adding column-level filters, keyword search options, clearer visibility into active filters, and automatic row‑count updates.
This enhancement improves the analyst experience by enabling fast, interactive filtering directly within result tables across the portal. Previously, analysts had limited options for narrowing large result sets and often needed to run additional queries (for example, filtering again by source IP, server name, or event type such as flow events). This led to repeated follow‑up queries, slowed investigations, and made it more difficult to quickly focus on relevant data.
Column-level filters
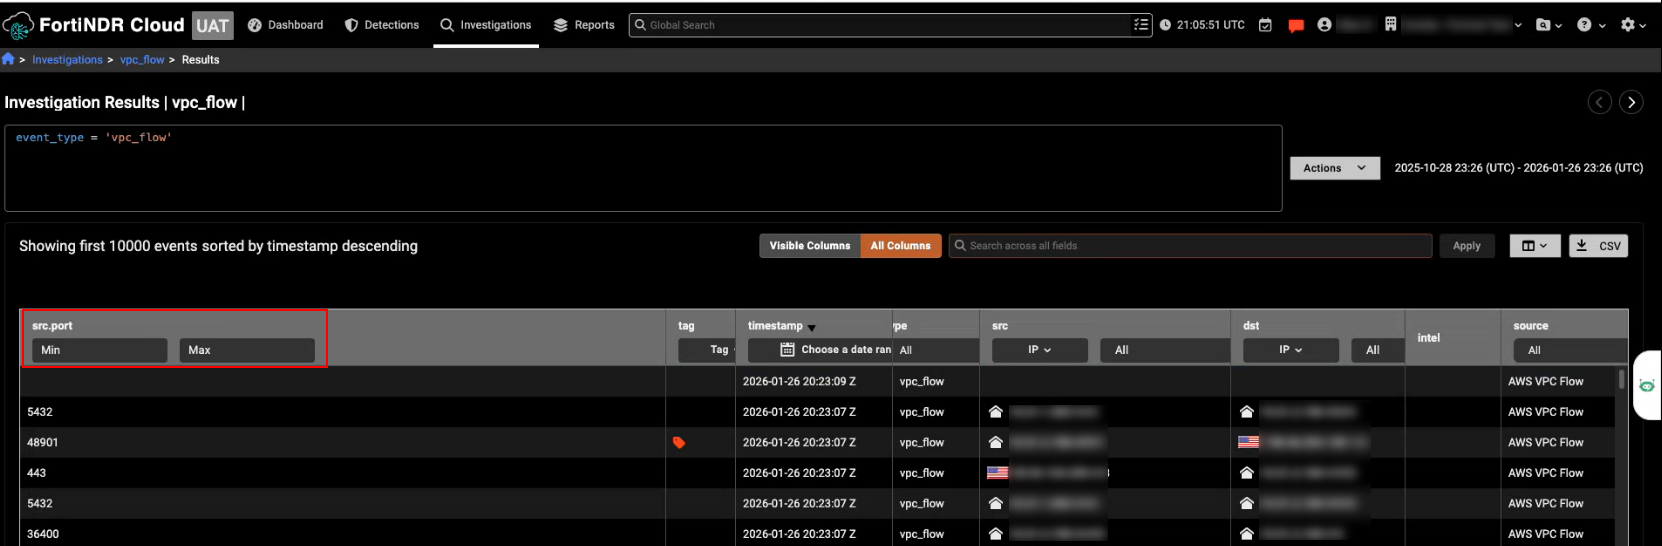
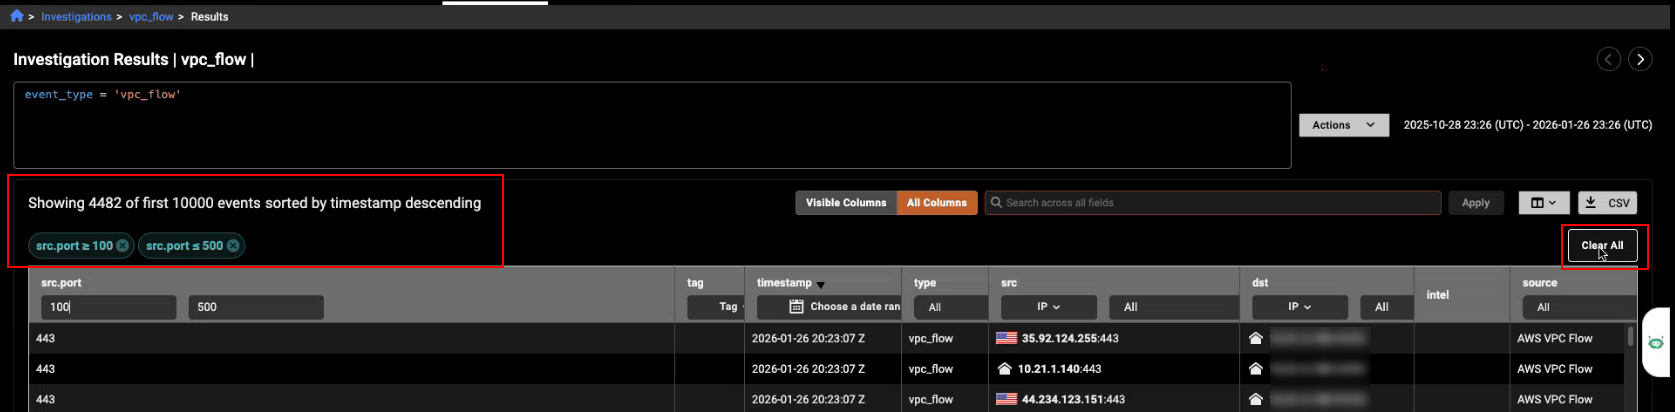
We have added column-level filtering to Investigation Events tables, providing more precise and flexible ways to explore and narrow down event data directly within the table. This update makes it easier to quickly isolate relevant events and combine multiple criteria without leaving the table.
This enhancement is available anywhere the investigation Events table is used, including support for granular filters by column type, with filtering enabled for approximately 90% of columns based on their data type.
You can apply multiple column filters at the same time to progressively narrow the results. As filters change, the table automatically updates its row count to show how many rows are currently displayed compared to the total number of available events.
Numeric columns support filtering by minimum and or maximum values, making it easy to narrow results for fields such as ports or other numeric attributes.
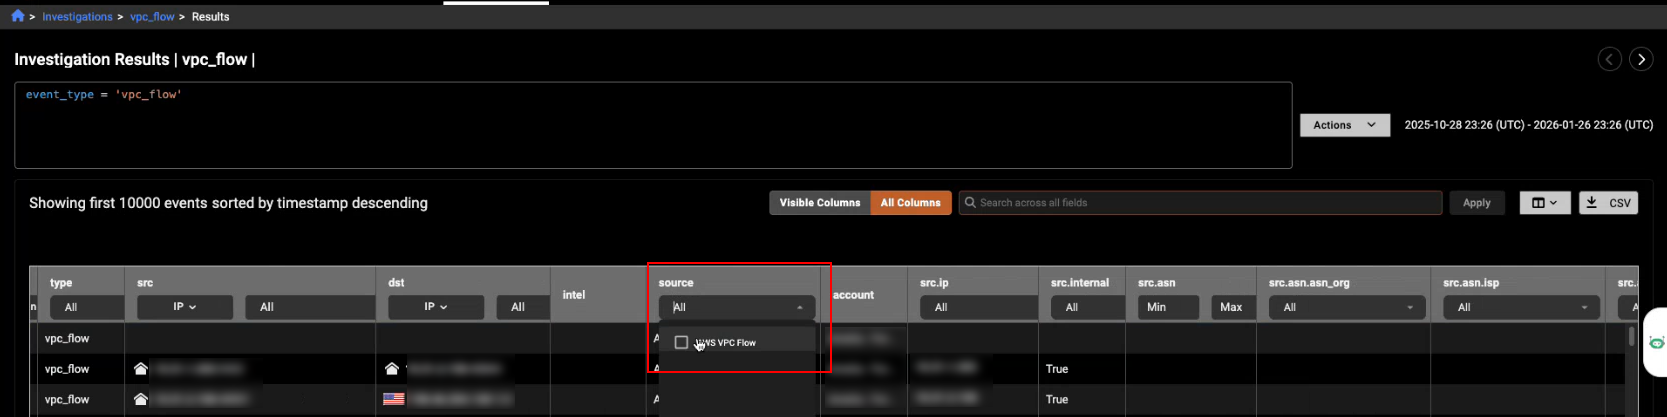
Text and string columns support filtering through a multi‑select dropdown that lists all available values in the column, allowing you to select one or more values to refine the results.
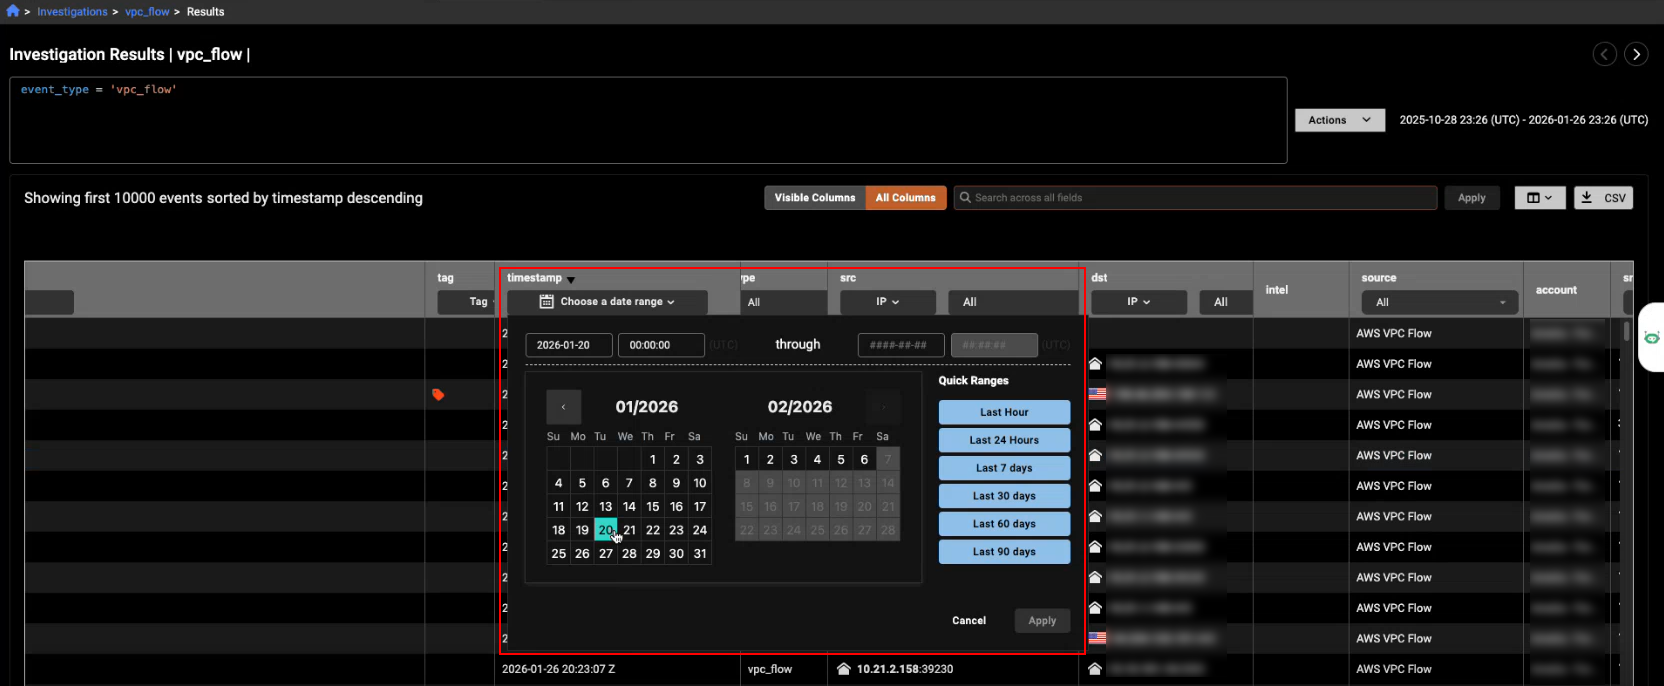
Date and time columns can be filtered using a date range picker, where you select a start and end time to display only events that fall within the specified range.
The Tag column filter provides two fields, allowing you to filter events either by tag type or by comment, with the filter automatically switching to the appropriate field based on your selection.
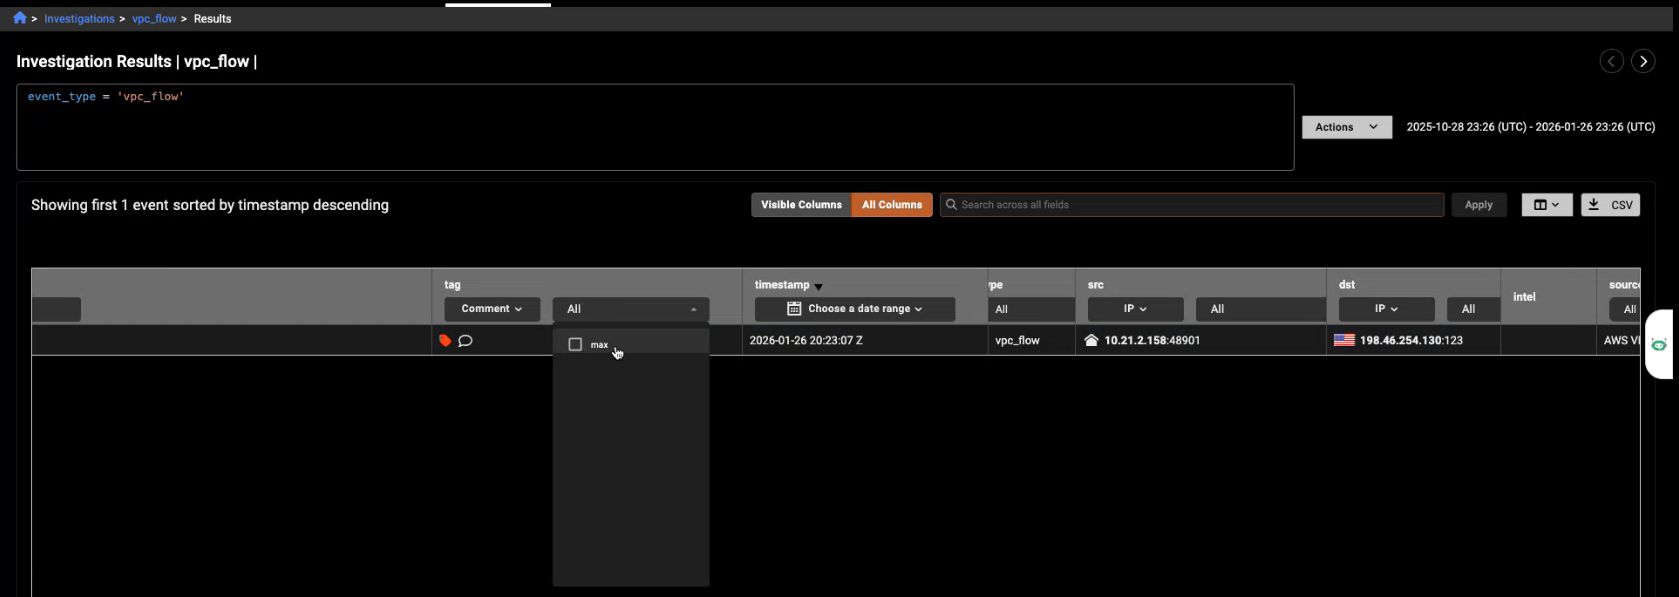
The table automatically updates its row count as filters change, showing how many rows are currently displayed compared to the total available events so you can see.
Active filters are displayed as filter pills above the table that indicate which columns are filtered and the selected values. You can remove individual filters by clicking their pill or clear all filters at once using Clear all.
Keyword search
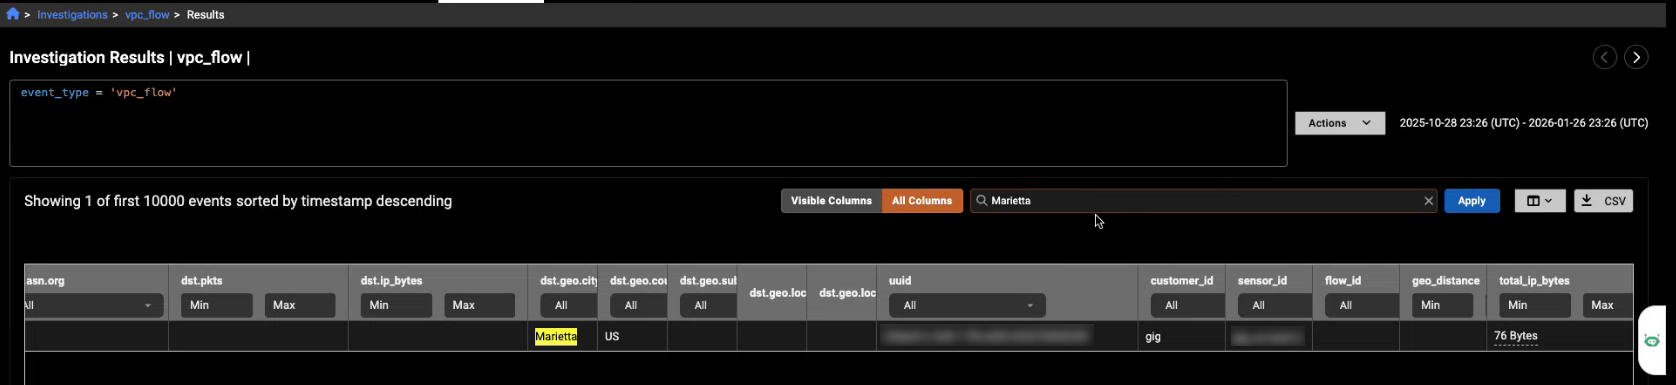
We have added a keyword filter to the following tables: Detection details (Events tab), Investigation query results, and Private search results. You can filter by All columns (including hidden columns) or Visible columns (only those currently displayed).
|
|
Filtering applies only to the results visible in the table:
|
You can use the Search field to filter the events. You are required to hit Enter or click Apply to start the search.
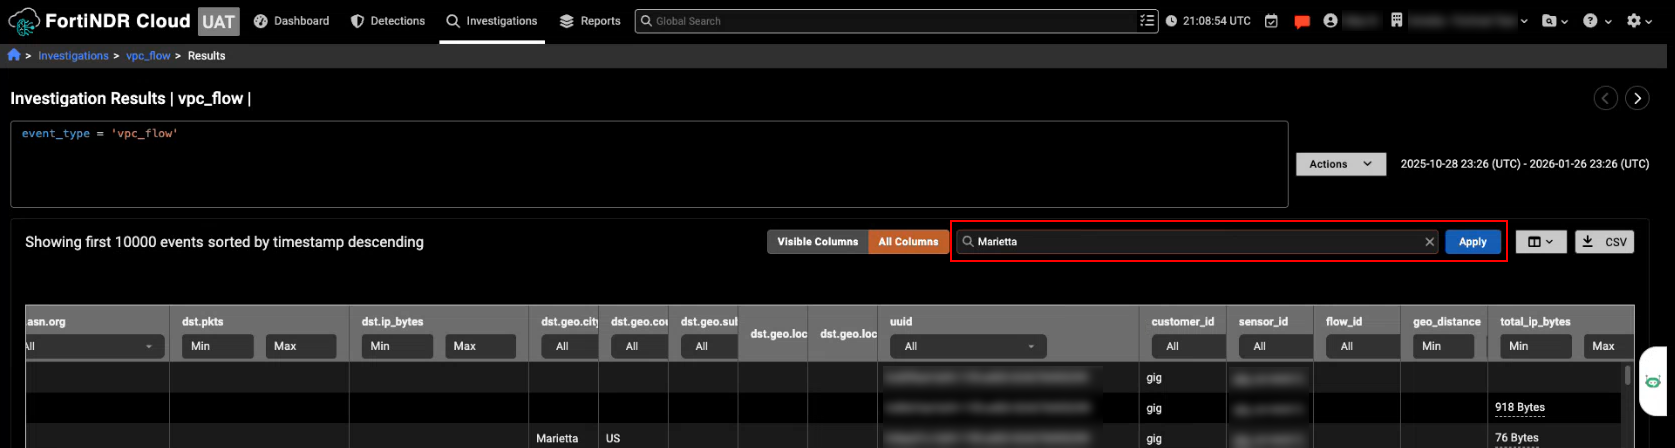
The results show only the rows that meet the search criteria. When All Columns is enabled, hidden columns are included in the results. The yellow highlight shows text that matches the underlying data for that column. Some values shown on the screen are formatted to be easier to read, so they may look different from the actual value used by the system. Searches always check against that underlying value, not the formatted display.
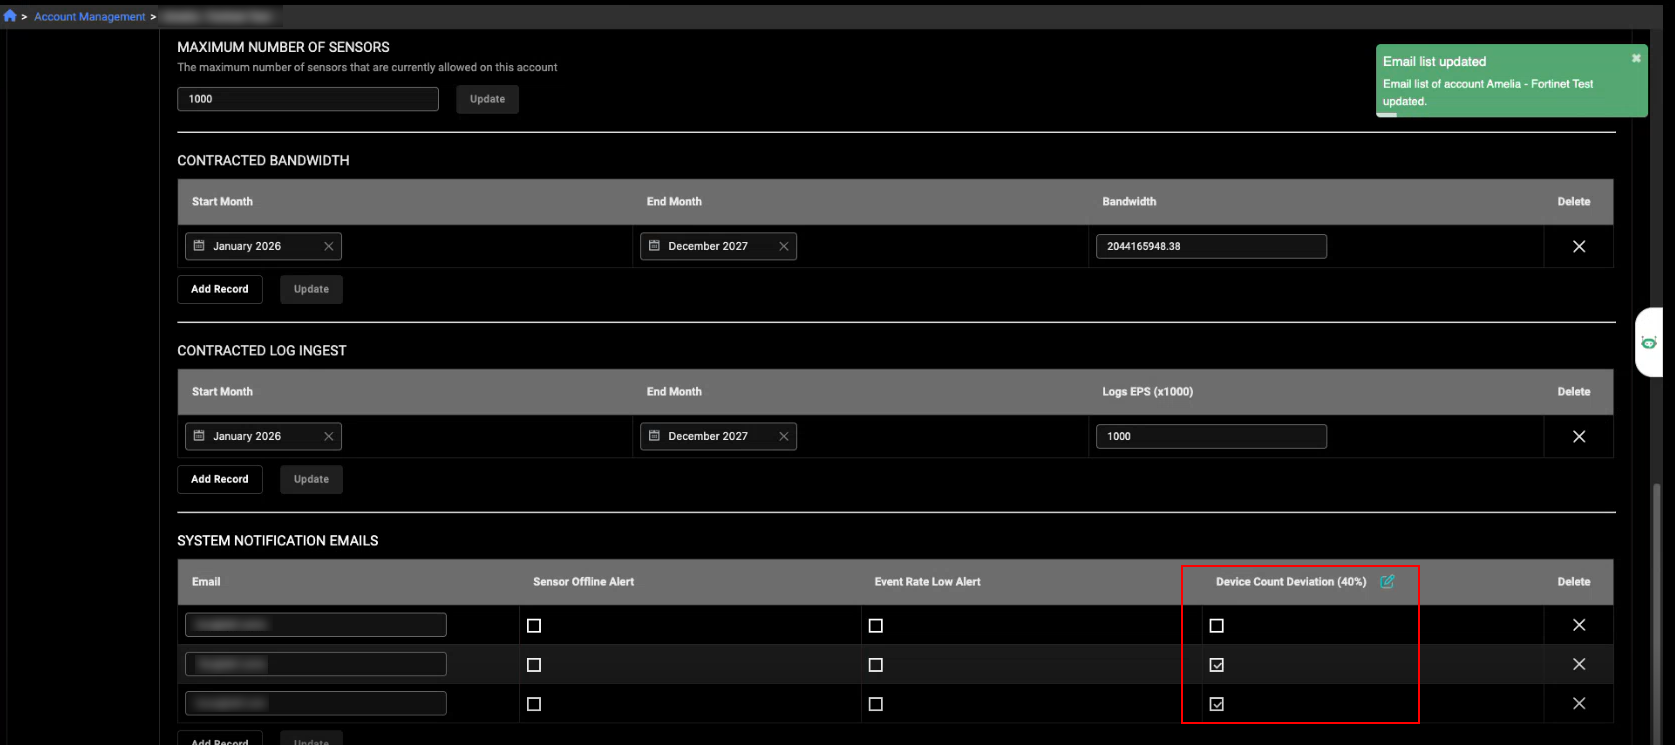
Device count deviation alert
The new Device Count Deviation alert notifies you when a sensor suddenly detects fewer internal devices than expected, providing a new layer of sensor health monitoring beyond event rate and offline alerts. This alert improves visibility into situations where a sensor appears “alive” but is detecting fewer devices than normal. A decrease in internal device visibility often indicates:
- A network connectivity issue
- A switch or tap misconfiguration
- A change in routing
- A partial failure where the sensor is still up but not seeing full traffic
The system continuously monitors visibility for each sensor. These counts are already displayed in the Device View page. Instead of a fixed system‑wide baseline, the deviation is now calculated using a floating 7‑day window. When the visible device count for a sensor falls below that threshold, the system automatically sends a Device Count Deviation alert to the configured recipients.
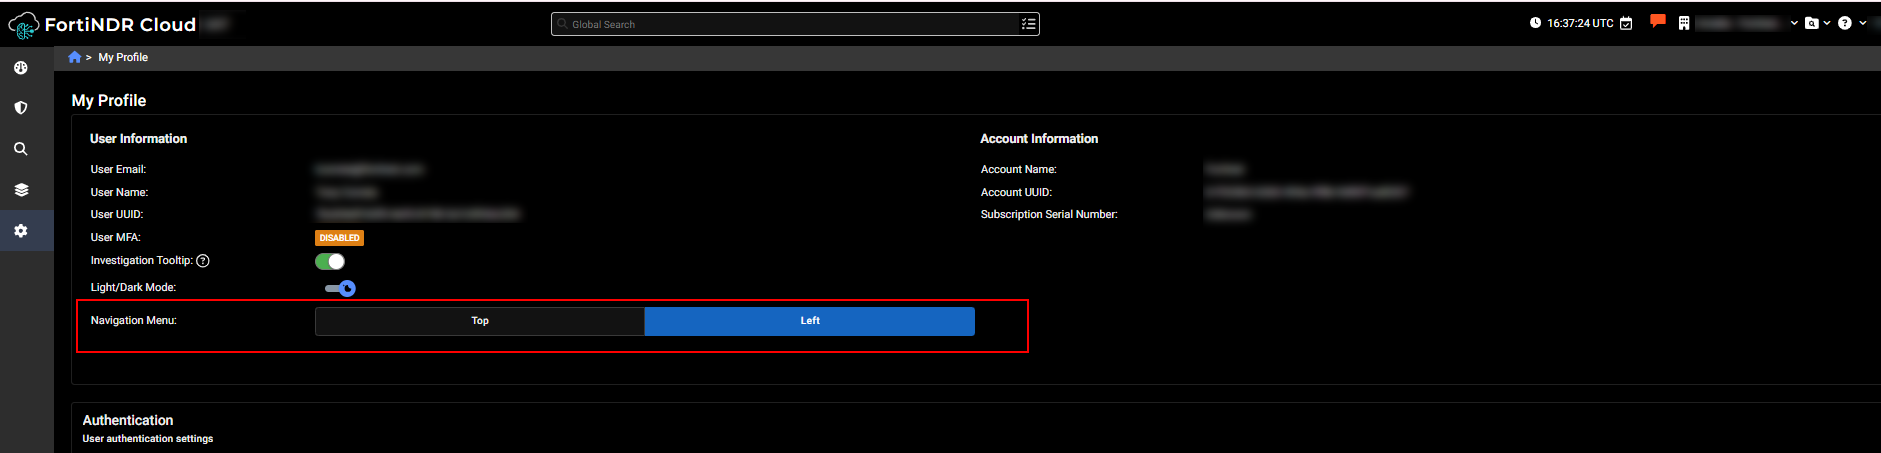
Left navigation
You now have the option to display the navigation menu on the left side of the portal. This is a user‑specific preference available in the My Profile page, allowing each user to set their preferred layout without affecting others. When enabled, the left navigation appears as a collapsible vertical menu. It automatically expands on hover, displays navigation options based on the user’s permissions, and highlights the current section and page.
To enable left navigation, click the Gear icon > Profile settings and select Left next to Navigation Menu.
|
|
The new left navigation menu is designed to improve access to an expanding set of menu options as FortiNDR Cloud continues to grow. Many Fortinet Fabric products already use a left‑side navigation layout, and this enhancement aligns the experience while providing analysts with a more streamlined way to navigate the portal. Although the left navigation is optional in this release, it is planned to become the default navigation layout in a future release. |
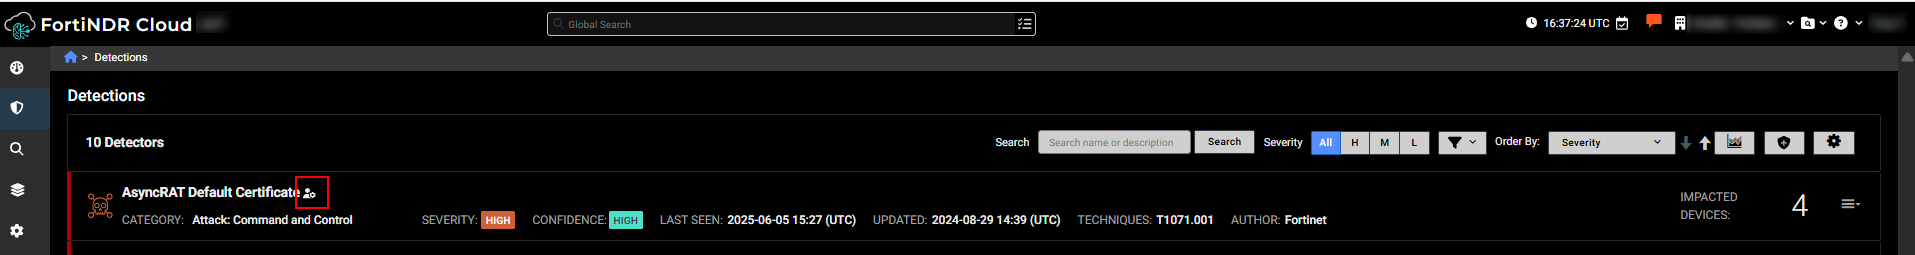
Customizable Detection Resolution Methods
You can now override the default resolution method and resolution time for detectors created by other accounts. Previously, accounts that did not create the detector were required to use the resolution settings defined by the detector’s creator.
With this enhancement, detectors now include an edit icon that allows you to:
- Change the resolution method (auto or manual)
- Adjust the resolution time
- Restore the original creator-defined settings if needed
This option is only available for detectors your account did not create. If your account is the detector creator, the override option is hidden.
To override the resolution method, go to Detections > Triage detections and open a detector created by another account. Click the pencil icon to change the resolution method.
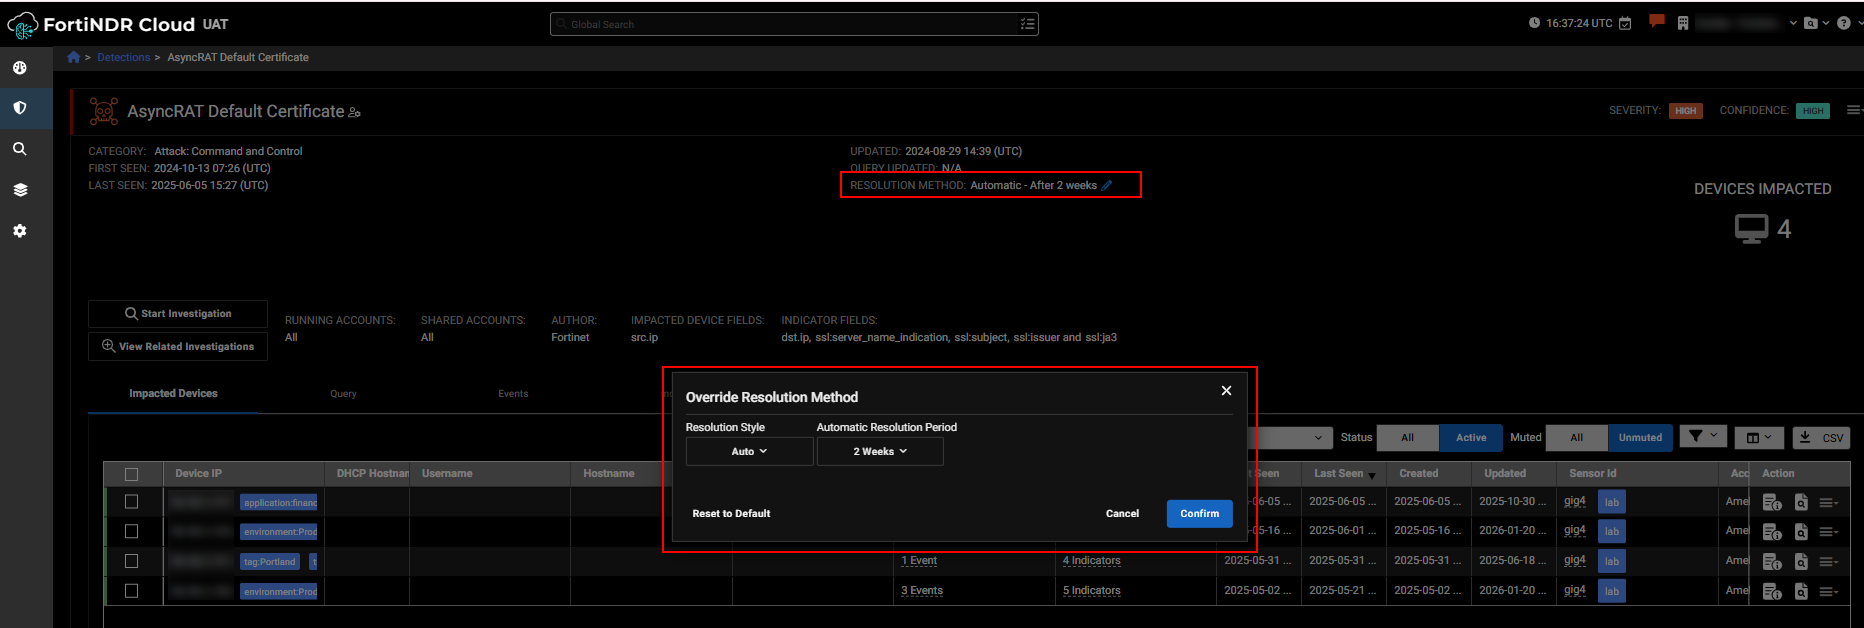
When a detector has a customized resolution method, an override indicator appears both in the detector header and in the list view, similar to the existing custom filter icon.
VPC Flow fields
A VPC Flow fields event occurs when raw VPC Flow Log data is parsed and its individual fields are extracted and normalized into a structured event. These events are only visible when the VPC feature is enabled. To enable it, contact your TSM or Customer Support.
Improved functionality
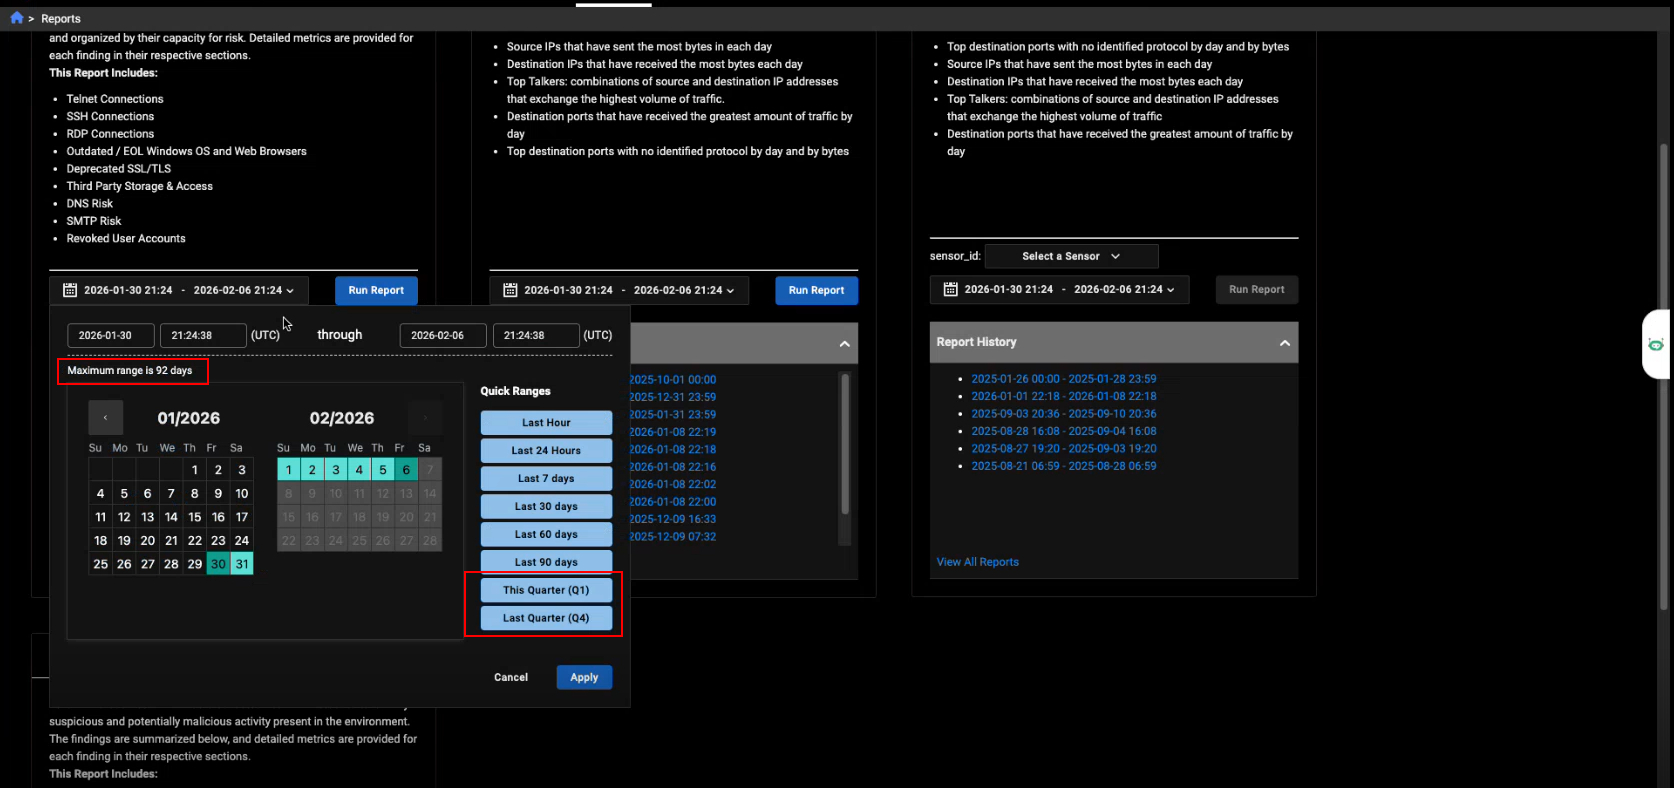
Report filtering
The time-range filter in Reports now supports date ranges up to 92 days instead of the previous 90, allowing you to select full calendar quarters (including quarters with 31‑day months). It also introduces quick‑select buttons for This Quarter and Last Quarter, which automatically adjust based on the current quarter.
Natural Language Query Enhancements
This release introduces several improvements to Natural Language Queries, expanding event coverage and improving query results.
- Broader event type support: Natural Language Query now supports all event types, aligned with those listed on the Event Fields page. Some exceptions apply, such as annotations and device enrichment fields, which are not currently supported.
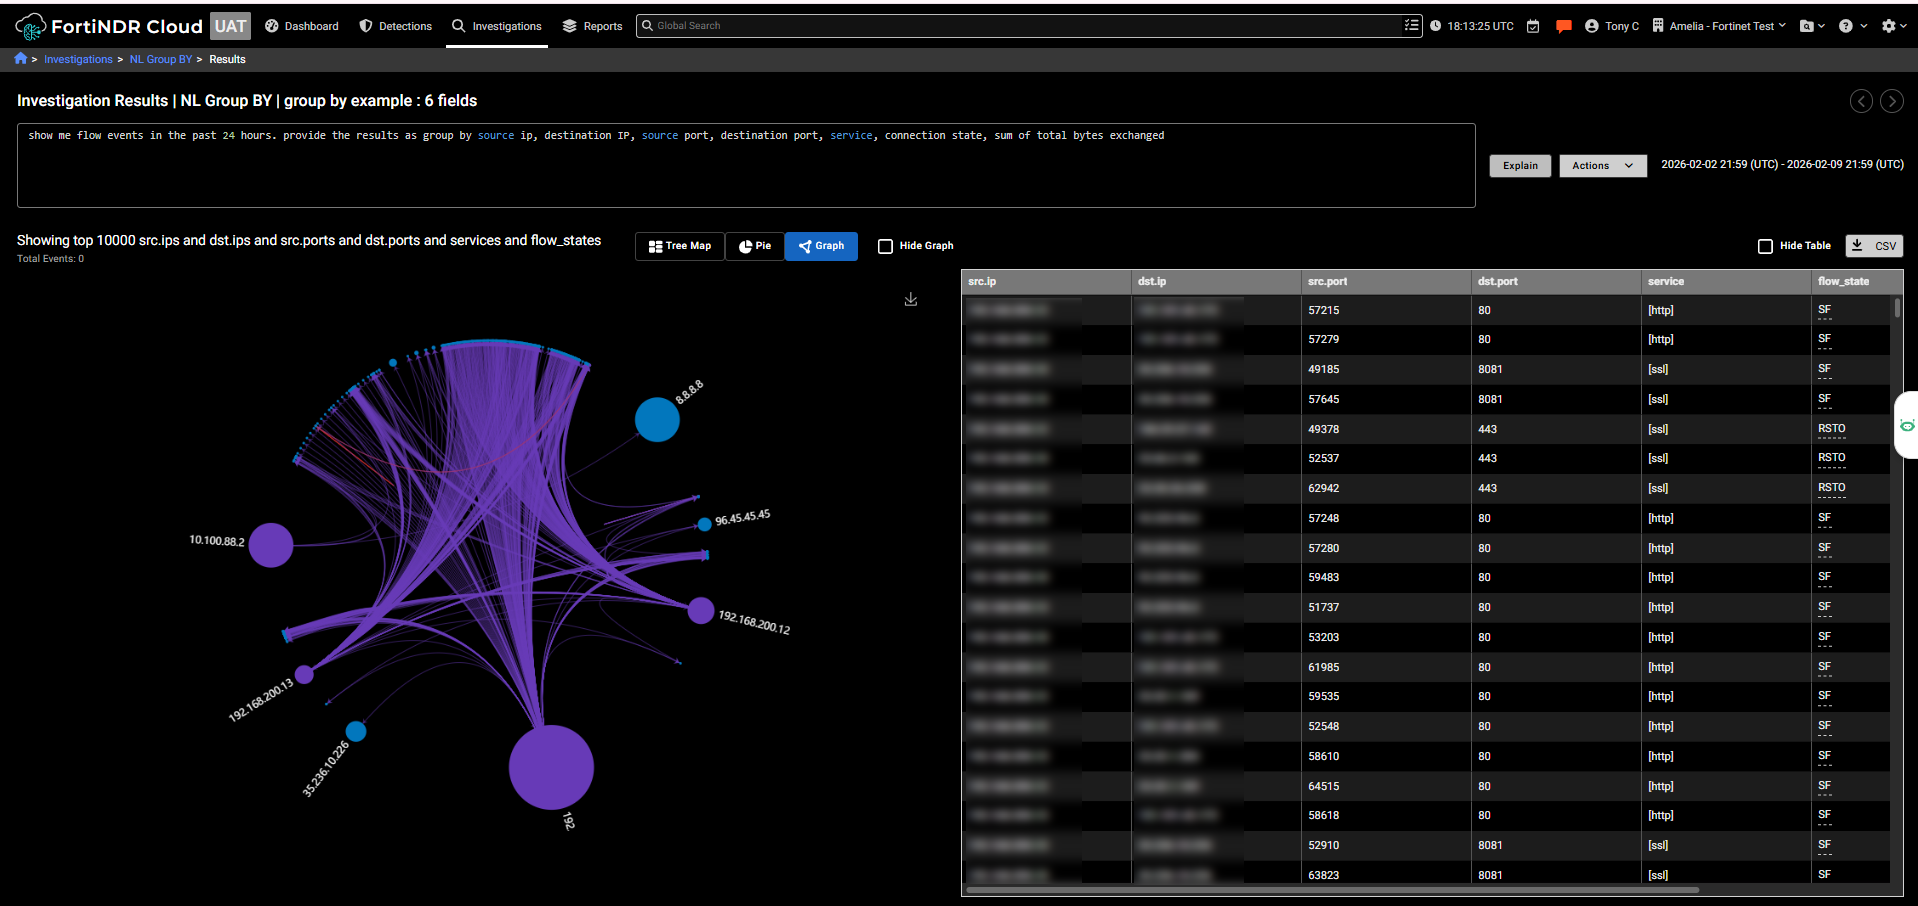
- Group By enhancements: Users can now request grouped query results directly through natural language. The Group By operation supports up to 10 columns, allowing for more detailed summary and analysis.
- UI improvements: We have improved the clarity of query results, including improved display of aggregated counts and fixes to toast notifications.
- Query-specified time period precedence: When a time period is explicitly mentioned in the natural language query, that time period now takes precedence over the time selection in the GUI, ensuring results match the user’s intended timeframe.
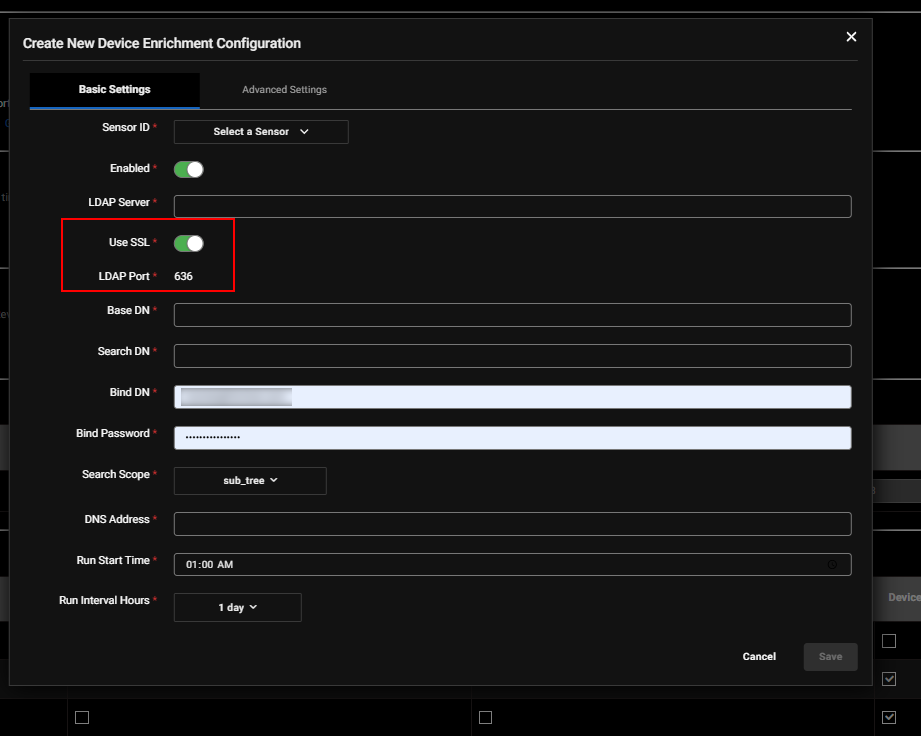
Device enrichment configuration
The LDAP port field in the Device Enrichment configuration has been updated to ensure consistent and secure configuration. Previously, the LDAP port was a free‑form field, allowing users to enter any value. With this enhancement, the LDAP port is now automatically determined based on the SSL setting:
- When SSL is enabled, the configuration automatically applies the secure LDAP port.
- When SSL is disabled, the configuration switches to the standard LDAP port.
- Manual entry of custom port values is no longer allowed.
This change prevents invalid or unsupported port selections.
Netflow event fields
Improved NetFlow logs with additional fields and included a fix for the direction issue.
FortiAI updates and improvements:
- Enhanced response accuracy for detection‑related queries.
- Improved precision and clarity when providing coverage information.
Other improvements
- On the Sensors page, you can now right-click on a sensor and open it in a new tab.
-
Any IPs excluded from Detections are also excluded from Observations. This ensures that scanner or mirrored traffic, which is common in environments without packet brokers, no longer triggers unnecessary observations.
-
The Detections Table now supports searching by last seen date.
-
A new training scenario is now available in the portal: DCSync and Enumeration.