


What's New
FortiMonitor 2023.4 includes the following enhancements:
December 14, 2023
-
OnSight 100F: OnSight 100F now supports SD-WAN synthetics.
-
Dashboards: Added support for additional HTML styles for the HTML widget.
-
Metrics: Improved the incident description for aggregate metrics such that the metric name and a comprehensive description are now displayed when an incident occurs.
-
Reports: Added the Incident Acknowledgment filter to the MTTR & MTTA Report configuration.
December 7, 2023
-
Dashboards: Public dashboards can now be scoped using parameters if the dashboard is configured for it.
-
Path monitoring: Network provided color-coding is now enabled by default. To disable color-coding, select More > Node with a n/w provider.

-
OnSight vCollector: The geolocation setting of an OnSight can now be set from the OnSight's details page.

-
Incident Hub: Performance improvements to Incident Details pages.
-
DEM: The MacOS DEM Agent is now available.

November 30, 2023
-
The Topology feature is now available. Topology helps network and IT administrators to find the interconnections and relationships between devices in an IT infrastructure.
-
The Path Monitoring feature is now available. Path Monitoring allows you to look into the reachability of target instances from one or more sources.
-
Alerting: Port and metric tags are now included in alert emails.
-
Dashboards: UI improvements to the widget catalog.
-
OnSight: Improved the onsight-mgr logic for finding the current container version.
-
Fabric integration: Added support for default frequency for different Fabric metrics.
-
Dashboards: You can now set the default dashboard from the main Dashboards page.

-
Dashboards: The Instance Summary table and Metric Summary table now allow for FQDN to be added as a column.
November 17, 2023
-
OnSight 100F: Added support for proxy configuration.
-
Dashboards: Added the FQDN column, which shows the server FQDN as a hyperlink, to the Network Interfaces widget.
-
Dashboards: Detailed instance information now slides out instead of opening a new page when a block from the Heat Map widget is clicked.
-
Dashboards: Added an option for metric-focused widgets to only show values for metrics which have crossed a threshold and have an active incident. This change is applied to the following widgets:
-
Line chart
-
Advanced line chart
-
Bar chart
-
Metric summary table
-
-
Control Panel: The legend labels on bar charts are now clickable.
-
Reports: Updated the Instance Configuration report to support filtering of SNMP devices that have never synched or failed a discovery scan.
-
Reports: MTTR/ MTTA report improvements:
-
Added the Ack Time and Ack Duration columns.
-
Added Severity filter during report configuration.
-
-
Reports: Added Panopta and FortiMonitor designators to the Agent Status report.
November 9, 2023
-
OnSight 100F: Updated the hardware OnSight upgrade logic in the Control Panel to show the correct upgrade version.
November 2, 2023
-
Infrastructure Map UI improvements.
October 26, 2023
-
No new features in this release.
October 19, 2023
-
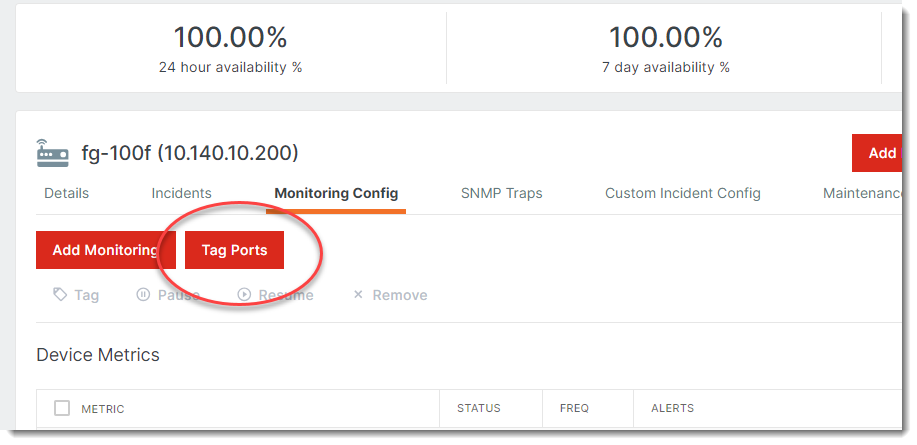
Fabric integration: Added support for port tagging on Fabric network devices.
-
Fabric integration: The VDOM name is now included in FortiGate SNMP IPSec metric provisioning.
-
OnSight vCollector: Expanded OnSight support for manifest files.
-
Define and apply auto-discovery rules and frequency
-
Configure heartbeat rules
-
Enable CounterMeasures
-
Support for the Templates, Tags, and partner_server_ID parameters
-
October 12, 2023
-
No new features in this release.
October 5, 2023
-
OnSight vCollector: The OnSight can now be upgraded from the Control Panel. To perform an upgrade, go to the OnSight's page then locate the Upgrade OnSight option.

-
Metrics: Changed the description of the FortiAP Status metric from numeric value to match the text value selected when configuring the threshold.
-
CounterMeasures: Updated the OnSight-based CounterMeasures metadata to include additional FQDNs/ IPs.
September 21, 2023
-
Control Panel: Increased the clickable area of main navigation menu items.

-
Templates: The option to select raw values or percentage thresholds when creating network device templates from scratch is now supported.

-
Security Fabric: Fabric templates can now be created from imported Fabric devices.
September 14, 2023
-
Metrics: Added the Percent option for the fmSysMemUsage and fmSysDiskUsage metric thresholds.
-
Kubernetes: Kubernetes containers and pods can now be filtered by name using attributes during onboarding.
September 7, 2023
-
Templates: Fabric templates now support SD-WAN health metrics.
-
Metrics: When updating the value of a port speed, the port speed value that was previously set is now displayed.

-
API: API support for recently added Fabric and VMware metrics.
-
OnSight: Added a logic to prevent moving checks on OnSights within an HA Group to prevent duplicates from being created.
August 31, 2023
-
Synthetic checks: UI improvements to the Browser Synthetic (Multistep) drawer.
-
Multi-tenancy: The Account Usage page in the main account of a multi-tenant setup now explicitly states that the date included aggregated sub-tenant usage.
-
Control panel: Renamed the Scheduled navigation menu item to Schedules & History.

August 24, 2023
-
API: The API can now be used to enable sub-tenant accounts to use the notification schedules of a master tenant account.
-
API: The Delete command can now be used on the /contact_group API endpoint.
-
Metrics: Added support for additional FortiManager and FortiAnalyzer metrics.
-
UI improvements to instance flyouts and tooltips.
August 17, 2023
-
OnSight: Improved performance for metric polling via FortiManager proxies.
-
VMware integration:VMware versions numbers are now captured and displayed.
August 10, 2023
-
No new features in this release.
August 3, 2023
-
Multi-tenancy: Added support for requiring SSO for all subtenants in a FortiMonitor brand.
July 27, 2023
-
Metrics: The SSL certificate expiry check now supports selecting the TCP port against which a check is made.
July 20, 2023
-
Reports: Expanded the Date Range option on SD-WAN reports.

-
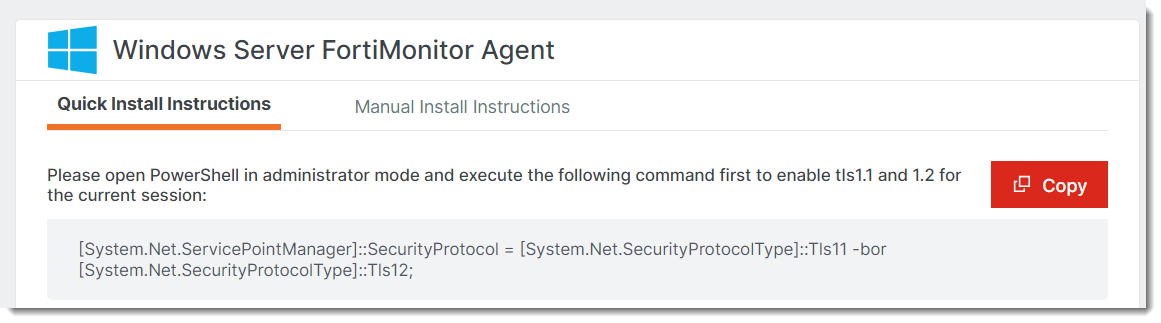
FortiMonitor Agent: Updated the Windows quick install instructions in the control panel to instruct users to enable support for TLS 1.2 prior to running the installation command.
-
Security Fabric: Added support for Multi-VDOM in Fabric integrations (FortiOS 7.4 and later).
-
Security Fabric: Added support for synching the names of Fabric instances which are being discovered and renamed.
July 13, 2023
-
Control Panel: UI improvements to the left navigation drawer.
June 22, 2023
-
Fabric integration: Improved the detection and display of offline Fabric devices.
June 15, 2023
-
SNMP: Added support for device detection for Kyocera printers when monitored via SNMP.
-
Integrations: Updated the OpsGenie integration to properly work with the latest OpsGenie APIs.
-
OnSight vCollector: Updated the OnSight installer to add support for RedHat Enterprise Linux 8.6-8.8.
-
Cloud integrations: Added a warning banner on cloud instances to show when the related cloud integration used to poll their metrics is invalid or unable to connect.

-
API: Updated the API endpoint for creating customers to make the partner_key parameter required.
-
Maintenance periods: Removed the option to pause monitoring entirely during maintenance periods due to performance impact on maintenance activation and resolution.
June 1, 2023
-
Instance Details page: The SSL Tunnels tab which shows the SSL tunnels and session data is now available for SNMP FortiGate instances.

-
Dashboards: Removed the error icon from individual counter widgets (Infrastructure Counter, Active Incident Counter, etc.). These have been replaced with a single banner. Refreshing the page updates the widgets and removes the banner.

May 25, 2023
-
No new features in this release.
May 18, 2023
-
Alerting: Reworked user interface for configuring heartbeats (agent, SNMP, Fabric, etc.) to make it clearer what will happen when the heartbeat incident is created. For more information, see Assign Alert Timelines.

-
Maintenance periods: Improved the validation logic to give a cleaner error when trying to delete a maintenance period that is currently active.
-
VMware integration: Improved the logic to prevent VMware integrations from falling into a deleted status when editing with an invalid credential.
-
Application monitoring: Updated the application logos.
May 11, 2023
-
Metrics: Added support for SSL certificate expiration monitoring. For more information, see SSL expiration check.
-
Security Fabric: Improvements to Fabric heartbeat monitoring.
-
FortiMonitor Agent: Updated the Windows FortiManager Agent installation script so that when a Panopta Agent is detected, the script will abort the installation process. This prevents two separate versions of the Windows Agent from being installed. For more information, see Migrating a Panopta Agent configuration to FortiMonitor Agent.
-
Network devices: You can now add attributes to network devices during the onboarding process.

May 4, 2023
-
Templates: Improved the performance of bulk template applications.
-
SNMP: Re-applying a template now updates the label of existing metrics based on the label OID.
-
Security Fabric: Fabric discovery frequency can now be customized or disabled.

-
VMware integration: Updated the VMware re-discovery logic to allow the creation of instances. Deleted instances can now also be restored.

April 27, 2023
-
Network devices: Added support for SNMP device type identification to allow categorization of instances by their type (firewall, switch, etc.).
-
Security Fabric: Added support for monitoring FortiGate high availability (HA) clusters.
-
Detection and alerting support for cluster member incidents.
-
Support for Fabric setups where the FortiGates are configured in an HA cluster with FortiGate Clustering Protocol (FGCP) and share a single IP address.
-
The FortiGate Instance Details page now displays the serial numbers of all of its members.
-
Cluster metric information is now available in the Performance tab.

-
April 20, 2023
-
Security Fabric: Improved the handling of certain error states with the FortiManager integration.
-
Security Fabric: Added support for FortiGate conserve mode by adding a default alert threshold for FortiGate instances for memory consumption at the conserve mode threshold.
-
Security Fabric: Improvements to how downstream FortiGate ports are determined.
-
Security Fabric: Several UI and process improvements to the Fabric discovery process.
-
Added a badge to show when discovery is actively running.
-
Added onboarding error states.
-
Changed the placeholder in the Default Port field to 443.
-
Added the Polling Status column to show if there are heartbeat incidents.

-
-
SD-WAN synthetics: SD-WAN names are now displayed on the OnSight page if an SD-WAN configuration exists.
-
Alerting: Added new logic to limit the count of email, SMS, and voice alerts sent in situations where a customer has a very large number of simultaneous incidents.
-
Monitoring policies: Added support for continually adding new metrics on data collection when applying a template using the Monitoring Policy Workflow.

April 13, 2023
-
Infrastructure Map: Instance icons in Infrastructure Map drawers are now using more specific icons for Fabric instances.
-
Monitoring policies: The options in the monitoring policy conditions list are now categorized by type. This makes it easier to choose the correct condition when creating a ruleset.

-
Security Fabric: Updated the Fabric onboarding process to detect issues and provide contextual warnings for easier troubleshooting.

April 6, 2023
-
Network device monitoring: Updated the maximum number of network devices that can be added using the Bulk Entry option to 10.
-
OnSight: OnSight versions 2020.68 and newer can now be upgraded from the control panel. For more information, see 2020.68 or newer OnSight versions.
March 30, 2023
-
API: Added API filtering support for /onsight and /onsight_group endpoints.
-
API: Improved validation around setting geo-location information on instances via the API.
-
Instance Details page: SNMP network devices now show the last device discovery time on the Instance Details page
-
Alerting: On-call schedules now properly display iCal link to download scheduled entries.
-
API: Improved logging for multi-tenant users suspending or deleting customers via API.
-
Dashboards: The Fabric Topology widget now supports the following Fabric integrations:
-
Fabric 7.x OnSight proxy
-
Fabric 6.x OnSight proxy
-
Fabric integration via FortiManager proxy
-
-
Security Fabric: The FortiManager Fabric integration now supports the following Fortinet devices:
-
SD-WAN
-
FortiSwitch
-
FortiAP
-
FortiExtender
-
March 23, 2023
-
Multi-tenancy: Restored the Assume user identity option for multi-tenant administrators when switching tenants.
-
Security Fabric: Account usage section in the control panel now correctly shows the Fabric instance usage.
-
Security Fabric: Added Fabric Heartbeat to metric type filters in the Incident Hub.
-
Security Fabric: Updated the FortiLink Status metric to appear under the FortiSwitch category when configuring Fabric templates.
March 16, 2023
-
DEM: Added support for bulk metric deletion.

-
NCM: Network Configuration Management keys are now visible on the Instance Details page.

-
Security Fabric: The IP addresses of Fabric devices when using the FortiManager proxy are now stored. This enables these Fabric instances to be the target of synthetic monitoring checks or NCM management.
-
Security Fabric: FortiManager Fabric integration now supports FortiExtender. This allows discovery of FortiExtender devices and provisioning of metrics. Note that FortiOS 7.2.1 or later is required.
March 9, 2023
-
Security Fabric: Completed verification of Fabric integration support for FortiOS 7.2.4.
-
Application monitoring: Added FortiGate/ SD-WAN health and incident information to DEM application map tooltips.
-
Integrations: Optimized the rendering of the cloud provider page when large numbers of cloud integrations are in place.
March 2, 2023
-
Application monitoring: Added support for default applications. Default applications are preconfigured checks for common applications such as Salesforce or Zoom.

For more information, see Application monitoring and Add an application.
Metric heartbeat: Added support for user-defined metric level heartbeat alerting.
This allows users to control which metrics receive heartbeat alerts. -
SNMP: Support for additional SNMP device information data for Fortinet devices.