Wireless
The Wireless panel allows you to filter data based on a specific SSID/Band or view the consolidated data for all SSIDs. The total number of impacted wireless clients at different time duration for the selected SSID/Band are displayed. The Impacted SLA data is displayed for impacted clients and/or devices (FortiGate and APs).

SLAs, Topology, and Logs
The following impacted SLAs are detected and reported by FortiAIOps with device and client details. The issues reported are categorized based on classifiers and sub-classifiers, with suggested remedial measures to curtail the SLA breaches and enhance network performance. In each impacted SLA panel, you can select Show Clients to view the impacted client count or click Show APs to view the impacted AP count.
Throughput
This SLA monitors your network for low throughput conditions and reports clients/devices based on dynamically configured threshold breaches.

To view the topology, click on Throughput in the impacted SLAs list or click on the bar in the chart.
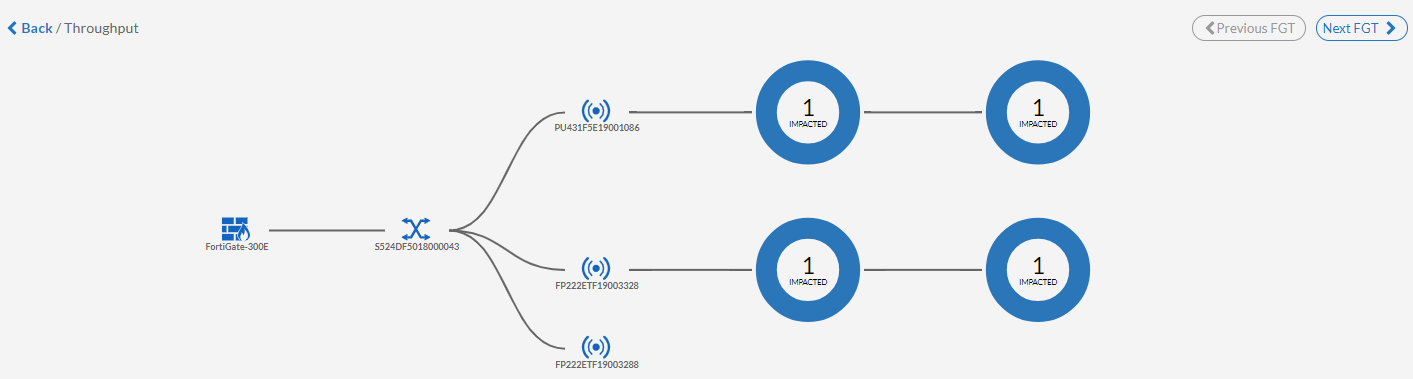
The Throughput Failures table displays information such as the impacted radios for the reported classifiers and sub-classifiers, issue description and the suggested remediation measure, and so on are displayed.

Right-click on the header of the table to select the columns that you wish to view.
|
Attribute |
Description |
|---|---|
| Date/Time | The date and time of the impact as per your timezone. |
| Classifier | The classifier of the issue reported for the SLA. |
| Subclassifier | The sub-classifier of the issue for the reported classifier. |
|
Impacted Clients |
The number of impacted clients. |
| Issue Cause | Detailed cause of the SLA breach that impacted the client/AP/FortiGate. |
| Remedy | The suggested remedy to resolve the issue. |
|
AP Radio |
The AP radio that the client associated with. |
|
AP Serial |
The AP serial number that the client associated with. |
|
Bandwidth Rx |
The Rx data throughput of the impacted AP. |
| Bandwidth Tx | The Tx data throughput of the impacted AP. |
|
FortiGate Hostname |
The hostname of the FortiGate associated with the AP/impacted client. |
|
FortiGate Serial |
The serial number of the associated FortiGate. |
| Radio Type | The impacted radio and band information. |
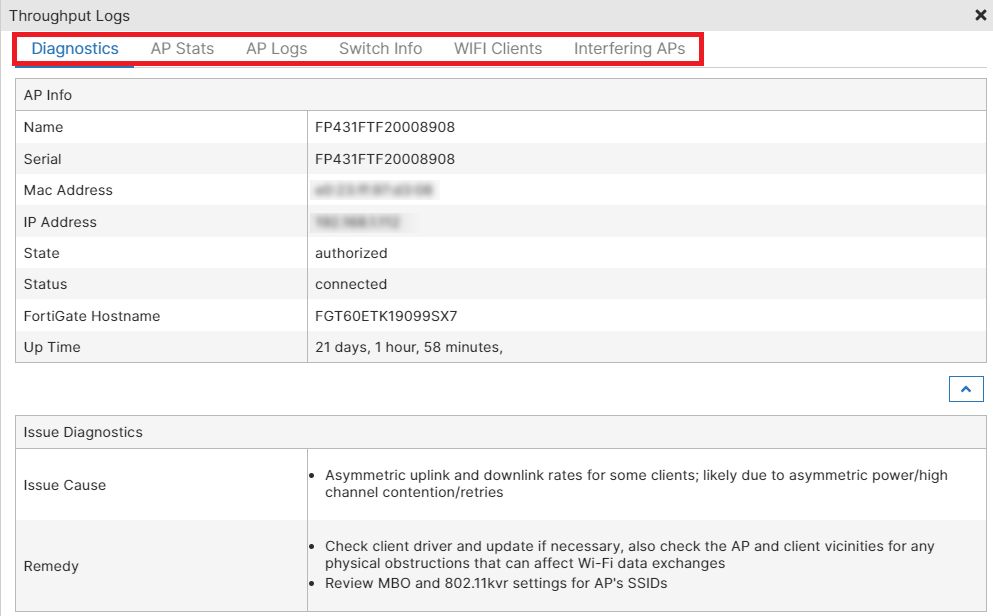
In the impacted details displayed, select a specific row of throughput failure and click View Details. You can view details of the impacted AP and issue diagnostics. You can view throughput logs related to Diagnostics with the issue description and the suggested remediation, AP Stats with the associated AP radio details, AP Logs with the time of the throughput failure event and the associated AP details, Switch Info with the switch port details connected to the AP, WIFI Clients with details of the impacted clients and a list of all WiFi clients, Interfering APs with the BSSID and the signal strength of the interfering APs.
|
Logs |
Description |
|---|---|
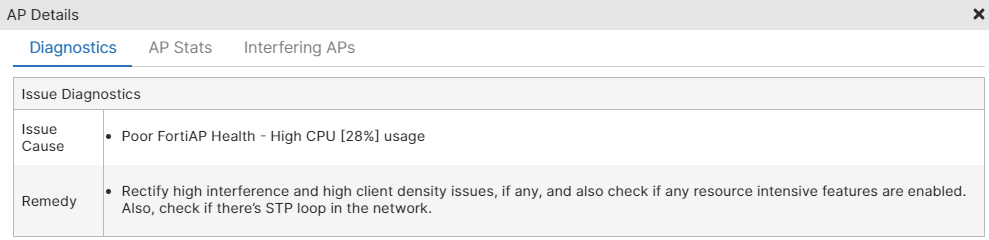
| Diagnostics |
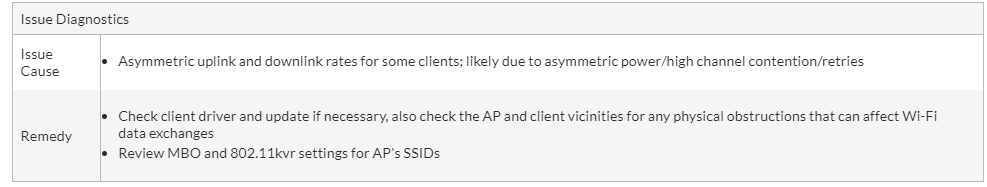
This tab provides detailed cause of the SLA breach that impacted the client/AP/FortiGate. FortiAIOps also suggests the remedy to resolve the issue.
|
| AP Stats |
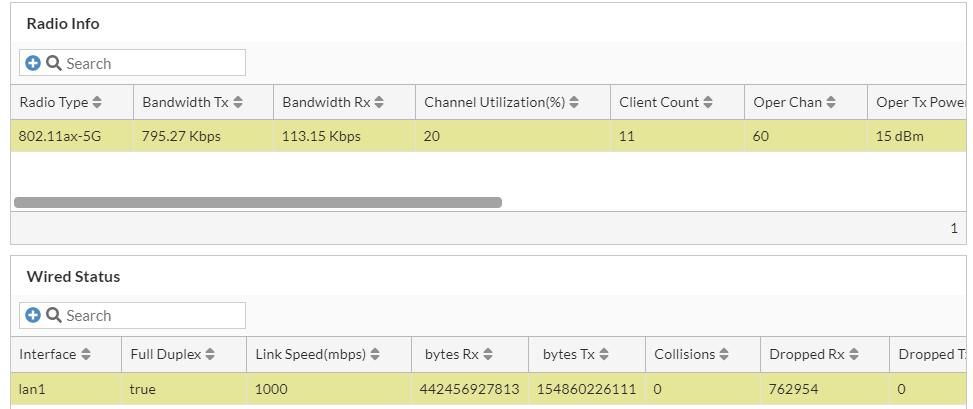
This tab displays the details of the AP radio that the client associated with and the WAN status details of the AP.
|
| AP Logs |
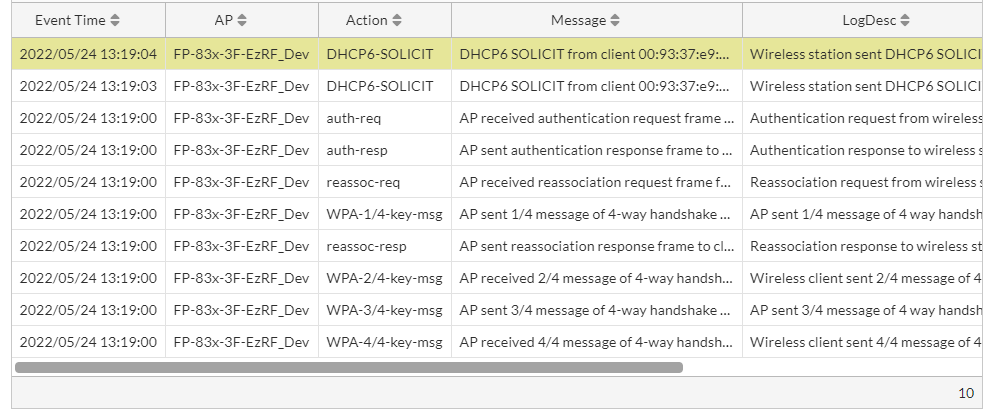
This tab provides the AP event logs generated from FortiGate.
|
|
Switch Info |
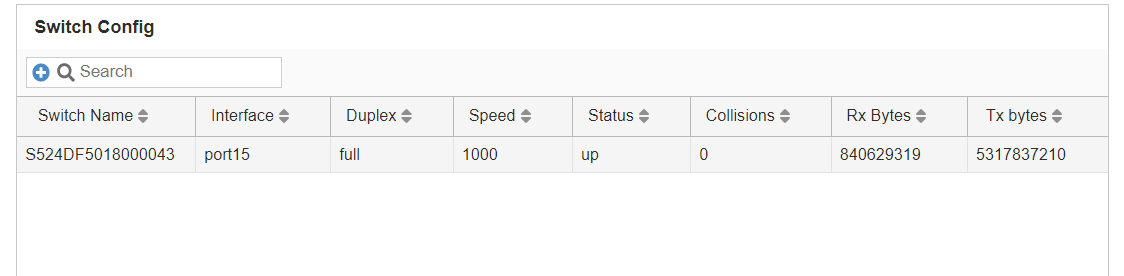
This tab displays the configuration details of the switch port connected to the AP.
|
|
WIFI Clients |
This tab provides details of the impacted clients and also lists all the clients associated with the AP.
|
|
Interfering APs |
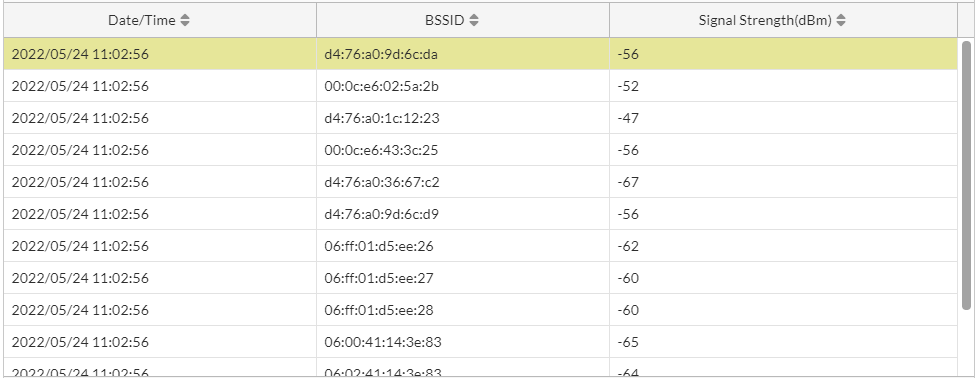
This tab displays details of the interfering APs in your network.
|

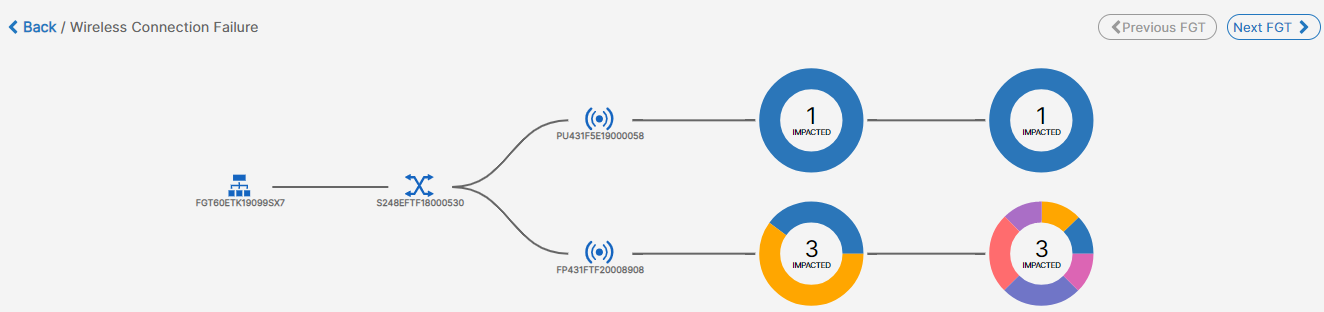
The donut charts that represent the classifiers and sub-classifiers in the topology, provide the count of the impacted clients associated with each AP. Click on any of these charts to view the impacted client details per AP.

Right-click on the header of the table to select the following columns that you wish to view.
|
Attribute |
Description |
|---|---|
| Date/Time | The date and time of the impact as per your timezone. |
| Client MAC Address | The MAC address of the impacted client device. |
| Device | The MAC address of the impacted client device. |
| SSID | The SSID that the impacted client is associated with. |
| Radio Type | The impacted radio and band information associated with the client. |
| Classifier | The classifier of the issue reported for the SLA. |
| Subclassifier | The sub-classifier of the issue for the reported classifier. |
| Signal Strength | The signal strength of the client at the time of impact. |
|
Tx Rate |
The Tx data rate achieved by the client. |
|
Rx Rate |
The Rx data rate achieved by the client. |
|
AP Radio |
The AP radio that the client associated with. |
|
AP Serial |
The AP serial number that the client associated with. |
|
Channel |
The channel at which the client connected. |
|
FortiGate Hostname |
The hostname of the FortiGate associated with the AP/impacted client. |
|
FortiGate Serial |
The serial number of the associated FortiGate. |
|
Max Capacity |
The maximum data rate supported by the client at the time of impact. |
|
SNR |
The client SNR reported at the time of impact. |
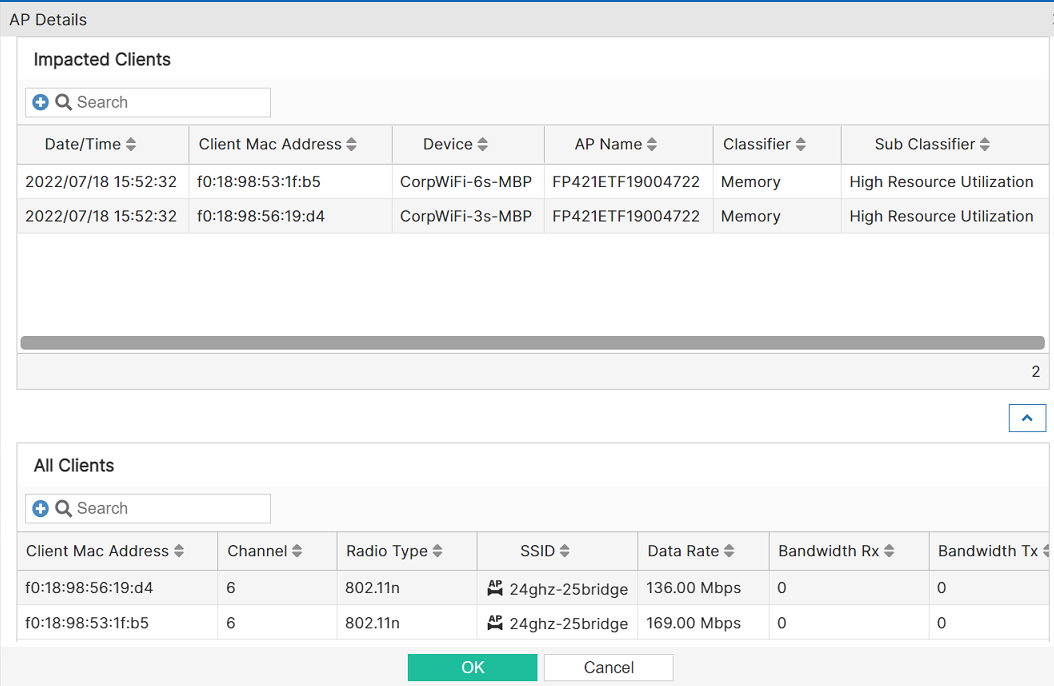
Select any impacted client and click Show AP details to view the detailed AP logs. For more details on each of these tabs, see View Details in Throughput logs described earlier in the section.
Connection Failure
Displays the failed/unsuccessful client connections based on different stages of connection to a network. For example, association failures due to low RSSI, authentication failures due to unreachable RADIUS server, DHCP failure due to a DHCP server process crash, or DNS failure due to an invalid DNS domain.
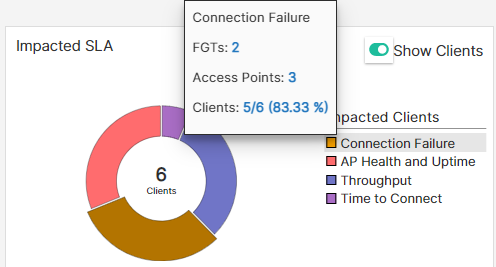
To view the topology, click on Connection Failure in the impacted SLAs list or click on the bar in the chart.
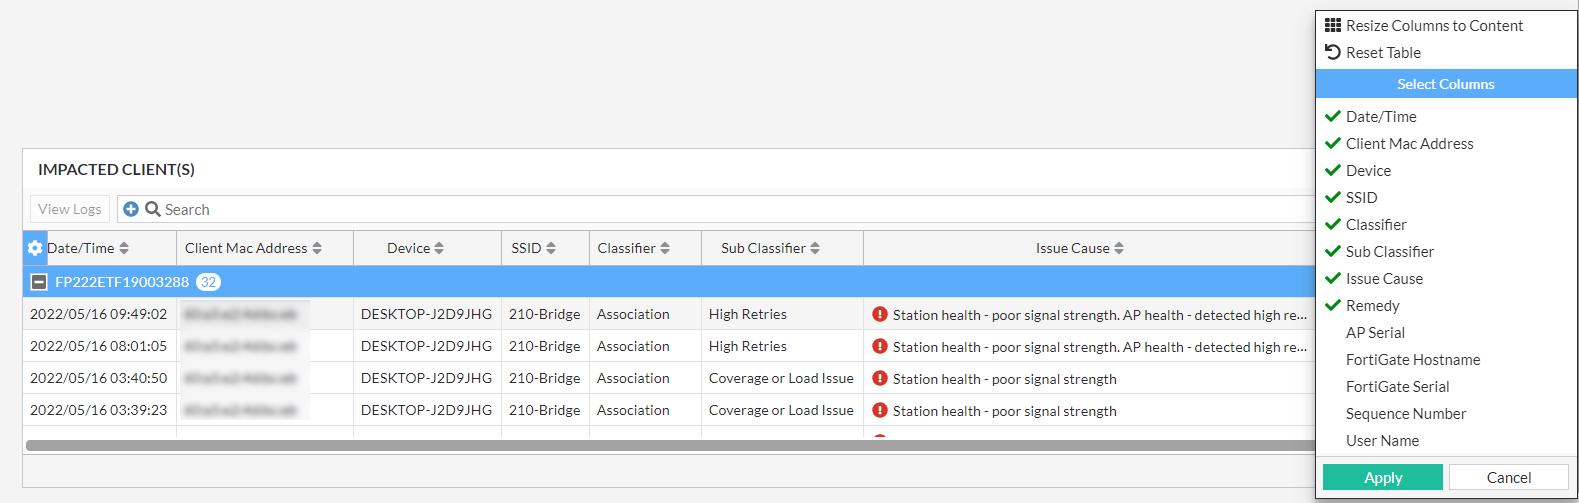
The Impacted Clients table displays details such as the client MAC address, the associated AP serial number and the SSID, the issue classifier/category and the sub-classifier, the issue description and the suggested remediation measure, and so on are displayed.

Right-click on the header of the table to select the columns that you wish to view.
|
Attribute |
Description |
|---|---|
| Date/Time | The date and time of the impact as per your timezone. |
| Client MAC Address | The MAC address of the impacted client device. |
| Device | The MAC address of the impacted client device. |
| SSID | The SSID that the impacted client is associated with. |
| Classifier | The classifier of the issue reported for the SLA. |
| Subclassifier | The sub-classifier of the issue for the reported classifier. |
| Signal Strength | The signal strength of the client at the time of impact. |
| Issue Cause | detailed cause of the SLA breach that impacted the client/AP/FortiGate. |
| Remedy | The suggested remedy to resolve the issue. |
|
AP Serial |
The AP serial number that the client associated with. |
|
FortiGate Hostname |
The hostname of the FortiGate associated with the AP/impacted client. |
|
FortiGate Serial |
The serial number of the associated FortiGate. |
|
User Name |
The impacted client user name. |
In the impacted client details displayed for Successful Connects, select a specific client and click View Logs. You can view Client Details such as the client device name, the name of the AP it is associated with and the time of association, associated SSID, and operational details such as the channel and the MIMO mode. The client Status such as the associated bandwidth (2.5GHZ/5GHZ), signal strength (RSSI), signal noise, rate of transmission discard and rate of transmission retry between the client and the AP. The Client Logs display the time stamp of each action and action classification as notice, warning, etc., and the action details and the associated channel.

Time to Connect
Displays the details of clients that breach the SLA threshold values for these stages of connection, Association, Authentication, DHCP, and DNS. The actual value of time taken and the configured Time to Connect threshold values (static/dynamic) are compared. For SLA configurations, see Time To Connect
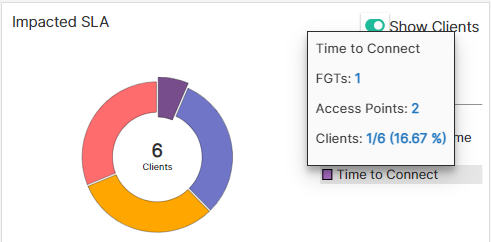
To view the topology, click on Time to Connect in the impacted SLAs list or click on the bar in the chart.

The Time to Connect table displays details such as the client MAC address, the associated AP serial number and the SSID, the issue classifier/category and the sub-classifier, the issue description and the suggested remediation measure, and so on are displayed. In this image impacted client details for Time to Connect are displayed.
Right-click on the header of the table to select the columns that you wish to view.
|
Attribute |
Description |
|---|---|
| Date/Time | The date and time of the impact as per your timezone. |
| Client MAC Address | The MAC address of the impacted client device. |
| Device | The MAC address of the impacted client device. |
| SSID | The SSID that the impacted client is associated with. |
| Classifier | The classifier of the issue reported for the SLA. |
| Subclassifier | The sub-classifier of the issue for the reported classifier. |
| Signal Strength | The signal strength of the client at the time of impact. |
| Issue Cause | detailed cause of the SLA breach that impacted the client/AP/FortiGate. |
| Remedy | The suggested remedy to resolve the issue. |
|
AP Serial |
The AP serial number that the client associated with. |
|
FortiGate Hostname |
The hostname of the FortiGate associated with the AP/impacted client. |
|
FortiGate Serial |
The serial number of the associated FortiGate. |
|
User Name |
The impacted client user name. |
In the impacted client details displayed for Time to Connect, select a specific client and click View Logs to view the raw logs associated with the impacted client. You can view Client Details such as the client device name, the name of the AP it is associated with and the time of association, associated SSID, and operational details such as the channel and the MIMO mode. The client Status such as the associated bandwidth (2.5GHZ/5GHZ), signal strength (RSSI), signal noise, rate of transmission discard and rate of transmission retry between the client and the AP. The Client Logs display the time stamp of each action and action classification as notice, warning, etc., and the action details and the associated channel.

Coverage
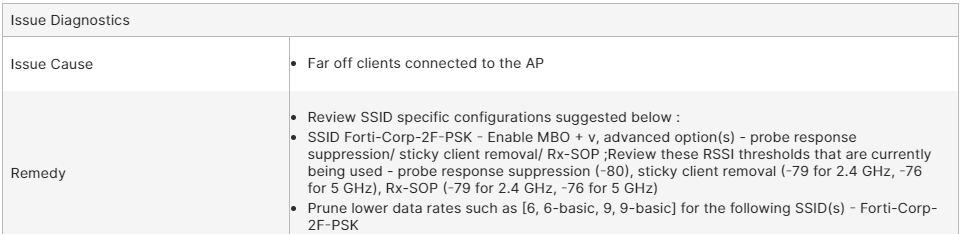
This SLA monitors your network for coverage issues and reports clients/devices based on dynamically configured threshold breaches.
. 
To view the topology, click on Coverage in the impacted SLAs list or click on the bar in the chart.
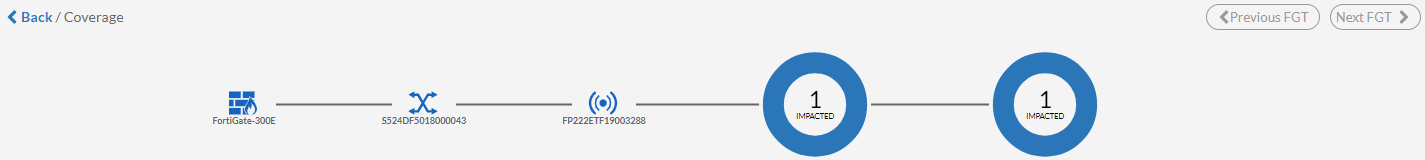
The AP Events table displays issue details such as the radio type, Tx power, neighbour AP count, the issue classifier/category and the sub-classifier, the issue description and the suggested remediation measure, and so on are displayed.

Right-click on the header of the table to select the columns that you wish to view.
|
Attribute |
Description |
|---|---|
| Date/Time | The date and time of the impact as per your timezone. |
| Classifier | The classifier of the issue reported for the SLA. |
| Subclassifier | The sub-classifier of the issue for the reported classifier. |
| Issue Cause | detailed cause of the SLA breach that impacted the client/AP/FortiGate. |
| Remedy | The suggested remedy to resolve the issue. |
|
AP Radio |
The AP radio that the client associated with. |
|
AP Serial |
The AP serial number that the client associated with. |
| Neighbour AP Count | The number of neighbouring APs of the impacted AP. |
| Tx Power | The Tx power of the AP at the time of impact. |
|
FortiGate Hostname |
The hostname of the FortiGate associated with the AP/impacted client. |
|
FortiGate Serial |
The serial number of the associated FortiGate. |
| Radio Type | The impacted radio and band associated with the client. |
|
Channel |
The channel at which the client connected. |
|
Impacted Clients |
The number of impacted clients. |
To view the logs, select a specific row of an AP event and click View Logs. You can view coverage logs related to Diagnostics with the issue description and the suggested remediation, AP Stats with the associated AP radio details, AP Logs with the time of the throughput failure event and the associated AP details, Switch Info with the switch port details connected to the AP, WIFI Clients with details of the impacted clients and a list of all WiFi clients, Interfering APs with the BSSID and the signal strength of the interfering APs.

|
Logs |
Description |
|---|---|
| Diagnostics |
This tab provides detailed cause of the SLA breach that impacted the client/AP/FortiGate. FortiAIOps also suggests the remedy to resolve the issue.
|
| AP Stats |
This tab displays the details of the AP radio that the client associated with and the WAN status details of the AP.
|
| AP Logs |
This tab provides the AP event logs generated from FortiGate.
|
|
Switch Info |
This tab displays the configuration details of the switch port connected to the AP.
|
|
WIFI Clients |
This tab provides details of the impacted clients and also lists all the clients associated with the AP.
|
|
Interfering APs |
This tab displays details of the interfering APs in your network.
|
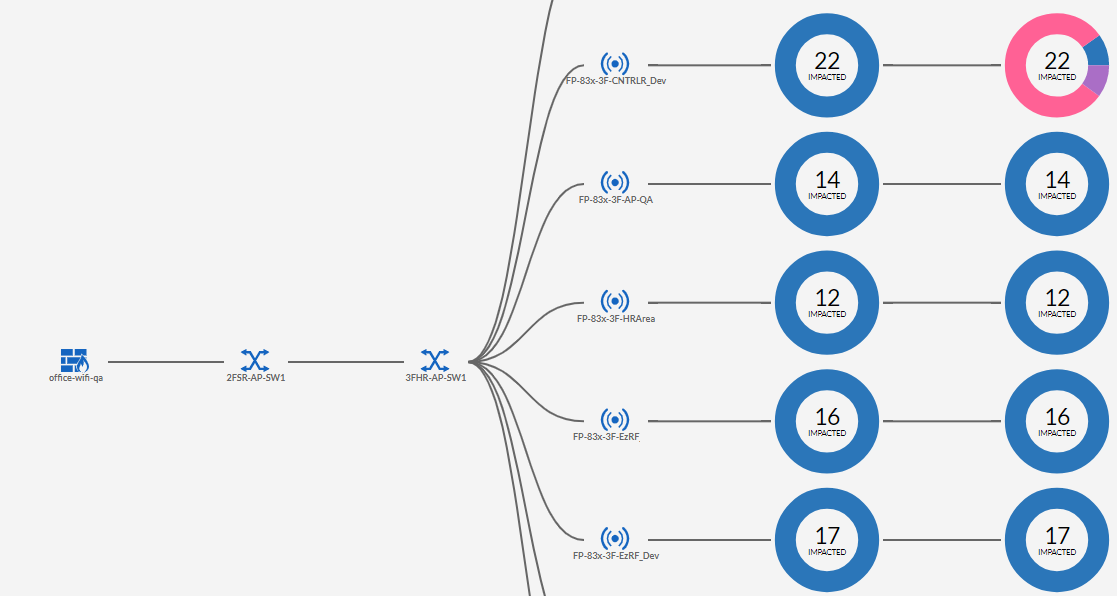
The donut charts in the topology provide the count of the impacted clients associated with each AP. Click on any of these charts to view the impacted client details per AP.

Right-click on the header of the table to select the following columns that you wish to view.
|
Attribute |
Description |
|---|---|
| Date/Time | The date and time of the impact as per your timezone. |
| Client MAC Address | The MAC address of the impacted client device. |
| Device | The MAC address of the impacted client device. |
| SSID | The SSID that the impacted client is associated with. |
| Radio Type | The impacted radio and band information associated with the client. |
| Classifier | The classifier of the issue reported for the SLA. |
| Subclassifier | The sub-classifier of the issue for the reported classifier. |
| Signal Strength | The signal strength of the client at the time of impact. |
|
AP Radio |
The AP radio that the client associated with. |
|
AP Serial |
The AP serial number that the client associated with. |
|
Channel |
The channel at which the client connected. |
|
FortiGate Hostname |
The hostname of the FortiGate associated with the AP/impacted client. |
|
FortiGate Serial |
The serial number of the associated FortiGate. |
|
RSSI Neighbour AP |
The highest neighbour AP RSSI. |
|
SNR |
The client SNR reported at the time of impact. |
For more details on each of these tabs, see View Logs described earlier in the section.
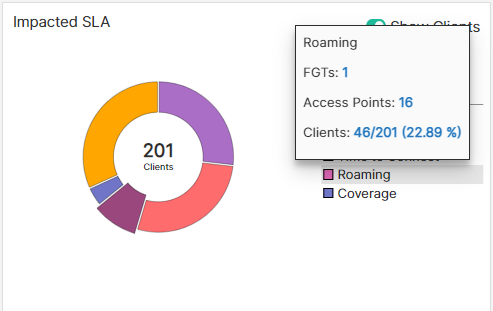
Roaming
Slow roaming clients are detected based on the variation of the classifier threshold values set by the users or calculated dynamically by FortiAIOps. The parameters to identify slow roaming clients are Fast BSS Transition Roams, PMK Cache, and Opportunistic Key Caching Roams. Any breach in the threshold values are detected and reported. For SLA configurations, see Roaming.
To view the topology, click on Roaming in the impacted SLAs list or click on the bar in the chart.
The Impacted Clients table displays details such as the client MAC address, the associated AP serial number and the SSID, the issue classifier/category and the sub-classifier, the issue description and the suggested remediation measure, and so on.

Right-click on the header of the table to select the columns that you wish to view.
|
Attribute |
Description |
|---|---|
| Date/Time | The date and time of the impact as per your timezone. |
| Client MAC Address | The MAC address of the impacted client device. |
| Device | The MAC address of the impacted client device. |
| SSID | The SSID that the impacted client is associated with. |
| Classifier | The classifier of the issue reported for the SLA. |
| Subclassifier | The sub-classifier of the issue for the reported classifier. |
| Delay (ms) | The delay (latency) in client roaming (milliseconds) in case of threshold breach. |
|
Radio |
The AP radio that the client associated with. |
|
AP Serial |
The AP serial number that the client associated with. |
|
Channel |
The channel at which the AP/client were operating. |
| Issue Cause | detailed cause of the SLA breach that impacted the client/AP/FortiGate. |
| Remedy | The suggested remedy to resolve the issue. |
To view the logs, select a specific row of an AP event and click View Logs. You can view client details such as Diagnostics with the issue description and the suggested remediation, AP Stats with the associated AP radio details, and Client Logs with details of the impacted clients.
|
Logs |
Description |
|---|---|
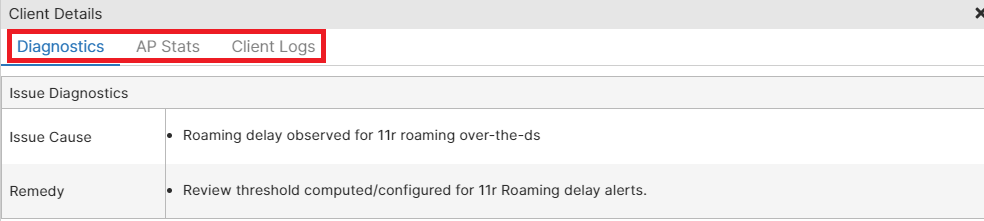
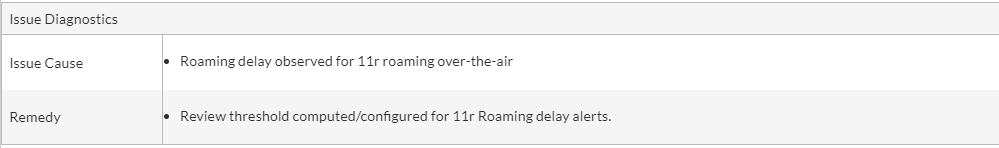
| Diagnostics |
This tab provides detailed cause of the SLA breach that impacted the client. FortiAIOps also suggests the remedy to resolve the issue.
|
| AP Stats |
This tab displays the details of the AP radio that the client associated with.
|
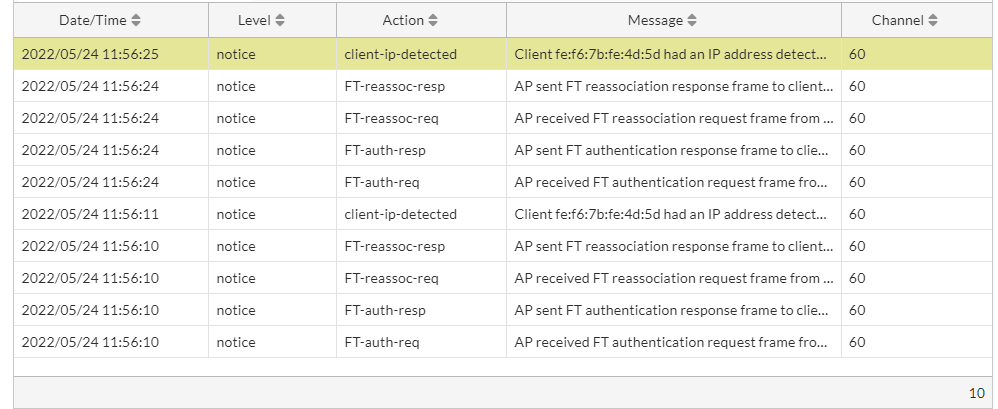
| Client Logs |
This tab provides client event logs.
|

In the various throughput logs displayed, you can right-click on the table header to select the details you want to view.
AP Health and Uptime
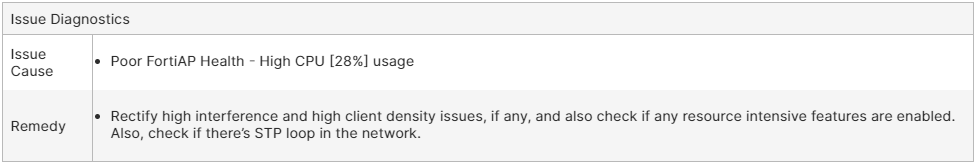
Displays the AP health based on the configured AP health threshold values and the AP down status due to AP/FortiGate reboot, disabled switch port etc. For SLA configurations, see Device Health
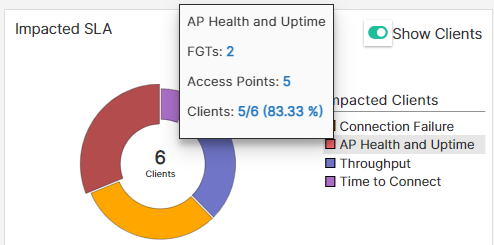
To view the topology, click on AP Health and Uptime in the impacted SLAs list or click on the bar in the chart.
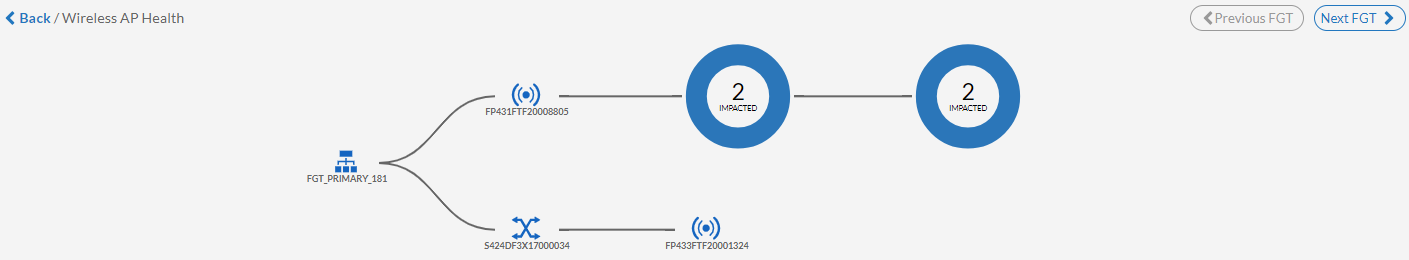
The AP Events table displays issue details such as the issue classifier/category and the sub-classifier, the issue description and the suggested remediation measure, and so on.
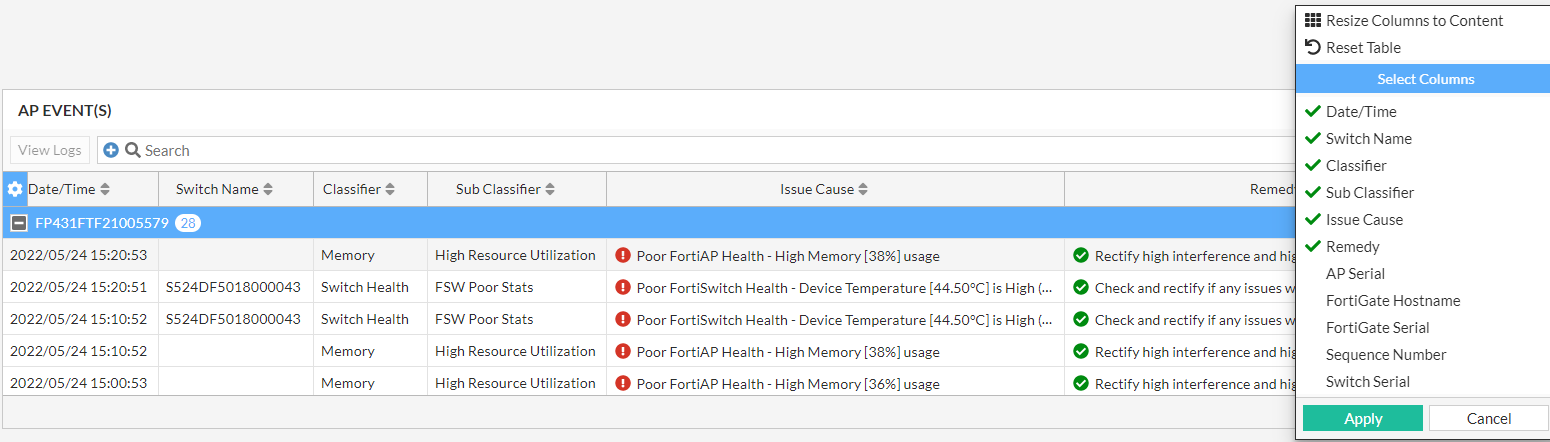
Right-click on the header of the table to select the columns that you wish to view.
|
Attribute |
Description |
|---|---|
| Date/Time | The date and time of the impact as per your timezone. |
| Switch Name | The name of the switch associated with the impacted AP/client. |
| Issue Cause | detailed cause of the SLA breach that impacted the client/AP/FortiGate. |
| Remedy | The suggested remedy to resolve the issue. |
| Classifier | The classifier of the issue reported for the SLA. |
| Subclassifier | The sub-classifier of the issue for the reported classifier. |
|
AP Serial |
The AP serial number that the client associated with. |
|
FortiGate Hostname |
The hostname of the FortiGate associated with the AP/impacted client. |
|
FortiGate Serial |
The serial number of the associated FortiGate. |
|
Switch Serial |
The serial number of the switch associated with the impacted AP/client. |
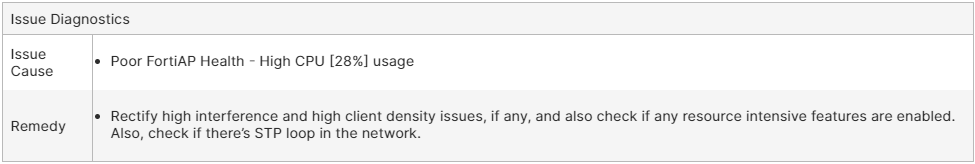
In the AP events displayed, select an event and click View Logs.

|
Logs |
Description |
|---|---|
| Diagnostics |
This tab provides detailed cause of the SLA breach that impacted the client/AP/FortiGate. FortiAIOps also suggests the remedy to resolve the issue.
|
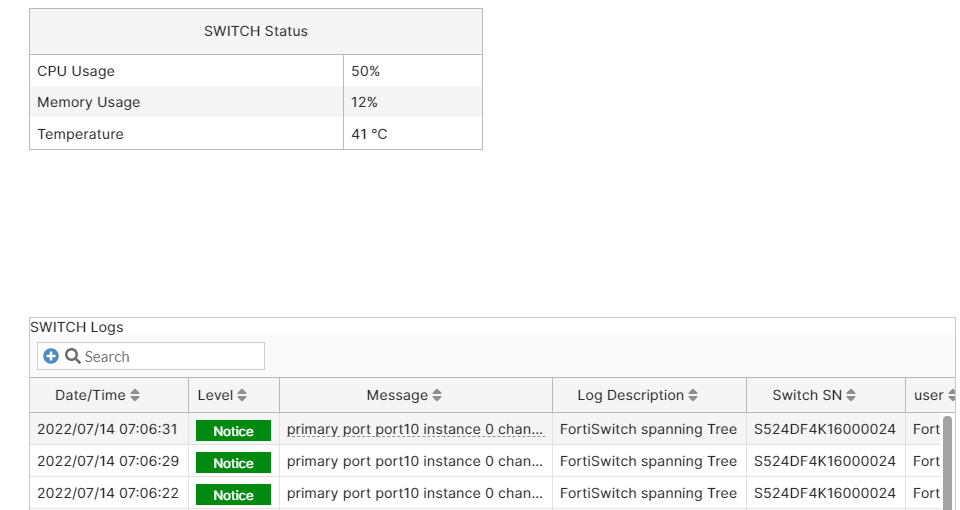
| AP Stats |
This tab displays the details of the AP radio that the client associated with and the WAN status details of the AP.
|
| Logs |
|
|
WIFI Clients |
This tab provides details of the impacted clients and also lists all the clients associated with the AP.
|
|
Interfering APs |
This tab displays details of the interfering APs in your network.
|
The donut charts in the topology provide the count of the impacted clients associated with each AP. Click on any of these charts to view the impacted client details per AP.
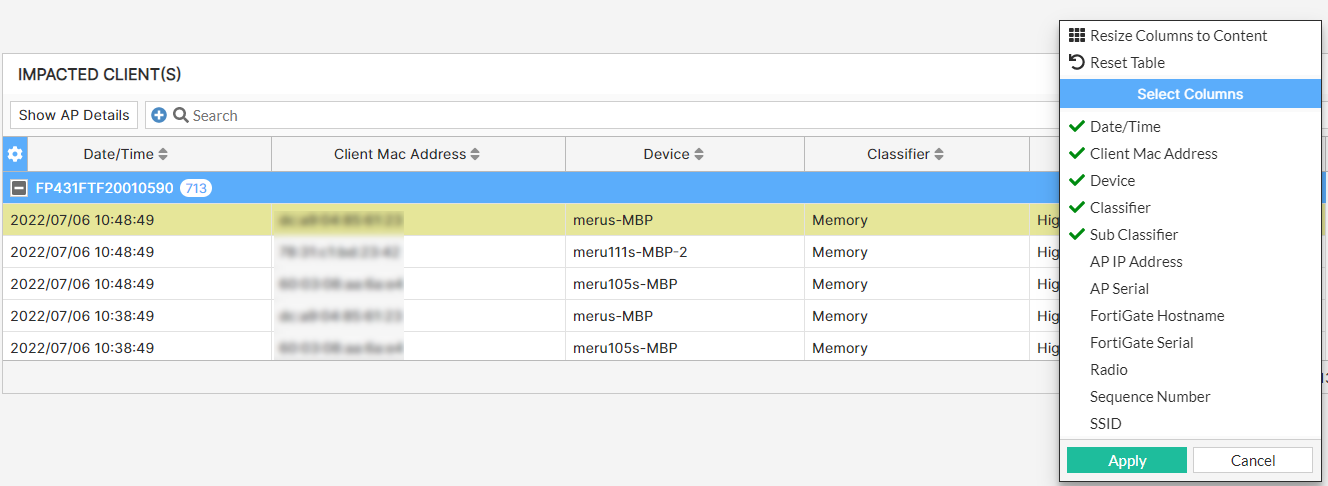
Right-click on the header of the table to select the following columns that you wish to view.
|
Attribute |
Description |
|---|---|
| Date/Time | The date and time of the impact as per your timezone. |
| Client MAC Address | The MAC address of the impacted client device. |
| Device | The MAC address of the impacted client device. |
| SSID | The SSID that the impacted client is associated with. |
| Classifier | The classifier of the issue reported for the SLA. |
| Subclassifier | The sub-classifier of the issue for the reported classifier. |
| AP IP Address | The IP address of the impacted AP. |
|
Radio |
The AP radio that the client associated with. |
|
AP Serial |
The AP serial number that the client associated with. |
|
Channel |
The channel at which the client connected. |
|
FortiGate Hostname |
The hostname of the FortiGate associated with the AP/impacted client. |
|
FortiGate Serial |
The serial number of the associated FortiGate. |
Select any impacted client and click Show AP details to view the detailed AP logs.
Select any of the tabs to view the data described in this table.
|
Logs |
Description |
|---|---|
| Diagnostics |
This tab provides detailed cause of the SLA breach that impacted the client/AP/FortiGate. FortiAIOps also suggests the remedy to resolve the issue.
|
| AP Stats |
This tab displays the details of the AP radio that the client associated with and the WAN status details of the AP.
|
|
Interfering APs |
This tab displays details of the interfering APs in your network.
|