
Creating a fabric system and license dashboard
Create a dashboard summary page to monitor all the Fabric devices in a single view. You can use this dashboard to monitor aspects of the devices such as system information, VPN and routing.
Example
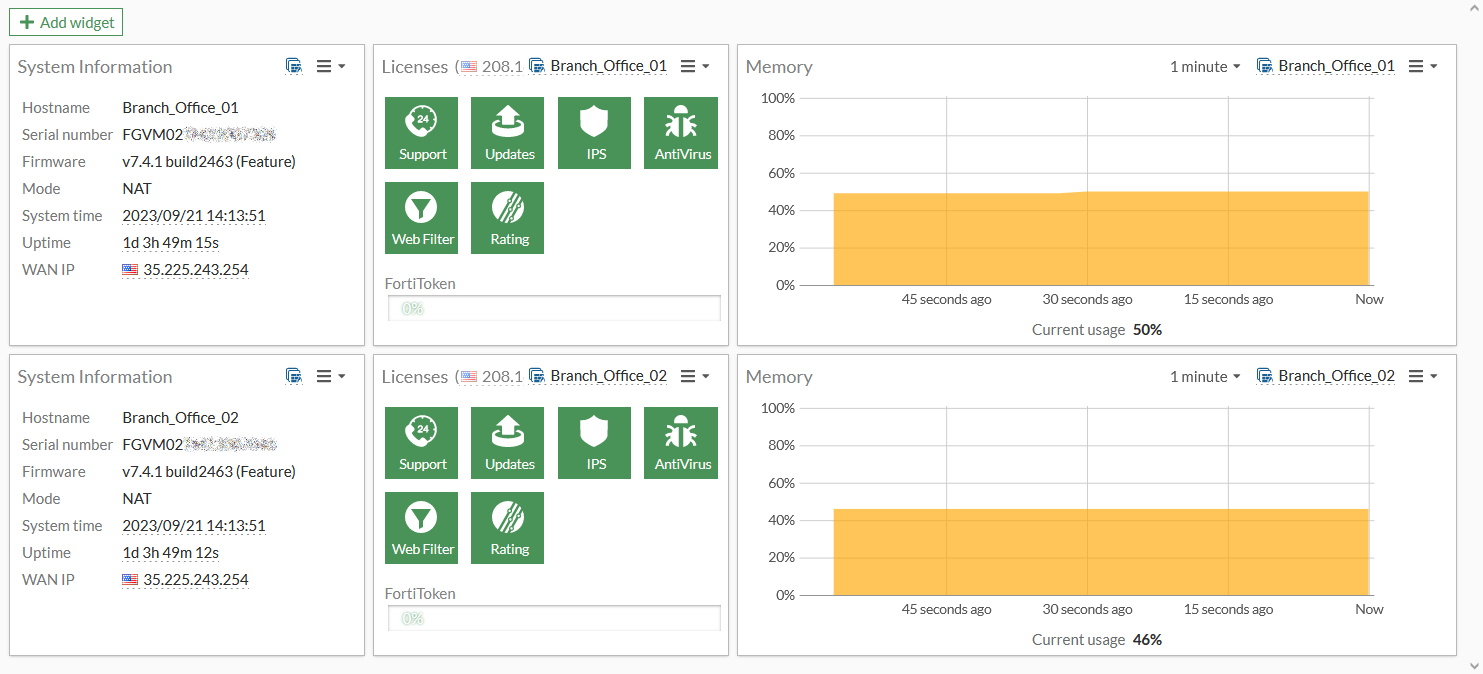
The following image is an example of a Fabric System & License dashboard to monitor the System Information, Licenses, and Memory usage for Branch_Office_01 and Branch_Office_02.
To create a system dashboard:
-
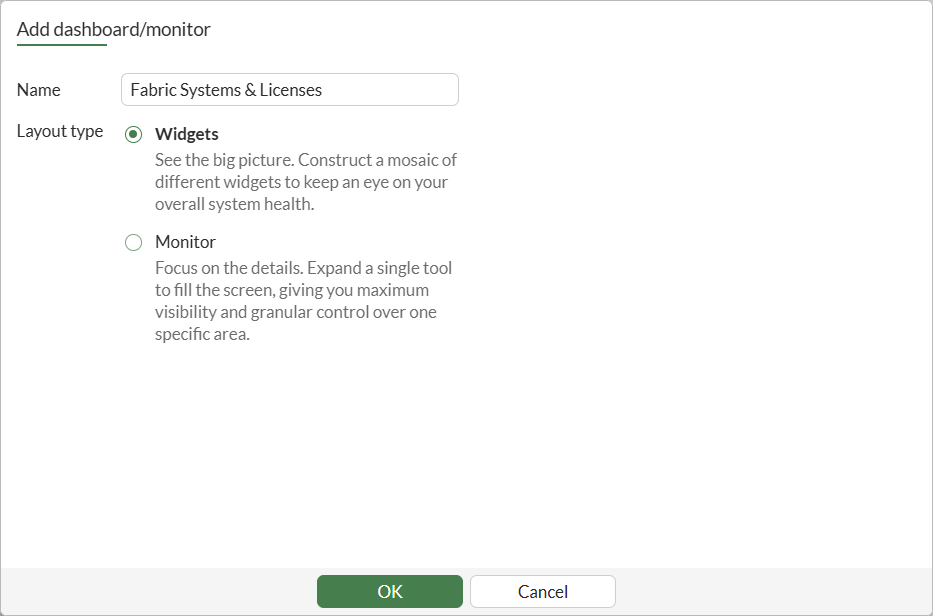
Click the Add dashboard/monitor button. The Add dashboard/monitor window opens.
-
In the Name field, enter a name such as Fabric System & Licenses, select Widgets, and click OK.
The new dashboard appears under Dashboard in the tree menu.
-
Add one or more widgets:
-
In the banner, click Add Widget. The Add dashboard widget window opens.
Use the Search field to search for a specific widget (for example, License Status, System Information, and Memory Usage).
-
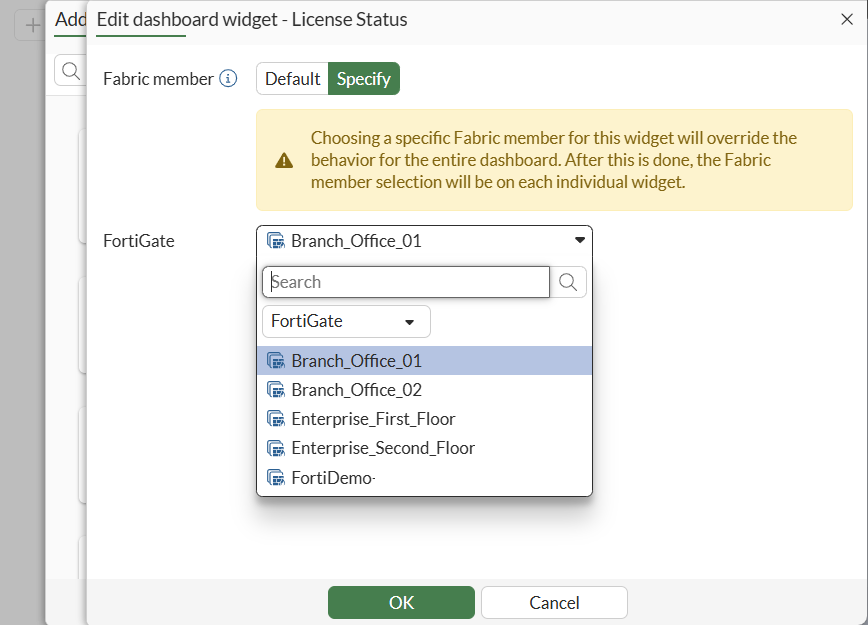
Click the Add button next to widget. The Add Dashboard Widget window opens.
-
In the Fabric member area, select Specify, select a device in the Security Fabric, and click OK. The widget is added to the dashboard.
-
Repeat this step for all the devices you want to view in the dashboard.
-
-
Click Close.
-
(Optional) Arrange the widgets in the dashboard by Fabric device.