Using the debug flow tool
Administrators can use the debug flow tool to display debug flow output in real-time until it is stopped. The completed output can be filtered by time, message, or function. The output can be exported as a CSV file.
For information about using the debug flow tool in the CLI, see Debugging the packet flow.
To run a debug flow:
-
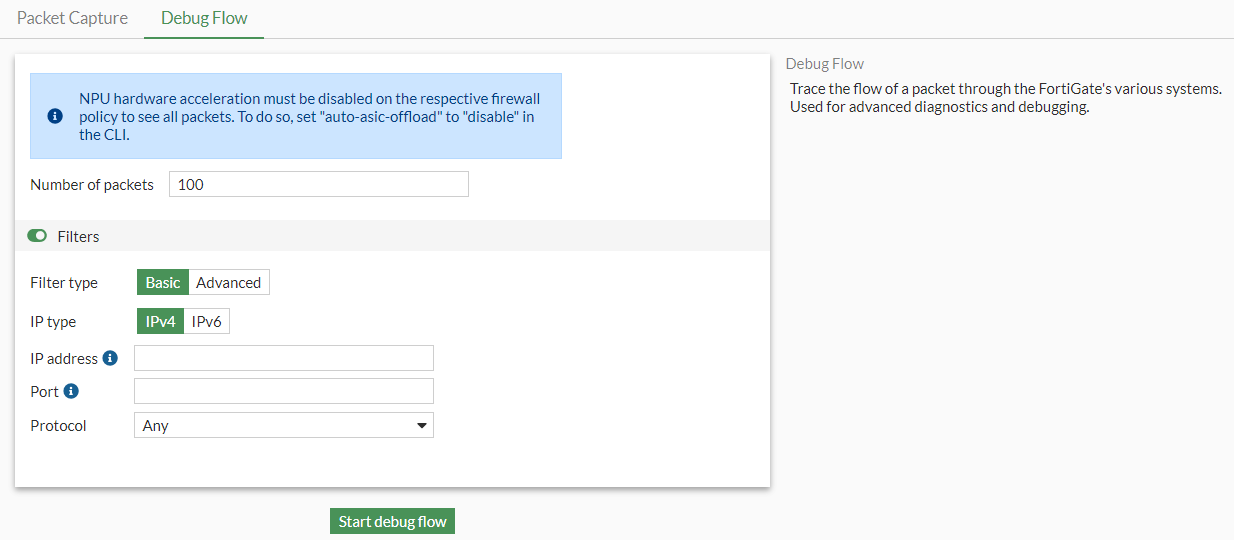
Go to Network > Diagnostics and select the Debug Flow tab.
-
Optionally, enable Filters and select a Filter type:
-
Basic: filter by IP address, Port, and Protocol, which is the equivalent of:
# diagnose debug flow filter addr <addr/range>
# diagnose debug flow filter port <port/range>
# diagnose debug flow filter proto <protocol>
-
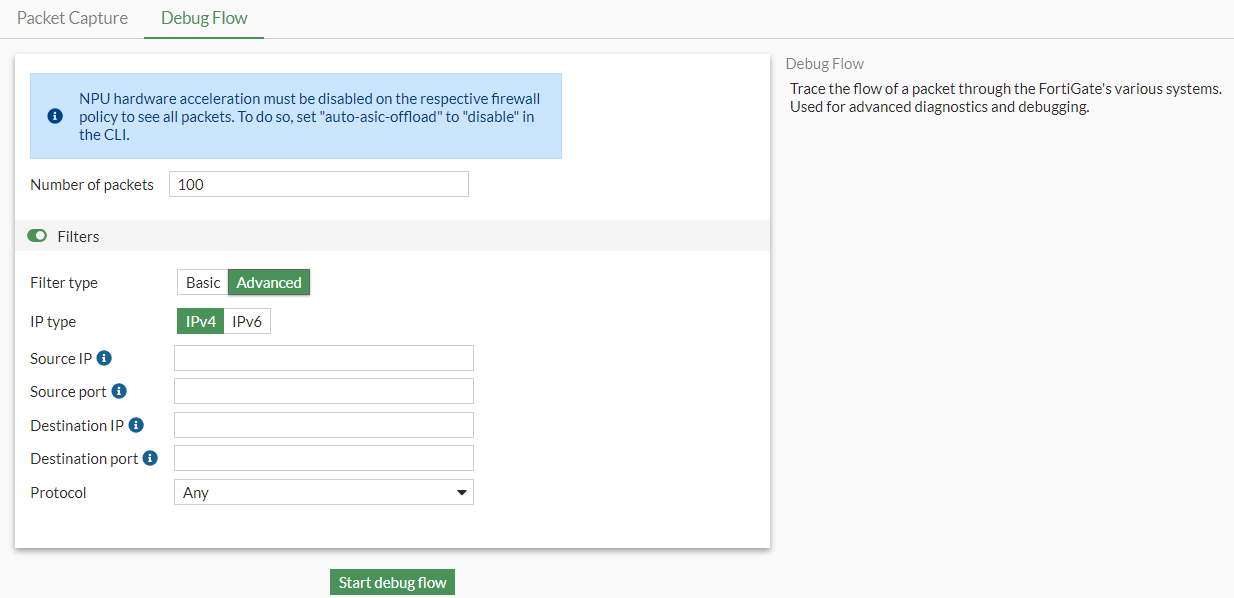
Advanced: filter by Source IP, Source port, Destination IP, Destination port, and Protocol, which is the equivalent of:
# diagnose debug flow filter saddr <addr/range>
# diagnose debug flow filter sport <port/range>
# diagnose debug flow filter daddr <addr/range>
# diagnose debug flow filter dport <port/range>
# diagnose debug flow filter proto <protocol>
-
-
Click Start debug flow. The debug messages are visible in real-time.
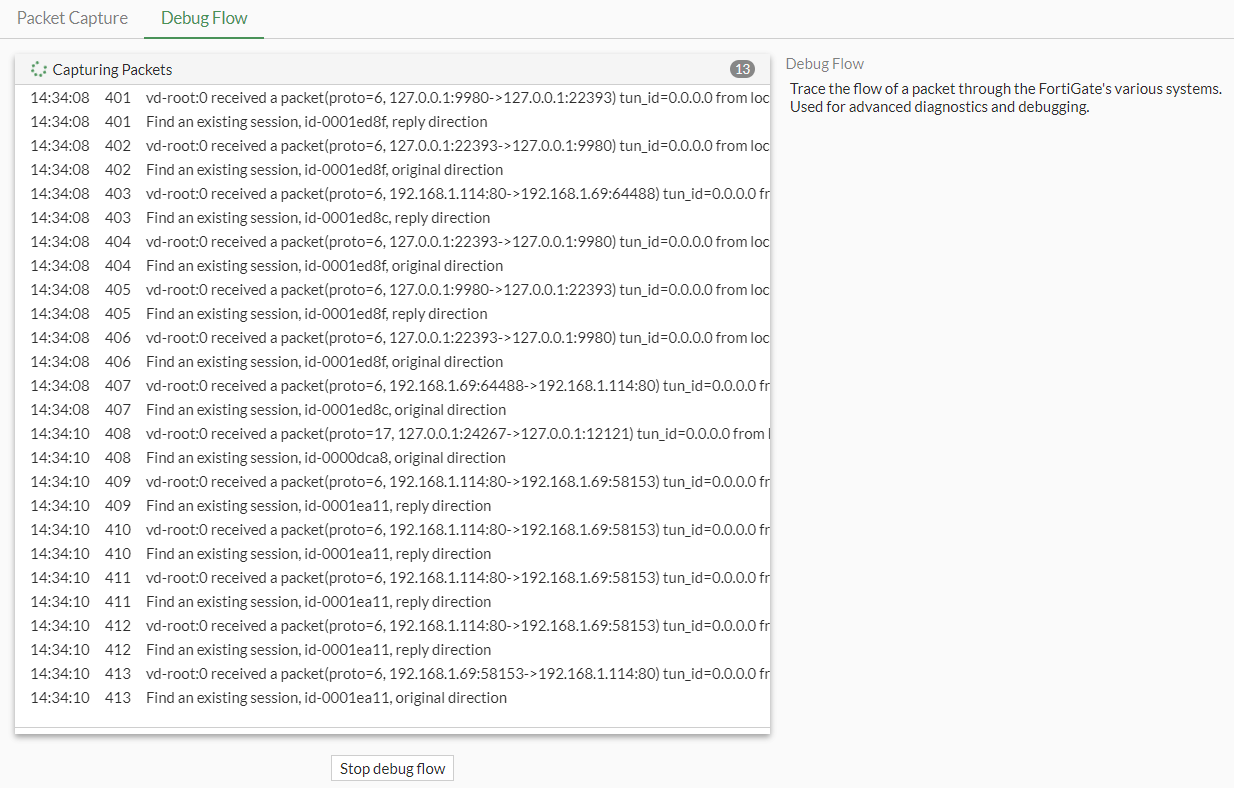
-
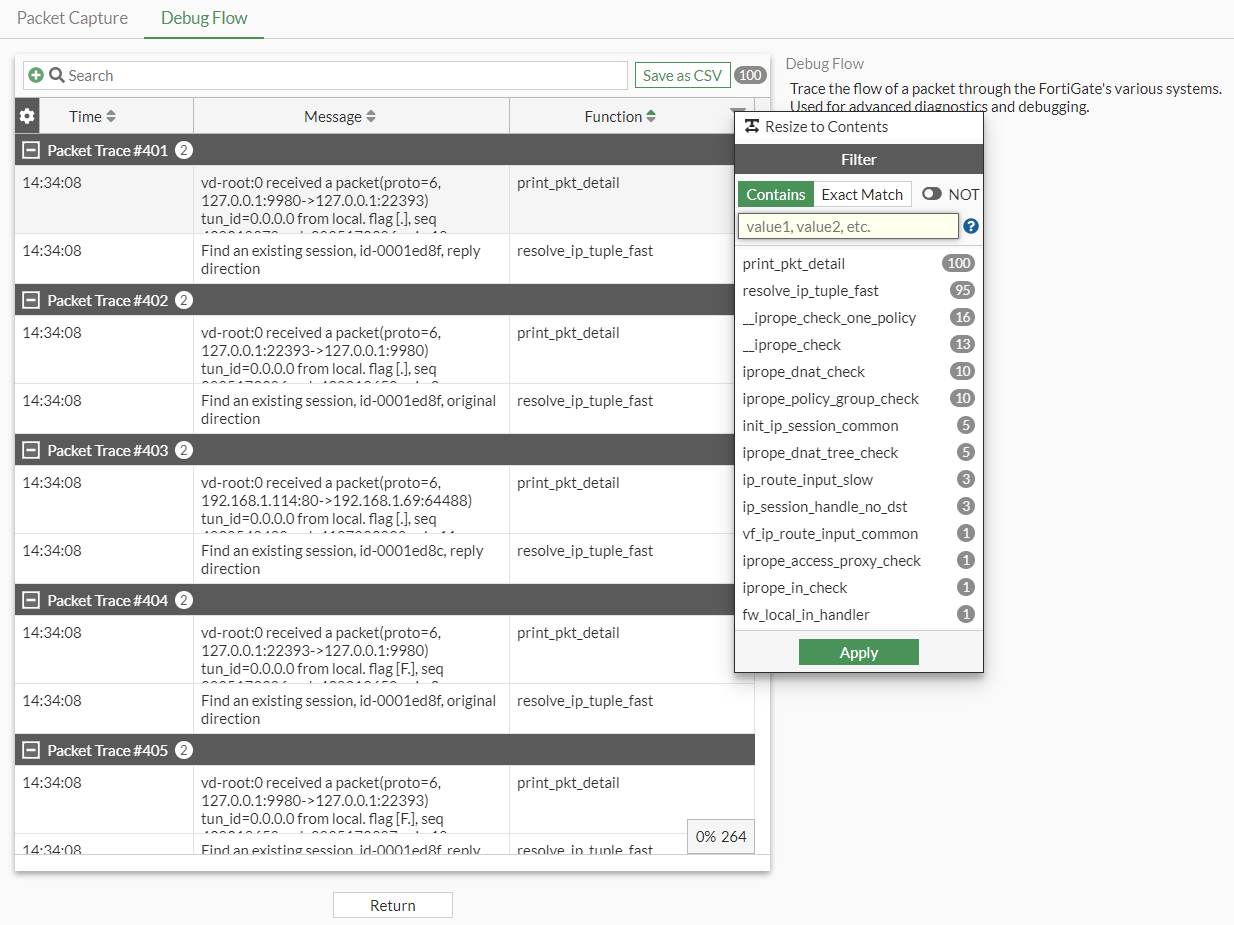
When the debug flow is finished (or you click Stop debug flow), click Save as CSV. The CSV file is automatically downloaded.
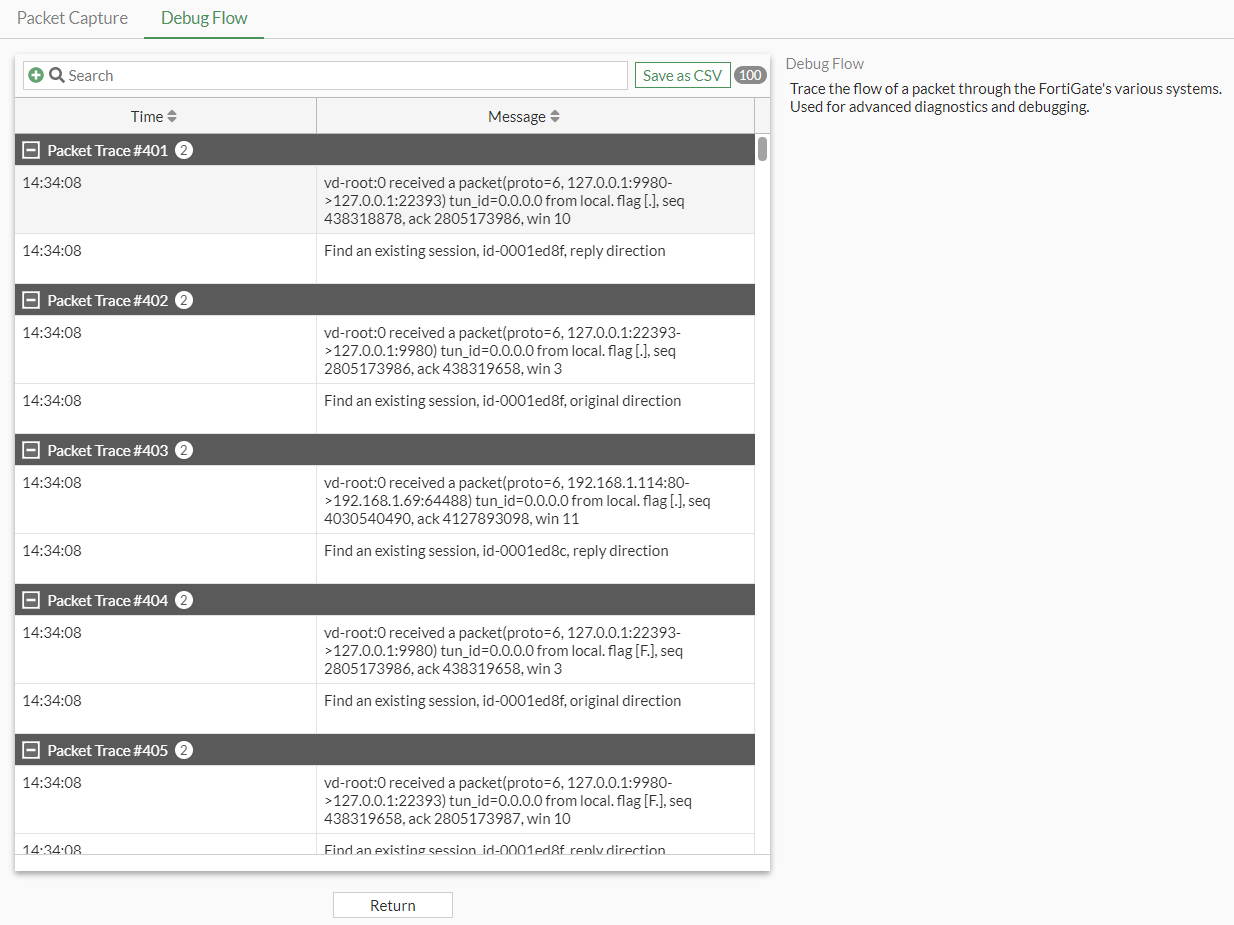
The current output can be filtered by Time and Message. The Function field can be added.
-
Hover over the table header and click the gear icon (Configure Table).
-
Select Function and click Apply. The Function column is displayed and can be used to filter the output for further analysis.