


SD-WAN logging
Now that we understand FortiAnalyzer acts as the central monitoring platform, let’s look at the log types. As outlined in previous sections, FortiGate acts as the branch CPE in the SD-WAN solution. It utilizes SLA probes across the overlays to record latency, jitter, and packet loss.
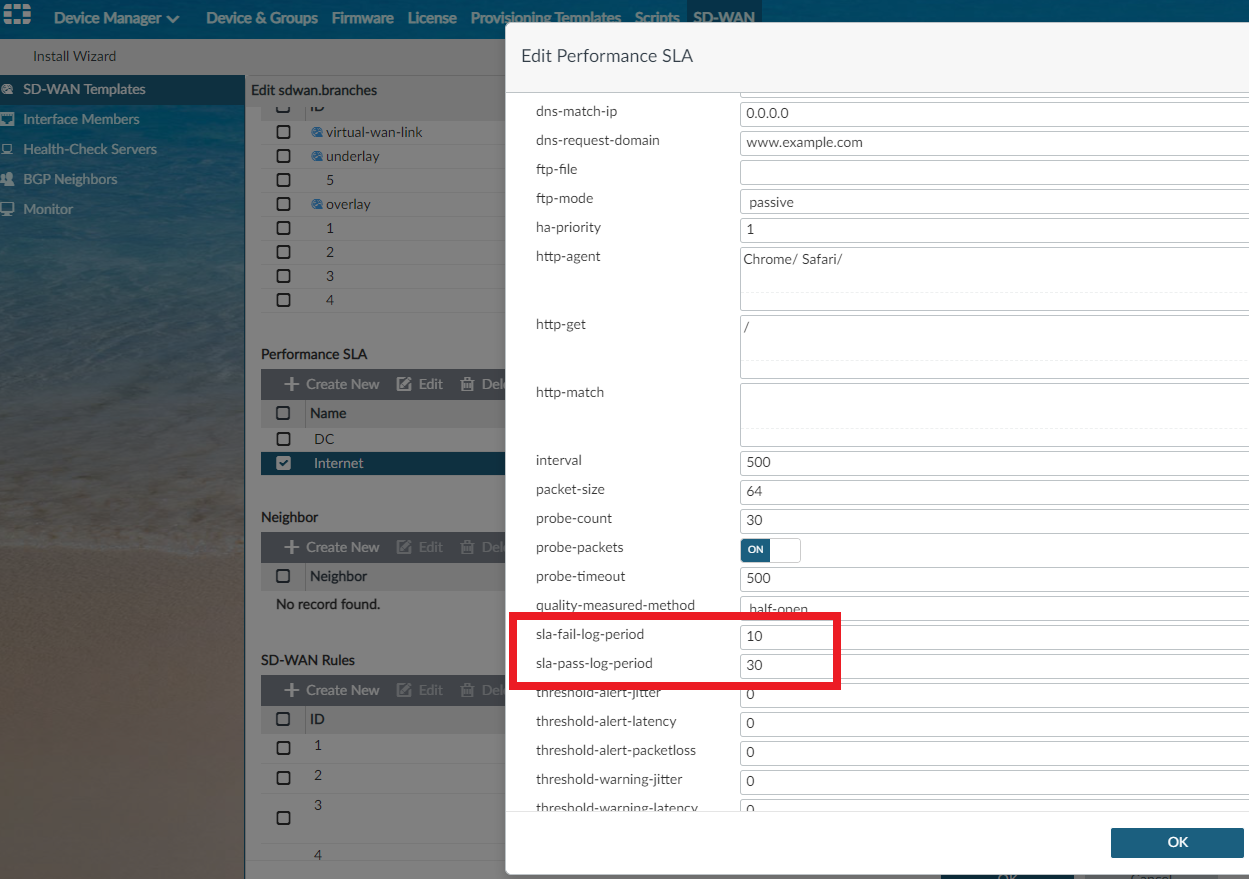
FortiAnalyzer requires logs from the branch FortiGate with latency, jitter, and packet loss information to create and display SD-WAN graphs. It is mandatory to specify the sending interval, which is configured in the FortiManager SD-WAN template. The sending interval is configured using set-fail-log-period (seconds) and set-pass-log-period (seconds). The below example shows that the value is set to 30 seconds for passing probes and 10 seconds for failing probes. This means that when the SLA is above target (pass), FortiGate will send a log every 30 seconds with information on pass SLA. When the SLA is below target (fail), FortiGate will send a log every 10 seconds, with information on fail SLA.
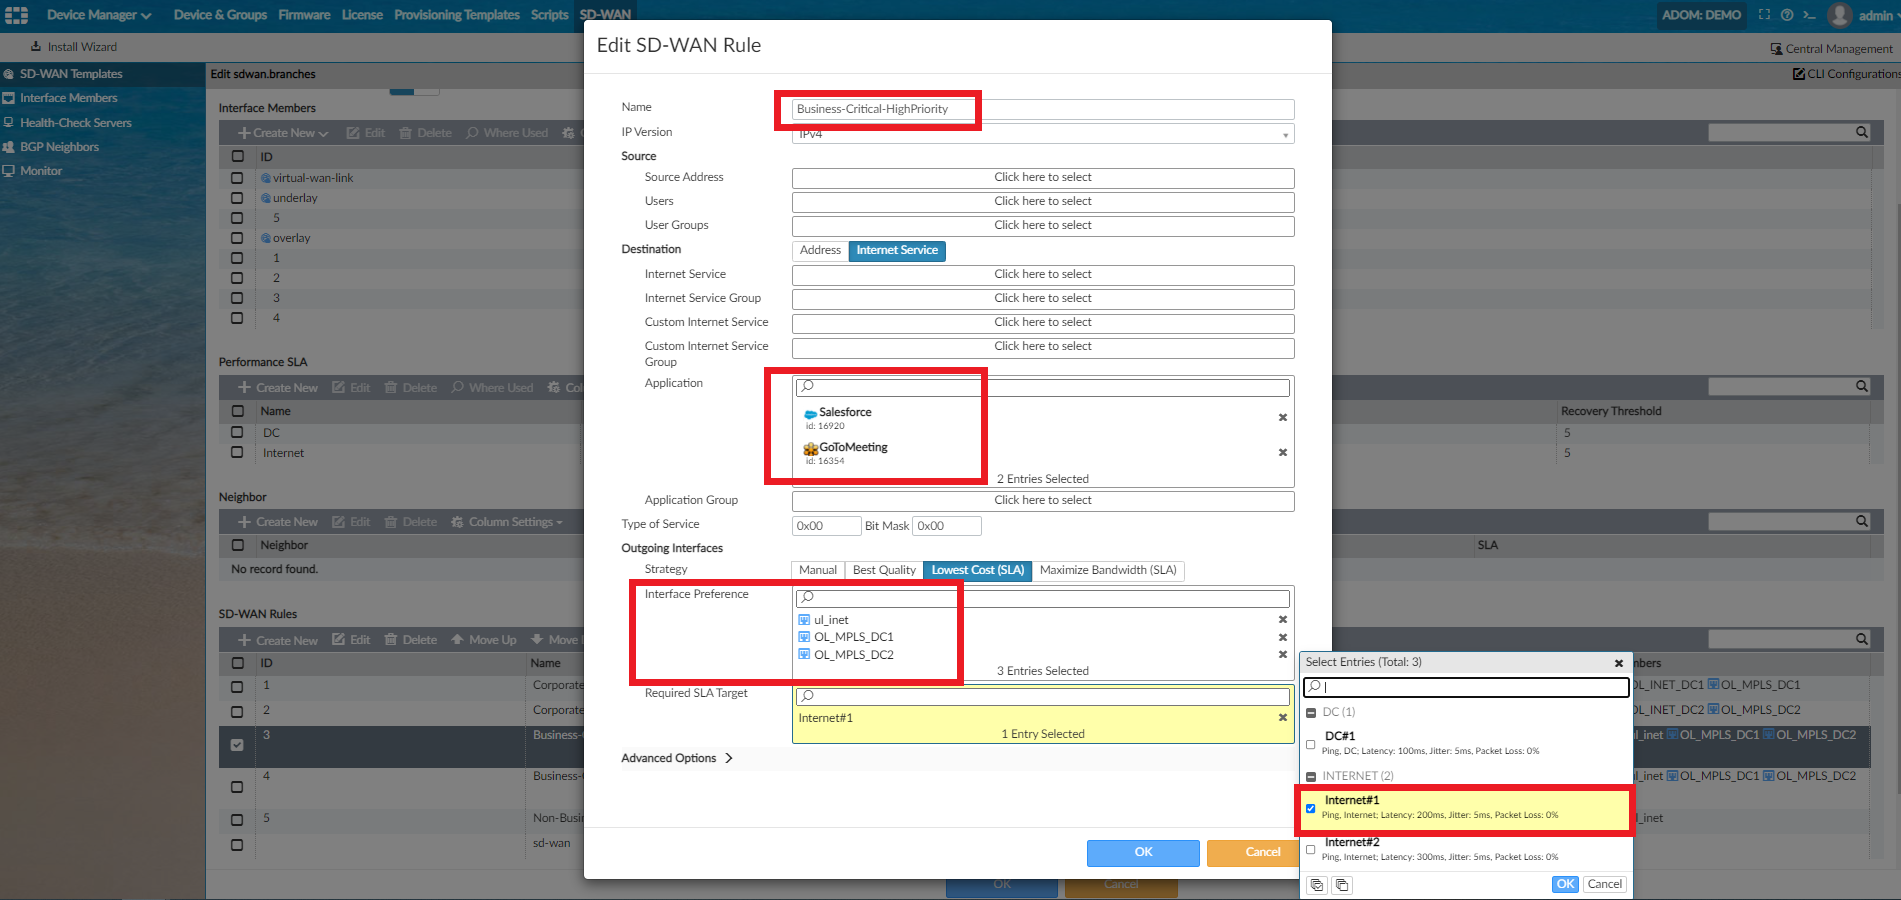
In the next example below, SD-WAN rule Business_Critical-HighPriority uses the SLA Internet#1, which has 200ms latency and 5ms jitter set as thresholds. This means that a probe (a ping, DNS, HTTP, or others) is being sent at a specified time period, every 500ms being the default, across SD-WAN member interfaces listed in the SD-WAN rule. Traffic matching GoToMeeting and Salesforce are being sent via the native direct internet access (DIA) interface, called ul_inet, as a priority before trying the two overlay links over MPLS, which will break out centrally should the DIA either fail or hit a brownout.
The default SD-WAN interface selection method for the SD-WAN criteria Lowest Cost SLA, where cost is not defined on the member interfaces, is always top-down. Therefore, this rule will try OL_MPLS_DC1 first (if currently within SLA) should the native ul_inet interface be in a brownout state, and then OL_MPLS_DC2, but only if both ul_inet and OL_MPLS_DC1 are still out of SLA.
Let's look at how the various logs sent from FortiGate to FortiAnalyzer look from the CLI.
When a performance SLA detects a link failure, it will record a log:
date=2021-02-18 time=09:38:41 id=6930520380335456274 itime=2021-02-18 09:38:41 euid=3 epid=3 dsteuid=3 dstepid=3 logid=0100022921 type=event subtype=system level=critical msg=Static route on interface BBI may be removed by health-check nonBC_streaming. Route: (82.197.160.199->52.213.155.117 ping-down) (82.197.160.199->172.217.168.14 ping-down)
When health-check detects a recovery, it will record a log:
date=2021-02-18 time=09:38:50 id=6930520427580096515 itime=2021-02-18 09:38:52 euid=3 epid=3 dsteuid=3 dstepid=3 logid=0100022921 type=event subtype=system level=critical msg=Static route on interface BBI may be added by health-check nonBC_streaming. Route: (82.197.160.199->52.213.155.117 ping-down) (82.197.160.199->172.217.168.14 ping-up)
When health-check has an SLA target, and detects SLA changes, and changes to fail:
date=2020-04-11 time=11:48:39 logid=" 0113022923 " type=“event” subtype=“sdwan” level=“notice” vd=“root” eventtime=1555008519816639290 logdesc=“Virtual WAN Link status” msg=“SD-WAN Health Check(ping) SLA(1): number of pass members changes from 2 to 1.”
When health-check has an SLA target, and detects SLA changes, and changes to pass:
date=2020-04-11 time=11:49:46 logid=" 0113022923 " type=“event” subtype=“sdwan” level=“notice” vd=“root” eventtime=1555008586149038471 logdesc=“Virtual WAN Link status” msg="SD-WAN Health Check(ping) SLA(1): number of pass members changes from 1 to 2.
Now let’s look at where logs are displayed in FortiAnalyzer, and how they are used in the various monitors.
Navigating to the FortiAnalyzer > Log View > Event-SD-WAN, we can see the logs being received across all overlays for all managed devices within the FortiAnalyzer ADOM named DEMO. This provides a wealth of detail on performance.
OL_MPLS_21 overlay is highlighted in the below image. It shows jitter/latency/packet loss, together with additional log details on the right.

These logs are then used to populate the following displays within the FortiView > SD-WAN monitor section:
- SD-WAN Rule Utilization: SD-WAN rule traffic utilization by interface and application
- SD-WAN Performance Status: performance of the SD-WAN and each WAN link in the network over time
- Jitter: number of seconds for disruption in the data flow across the network for each WAN link over time
- Latency: number of seconds for a packet of data to travel across the network for each WAN link over time
- Packet Loss: the percentage of network data that failed to reach its intended destination for each WAN link over time
- Bandwidth Utilization by SD-WAN Rules: share of bandwidth utilization for each configured SD-WAN rule
- SD-WAN High and Critical Events: existing alarms on a path, connection, or individual WAN links for their states (Information, Notice, and Warning)
- SD-WAN Utilization by Application: the share of bandwidth utilization by application for each WAN link
- SD-WAN Rules Utilization: SD-WAN rules traffic utilization by interface and application

FortiAnalyzer provides a comprehensive SD-WAN reporting section. All the reports are fully customizable to meet both MSP and end-customer branding. The below image shows some of the reports included in FortiAnalyzer and one page of the SD-WAN report as an example.
