


FortiAnalyzer Configurations
Part 1: FortiAnalyzer Port Configuration
Part 2: FortiAnalyzer System Configuration
Part 3: Configure FortiAnalyzer on FortiGate
Part 1: FortiAnalyzer Port Configuration
This section is to provide a public IPv4 address for FortiAnalyzer and make sure the IP address with the following ports can be accessed from the external network.
| Protocols | TCP Port |
|---|---|
| HTTP | 80 |
| HTTPS | 443 |
- In FortiAnalyzer, go to System Settings > Network, select the interface.
- Then click Edit to edit the network interface.
- Enable HTTPS or HTTP in Administrative Access. (The network connection will be tested in FortiCASB Configuration)


Part 2: FortiAnalyzer System Configuration
- Finish all parts 1-3 in the FortiGate Configuration.
- Go to FortiAnalyzer > System Settings, click on Administrators, select the user to be connected to FortiCASB and press Edit.
- Click Admin Profile drop down menu and select "Standard_User" or "Super_User".
- Click JSON API Access drop down menu and select "Read-Write".
-
Use the following CLI commands to add RPC-permit's read and write permissions to the user:
config system admin useredit "user"(The FortiAnalyzer user that will be used to connect to FortiCASB.)set rpc-permit read-write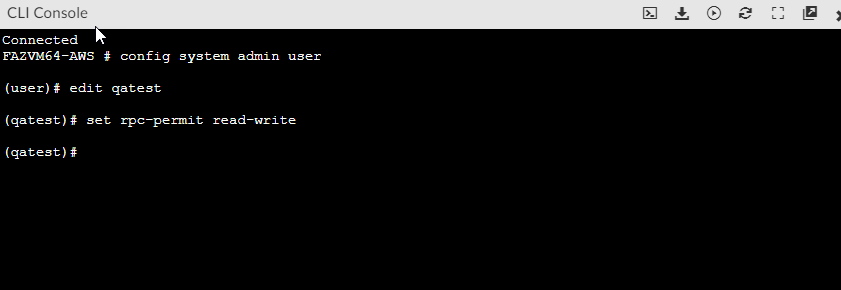


Part 3: Configure FortiAnalyzer on FortiGate
- Go to FortiGate and open CLI, then enter the following command:
- Go to FortiAnalyzer > Device & Groups.
- Look for the unauthorized FortiGate device and authorize it.
- Go to back to FortiGate then execute the following command to test the connection.
- If the connection is successful, FortiGate will return the following:
#config log fortianalyzer2 setting
#set status enable
#set server <FortiAnalyzor server IP>
#set enc-algorithm high-medium
#set upload-option realtime
#set reliable enable
#end

#execute log fortianalyzer test-connectivity 2
Registration: registered
Connection: allow
The entire CLI output should look like below:
FGVM04TMXXXXXX # execute log fortianalyzer test-connectivity 2
FortiAnalyzer Host Name: FAZAWS
FortiAnalyzer Adom Name: root
FortiGate Device ID: FGVM04TMXXXXXX
Registration: registered
Connection: allow
Adom Disk Space (Used/Allocated): 3921305424B/53687091200B
Analytics Usage (Used/Allocated): 790079985B/37580963840B
Analytics Usage (Data Policy Days Actual/Configured): 32/60 Days
Archive Usage (Used/Allocated): 3131225439B/16106127360B
Archive Usage (Data Policy Days Actual/Configured): 55/365 Days
Log: Tx & Rx (6 logs received since 15:21:34 08/29/23)
IPS Packet Log: Tx & Rx
Content Archive: Tx & Rx
Quarantine: Tx & Rx
Certificate of Fortianalyzer valid and serial number is: FAZ-VMTMXXXXXX