SD-WAN
The SD-WAN page provides metric information for the FortiGate devices based on the SD-WAN Interfaces in the system. It provides a visual overview of network performance, application usage, and traffic distribution.
|
|
To ensure the charts display accurate values, configure the necessary prerequisites and consider the recommendations provided. If the prerequisites are not configured, both the SD-WAN dashboard and Forecast will appear empty. For more information, see SD-WAN. |
The following charts are available on the SD-WAN page:
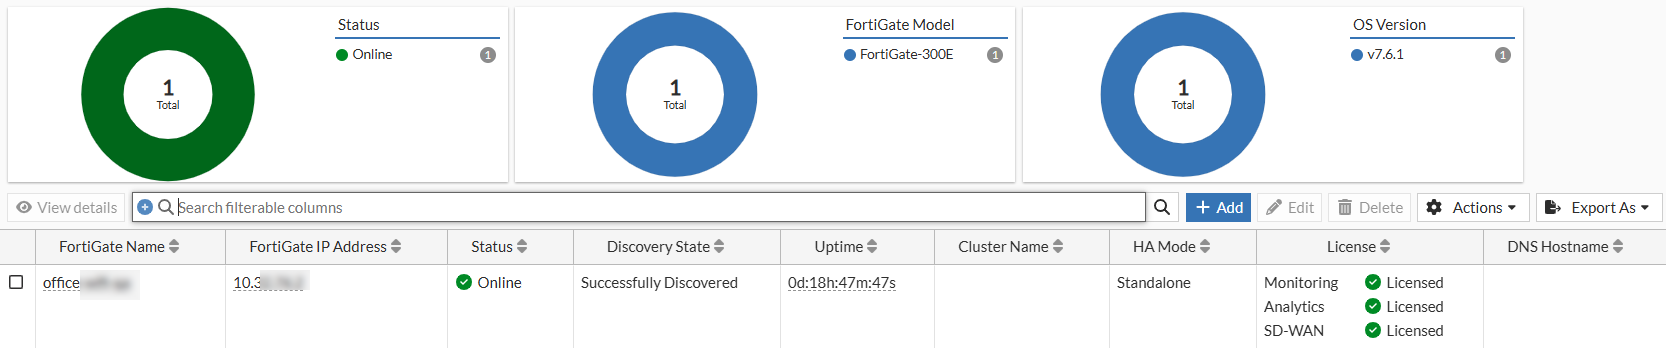
FortiGates
This chart displays the total number of FortiGate controllers in your network and their status (Online/Offline).
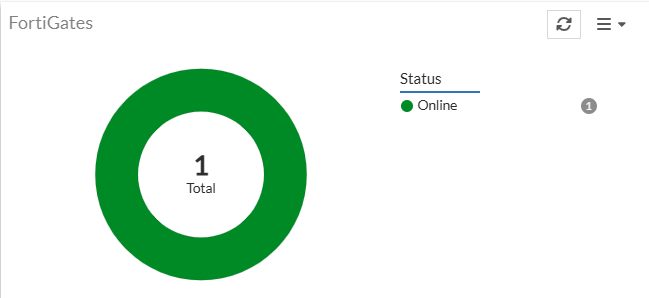
Click the widget to view more details of the FortiGate controllers.
For more information, see Managing FortiGates.
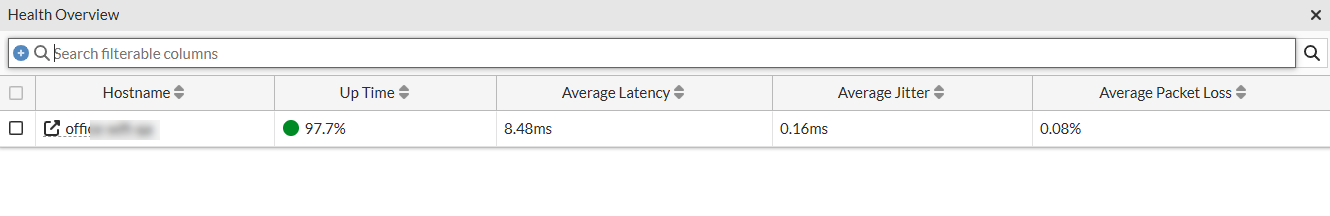
SD-WAN Health Overview
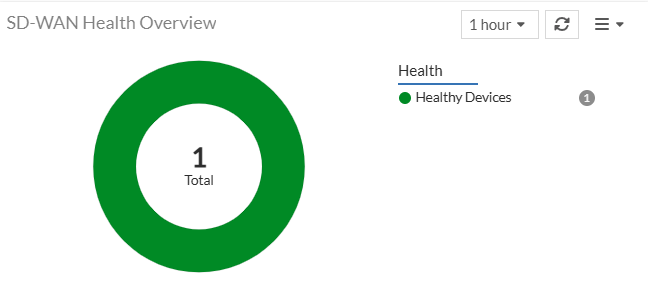
This chart summarizes the health status of FortiGates based on the health results of health checks configured for each interface. Depending on the health check uptime, FortiGates are classified as Critical, Major, or Healthy:
-
Healthy Devices – Indicates the number of devices where there is no health check failure observed over the selected duration (Overall Health Check status is 95% to 100% for the given FortiGate device).
-
Major Alerts Devices - Indicates the number of devices where there were health check failure observed over the selected duration (Overall Health Check status is 50% to 95% for the given FortiGate device).
-
Critical Alert Devices - Indicates the number of devices where there were health check failure observed over the selected duration (Overall Health Check status is 0% to 50% for the given FortiGate device).
Clicking on each value displays a detailed table with information such as the hostname, up time, average latency, average jitter, and average packet loss.
Clicking on a FortiGate name redirects to the Insights page, which displays various SD-WAN Insights for the associated interfaces. These insights are derived from the performance of configured health checks and include metrics such as bandwidth usage, SD-WAN rule utilization, application usage, and performance indicators like latency, jitter, and packet loss.
SD-WAN Events
This chart displays the number of SD-WAN events across various severity levels within a specified time frame.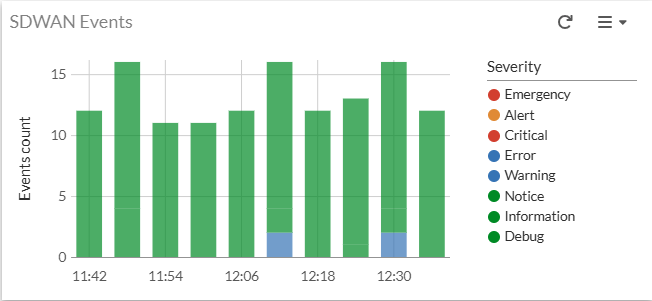
Click an event on the chart to view a detailed SD-WAN Events table, including time, severity, log description, message, log ID, FortiGate serial number, hostname, interface, health check, and VDOM.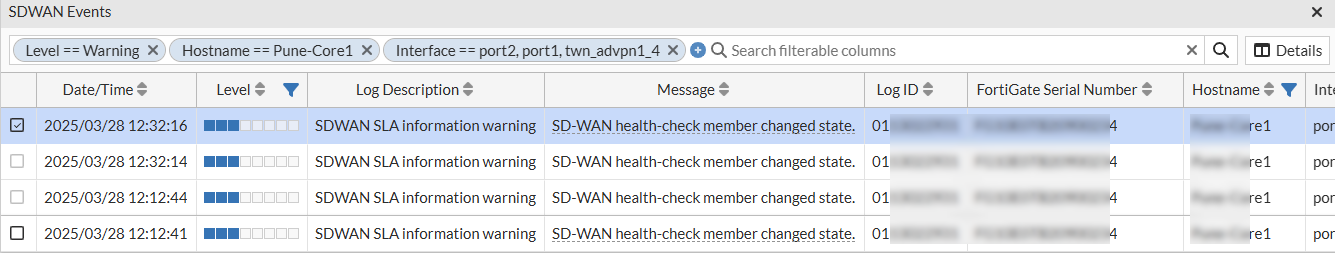
Double-click a row in the detailed table to view further details.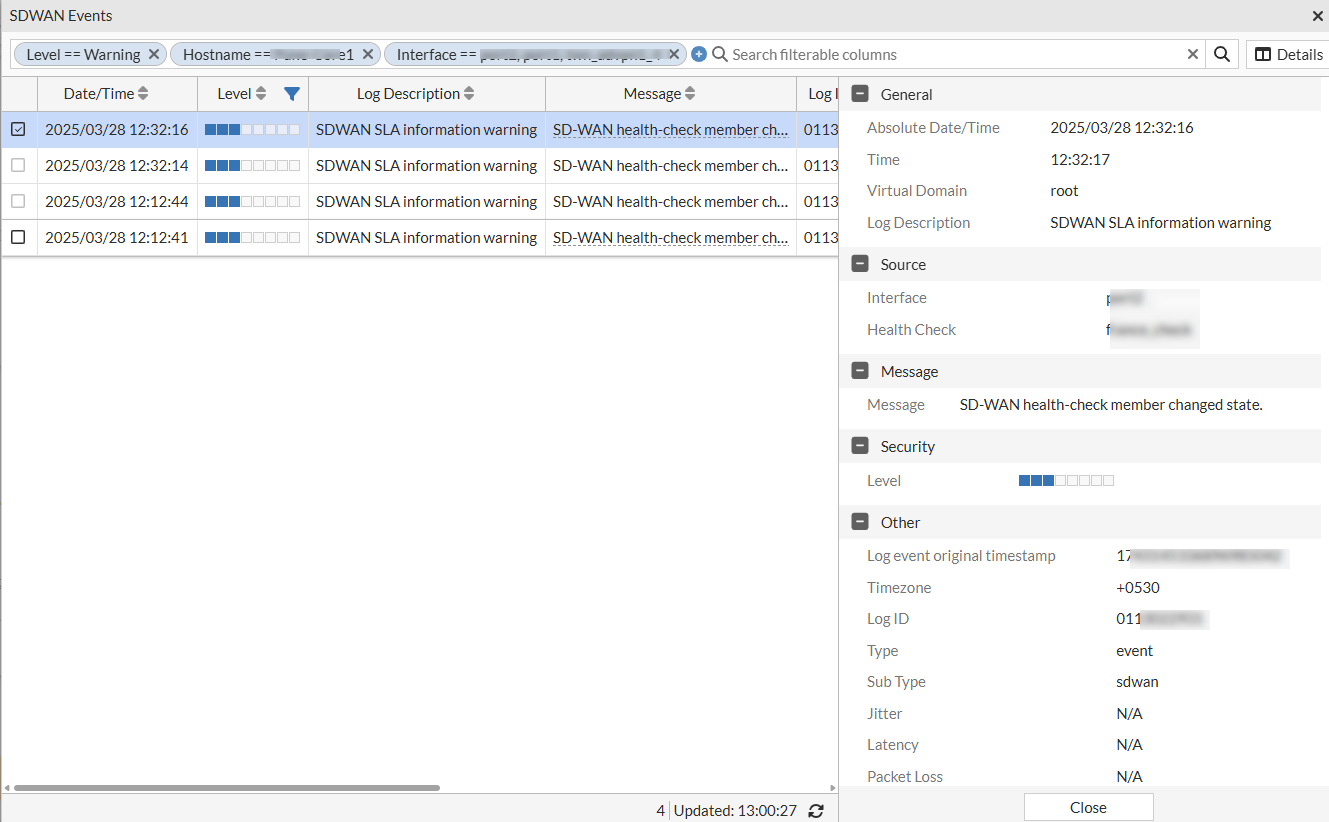
SD-WAN Insights
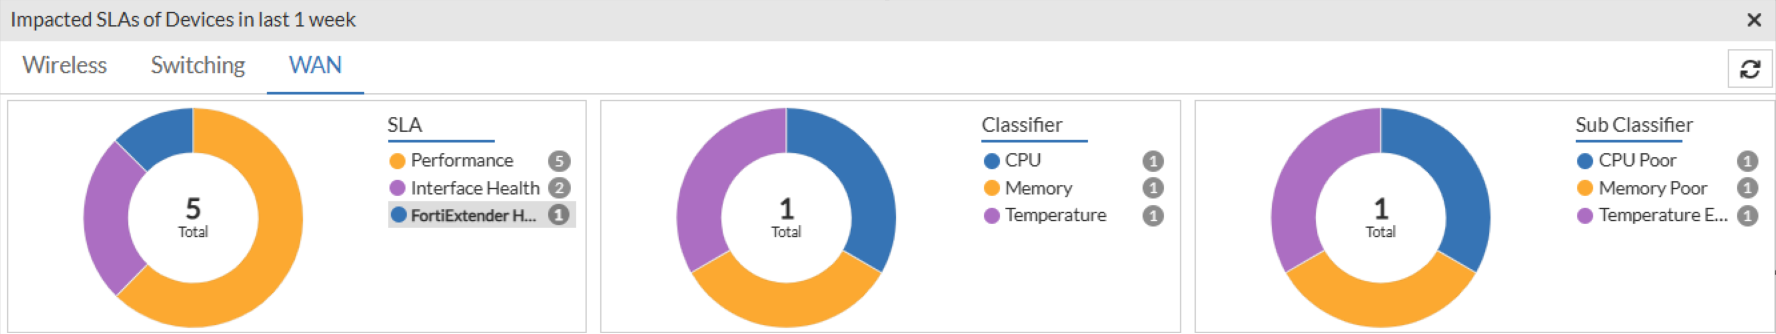
The SD-WAN panel presents Performance SLA and Interface Health failures for monitored SD-WAN members, including detected issues related to FortiExtender health. It also highlights the affected clients on impacted SD-WAN interfaces. Within each SLA panel, you can select Clients to view the number of impacted clients or choose Devices to see the count of affected interfaces.
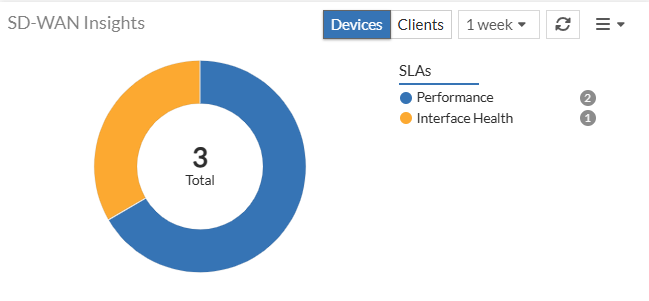
Note: Devices option is selected by default.
You can click on the impacted SLA listed in the panel to view the Performance, Interface Health or FortiExtender Health impacted interface and client details. The issues reported are categorized based on classifiers and sub-classifiers, with suggested remedial measures. The data displayed in this panel is for the time period set in the dashboard.
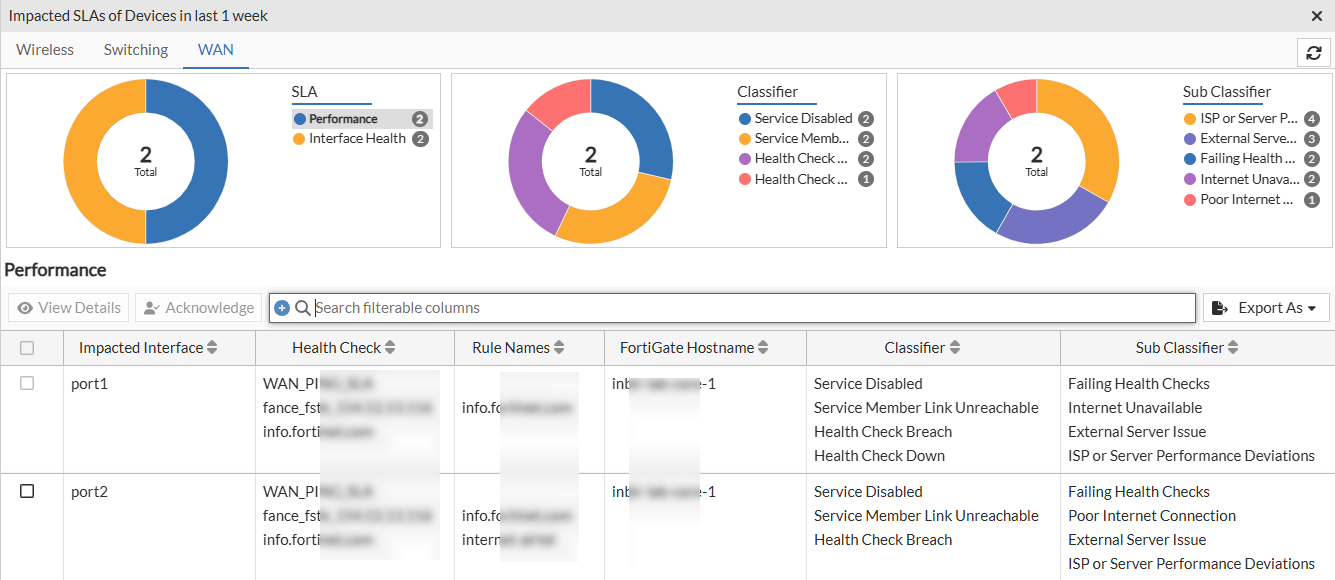
Performance SLA
FortiAIOps continuously monitors network performance using Performance SLA to measure key metrics such as latency, jitter, and packet loss. This helps assess the quality of network links, detect Performance SLA configuration issues, and track SD-WAN rule-based failures, reporting SLA breaches when forecasted thresholds are exceeded. By monitoring all health checks on FortiGate devices, FortiAIOps leverages real-time and historical trends to forecast future network performance, enabling proactive optimization.
|
|
It is recommended to retain the default configurations for Link Status configuration in FortiGate monitored Performance SLAs. Aggressively configured values may lead to the generation of excessive failure alerts. |
If you select the Devices view in the SD-WAN panel and click on the Performance SLA in the impacted SLAs list or click on the bar in the chart, the impacted interfaces' details such as, destination interface, the associated FortiGate host name, IP address, and serial number, FortiSwitch serial number, and classifier and sub-classifier are displayed.
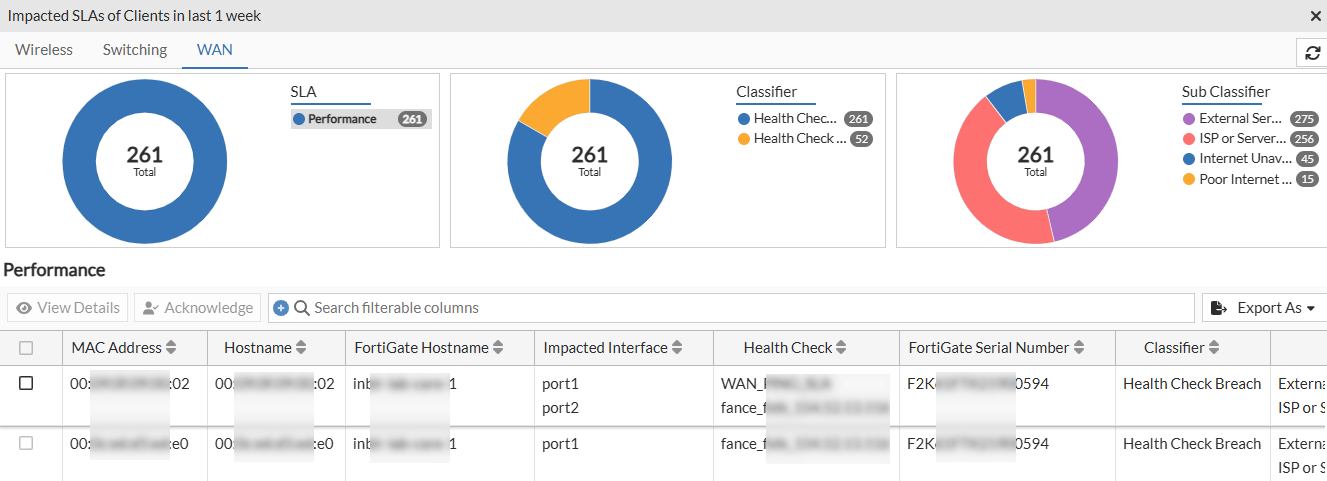
If you select the Clients view in the SD-WAN panel and click on the Performance SLA in the impacted SLAs list or click on the bar in the chart, the impacted client details, such as, MAC address, the AP name and serial numbers, the associated FortiGate hostname and serial number, FortiSwitch name and serial number, destination interface, and the classifier and sub-classifers are displayed.
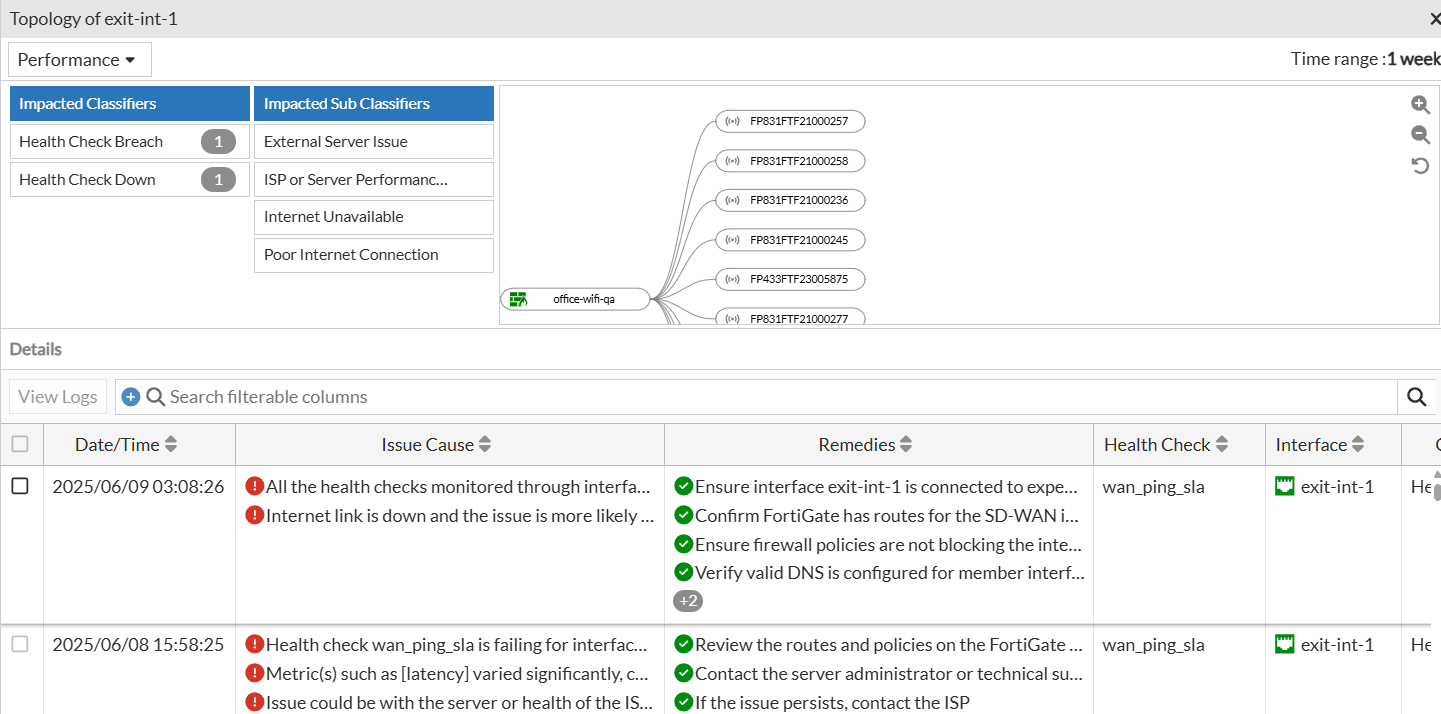
Select a row and click View Details. The Details table displays the following information.
Right-click on the header of the table to select the columns that you wish to view.
|
Attribute |
Description |
|---|---|
| Date/Time | The date and time of the impact as per your timezone. |
| Issue Cause List | The detailed causes of the SLA breach that impacted the client/AP/FortiGate. |
| Remedies | The suggested remedies to resolve the issue. |
|
Health Check |
The performance SLA check configured in FortiGate. |
| Interface | The interface name for the reported issue. |
| Classifier | The classifier of the issue reported for the SLA. |
| Sub Classifier | The sub-classifier of the issue for the reported classifier. |
|
Jitter |
The amount of jitter (milliseconds) reported for the client. |
|
Packet Loss |
The percentage of packet loss reported for the client. |
|
Latency |
The amount of latency (milliseconds) reported for the client. |
|
End Timestamp |
End time of the impact based on your timezone. |
|
FortiGate Hostname |
The hostname of the FortiGate associated with the AP/impacted client. |
|
FortiGate Serial Number |
The serial number of the associated FortiGate. |
|
Jitter Dynamic Threshold |
Dynamically calculated jitter value based on historical values. |
|
Jitter Max Threshold |
Dynamically calculated maximum variation observed in Jitter for the Health check. |
|
Jitter Static Threshold |
Jitter SLA target configured in Performance SLA or FortiAIOps Default target. |
|
Latency Dynamic Threshold |
Dynamically calculated Latency value based on historical values. |
|
Latency Max Threshold |
Dynamically calculated maximum variation observed in Latency for the Health check. |
|
Latency Static Threshold |
Latency SLA target configured in Performance SLA or FortiAIOps Default target. |
|
Packet Dynamic Threshold |
Dynamically calculated Packet loss value based on historical values. |
|
Packet Max Threshold |
Dynamically calculated maximum variation observed in Packet loss for the Health check. |
|
Packet Static Threshold |
Packet loss SLA target configured in Performance SLA or FortiAIOps Default target. |
|
Rule Name |
The name of the rule to track the interface failure. |
|
Status |
Status of the interface. |
Select a row from the table and click View Logs to view further details.
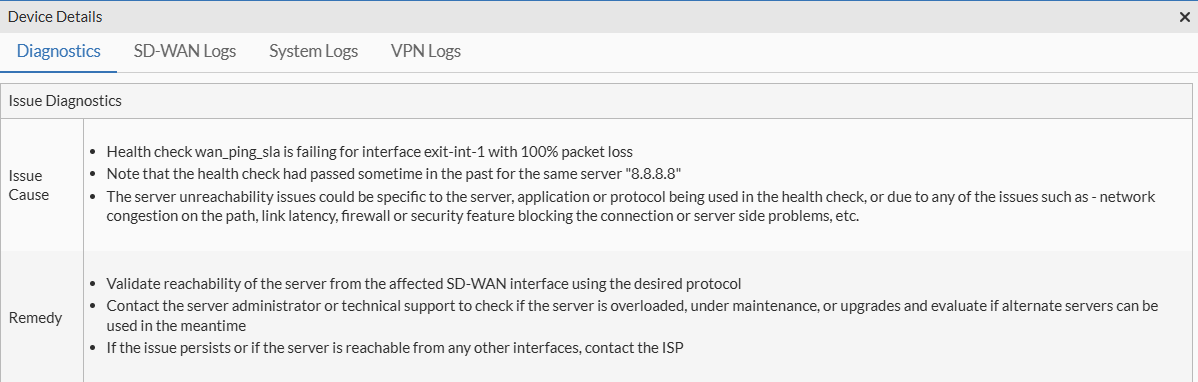
The Diagnostics tab details identified issues and provides steps for rectification. For more in-depth logs, navigate to the SD-WAN Logs, System Logs, or VPN Logs tabs.
Interface Health SLA
Interface Health SLA in FortiAIOps focuses on monitoring the stability and reliability of both underlay and overlay network links. It detects link status changes and interface flaps to ensure consistent network performance. Additionally, FortiAIOps evaluates the interface selection strategies defined in SD-WAN rules, helping to identify the most efficient path for traffic. This ensures seamless connectivity and aids in optimizing SD-WAN configurations for maximum performance and reliability.
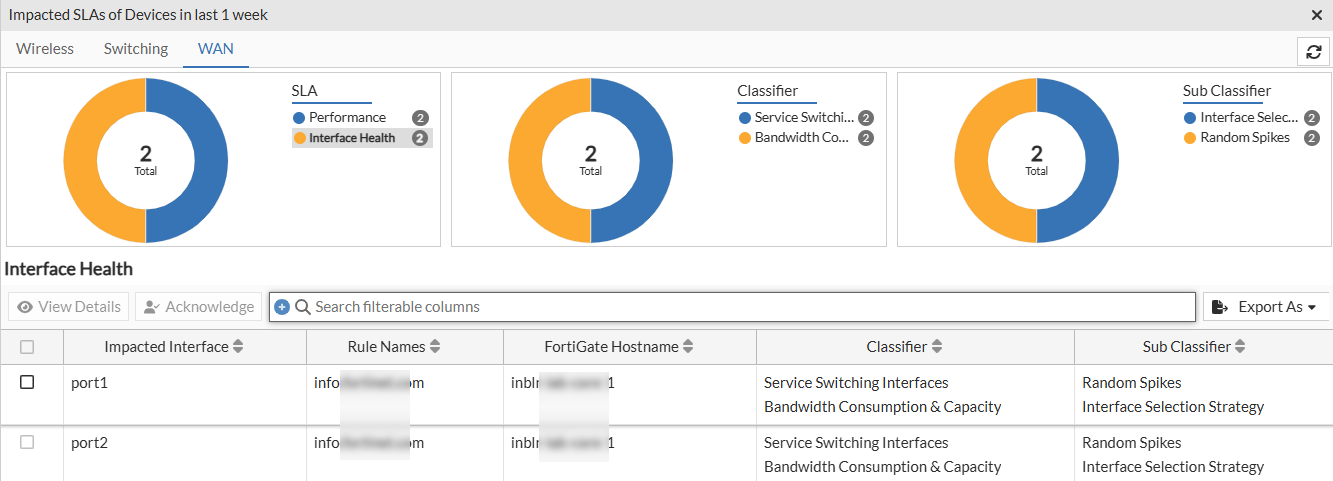
The Interface Health table displays information such as Impacted Interface, Rule Names, FortiGate Hostname, Classifier, Sub Classifier, AP List, FortiExtender Name, FortiExtender Serial, FortiGate IP Address, FortiGate Serial Number, FortiSwitch Serial Number, and Health Check.
To get detailed information, select the impacted interface and click View Details.
Right-click on the header of the table to select the columns that you wish to view.
|
Attribute |
Description |
|---|---|
| Date/Time | The date and time of the impact as per your timezone. |
| Issue Cause | The detailed causes of the SLA breach that impacted the client/AP/FortiGate. |
| Remedies | The suggested remedies to resolve the issue. |
| Classifier | The classifier of the issue reported for the SLA. |
| Sub Classifier | The sub-classifier of the issue for the reported classifier. |
|
End Timestamp |
End time of the impact based on your timezone. |
|
In Bandwidth |
Bandwidth of the incoming data. |
| Interface | The interface name for the reported issue. |
|
Out Bandwidth |
Bandwidth of the outgoing data. |
|
Rule Name |
The name of the rule to track the interface failure. |
|
Tunnel Interface |
Name of the tunnel interface. |
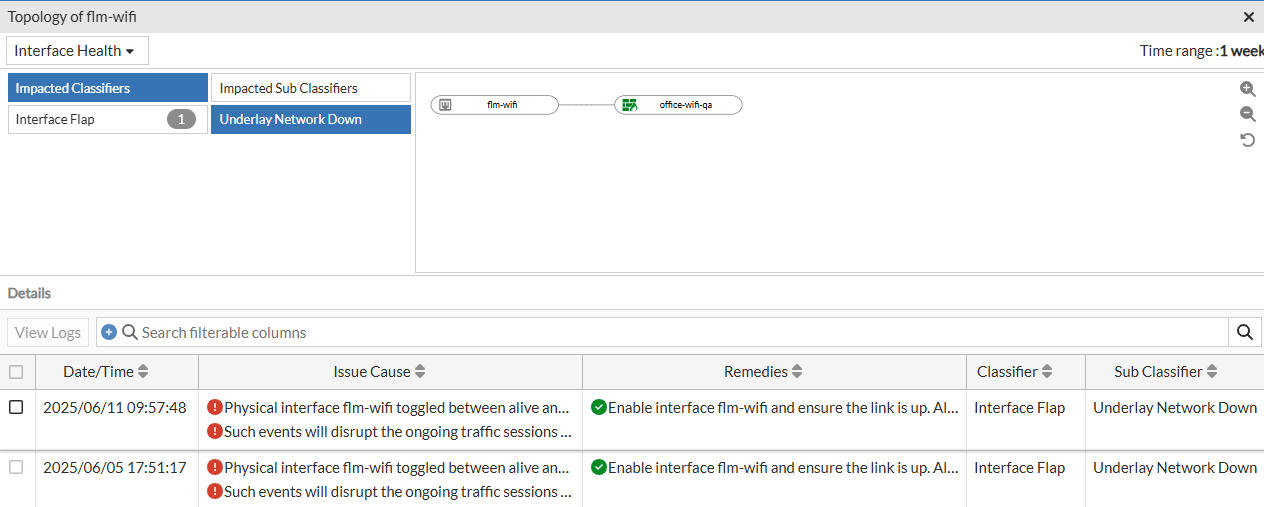
Select a row and click View Logs to view detailed logs for the issue.
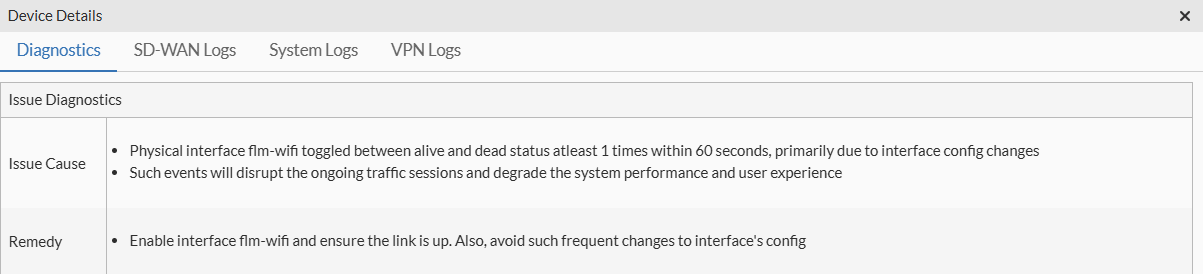
The Diagnostics tab details identified issues and provides steps for rectification. For more in-depth logs, navigate to the SD-WAN Logs, System Logs, or VPN Logs tabs.
FortiExtender Health SLA
If you select the Devices view in the SD-WAN panel and click on the FortiExtender Health SLA in the impacted SLAs list or click on the bar in the chart, the impacted interfaces' details such as, destination interface, AP serial number, the associated FortiGate host name, IP address, and serial number, FortiSwitch serial number, FortiExtender name and serial number, and classifier and sub-classifier are displayed.
If you select the Clients view in the SD-WAN panel and click on the FortiExtender Health SLA in the impacted SLAs list or click on the bar in the chart, the impacted client details, such as, MAC address, the AP name and serial number, the associated FortiGate hostname and serial number, FortiSwitch name and serial number, FortiExtender name and serial number, destination interface, and the classifier and sub-classifers are displayed.
Select a row and click View Details. The Details table displays the following information.
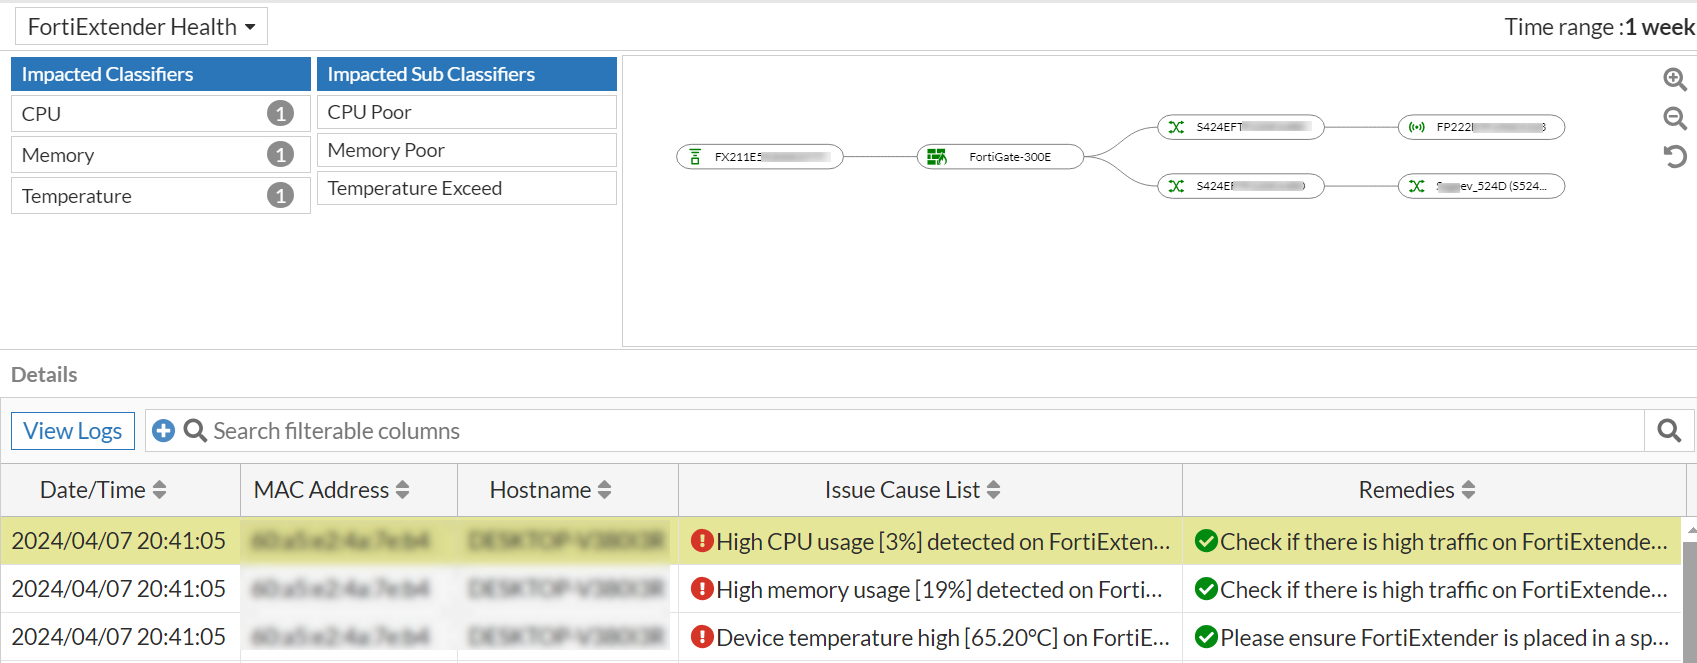
Right-click on the header of the table to select the following columns that you wish to view.
|
Attribute |
Description |
|---|---|
| Date/Time | The date and time of the impact as per your timezone. |
|
FortiGate Serial Number |
The serial number of the associated FortiGate. |
|
AP Serial |
The serial number of the associated AP. |
|
Access Point |
The name of the associated AP. |
| MAC Address | The MAC address of the impacted client device. |
| Hostname | The name of the device as configured by the user. If the name is not configured or available, then MAC address is displayed. |
| Issue Cause List | The detailed cause of the SLA breach that impacted the client/AP/FortiGate/FortiExtender. |
| Remedies | The suggested remedies to resolve the issue. |
| Classifier | The classifier of the issue reported for the SLA. |
| Sub Classifier | The sub-classifier of the issue for the reported classifier. |
|
Source and Destination Interface |
The SD-WAN interface name. |
| FortiSwitch Serial Number | The serial number of the impacted switch. |
| FortiSwitch Name | The name of the impacted switch. |
| FortiExtender Serial Number | The serial number of the impacted FortiExtender. |
| FortiExtender Name | The name of the impacted FortiExtender. |
|
FortiGate Hostname |
The hostname of the FortiGate with which the impacted FortiExtender is associated. |
| Client Type | The client type that is impacted, wireless or wired. |
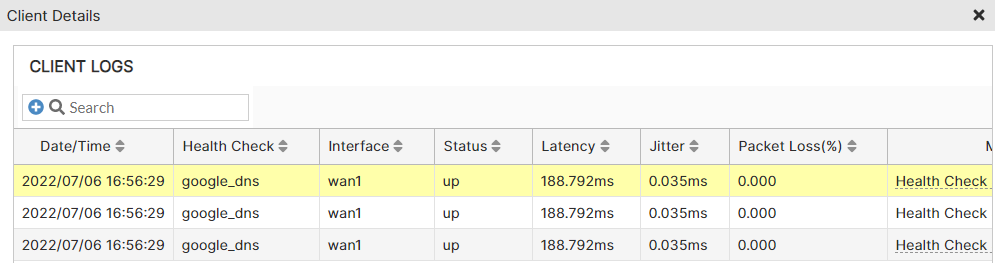
Select a particular client and click View Logs, to view the impacted client logs.
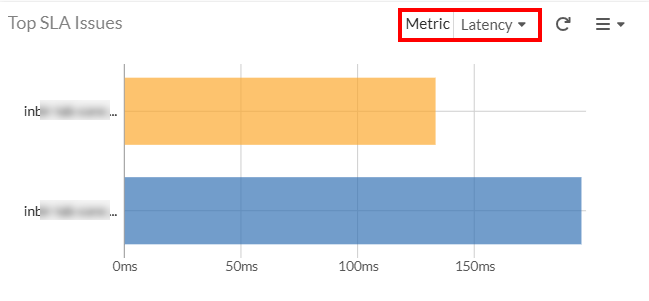
This chart displays the top 10 worst SD-WAN performance values for each metrics for Interfaces—Latency, Jitter, and Packet Loss for the selected time period.
You can select the SLA Performance Metrics from the Metric drop-down list.
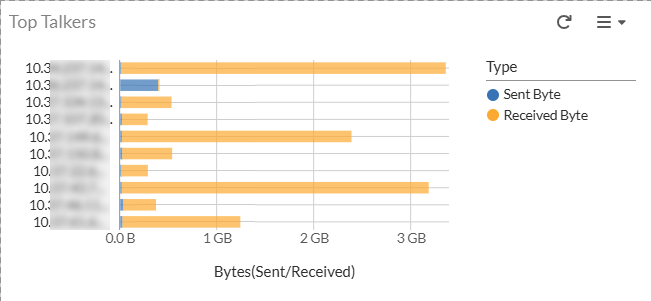
Top Talkers
This chart displays the sources which have top 10 bandwidth usage (bytes sent and bytes received) on the SD-WAN interfaces across the FortiGates within an ADOM. Clicking on each value opens the Top Talkers detailed chart with information such as FortiGate name, interface, application, sent byte, and received byte.
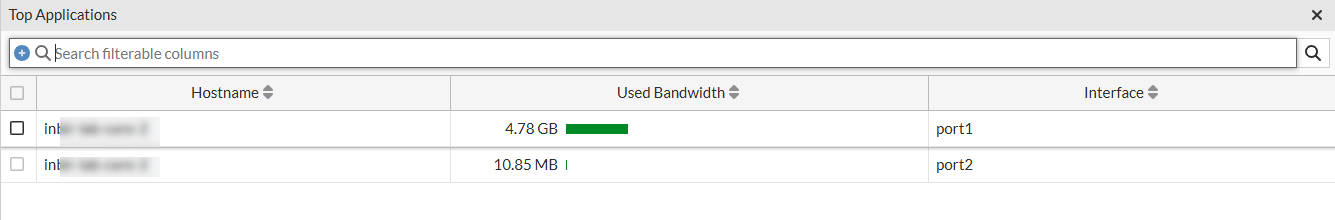
Top Applications
This chart displays the top 10 applications being used on the SD-WAN interfaces.
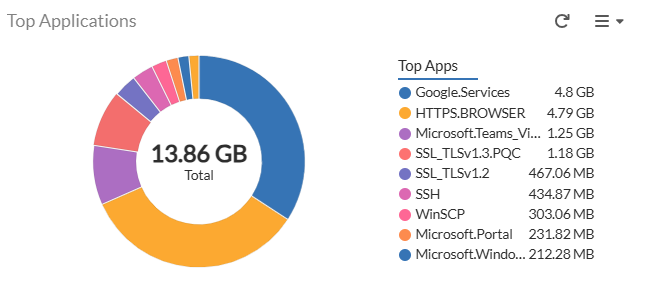
Hovering over each value displays the Application and Used Bandwidth.
Clicking on each value opens the Top Applications detailed chart for the application displaying the FortiGate name, used bandwidth, and the interface.
FortiExtenders
This chart displays the total number of FortiExtenders in your network and their status.
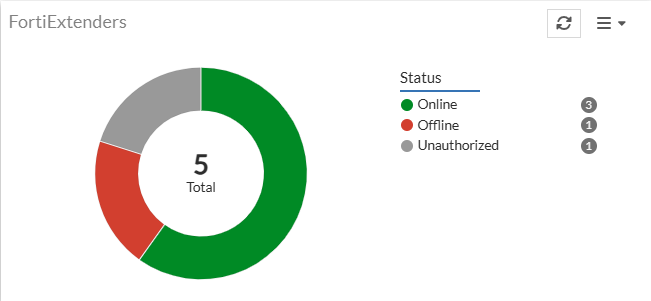
Click the chart to view more details of the FortiExtenders such as status, mode, and the firmware versions.
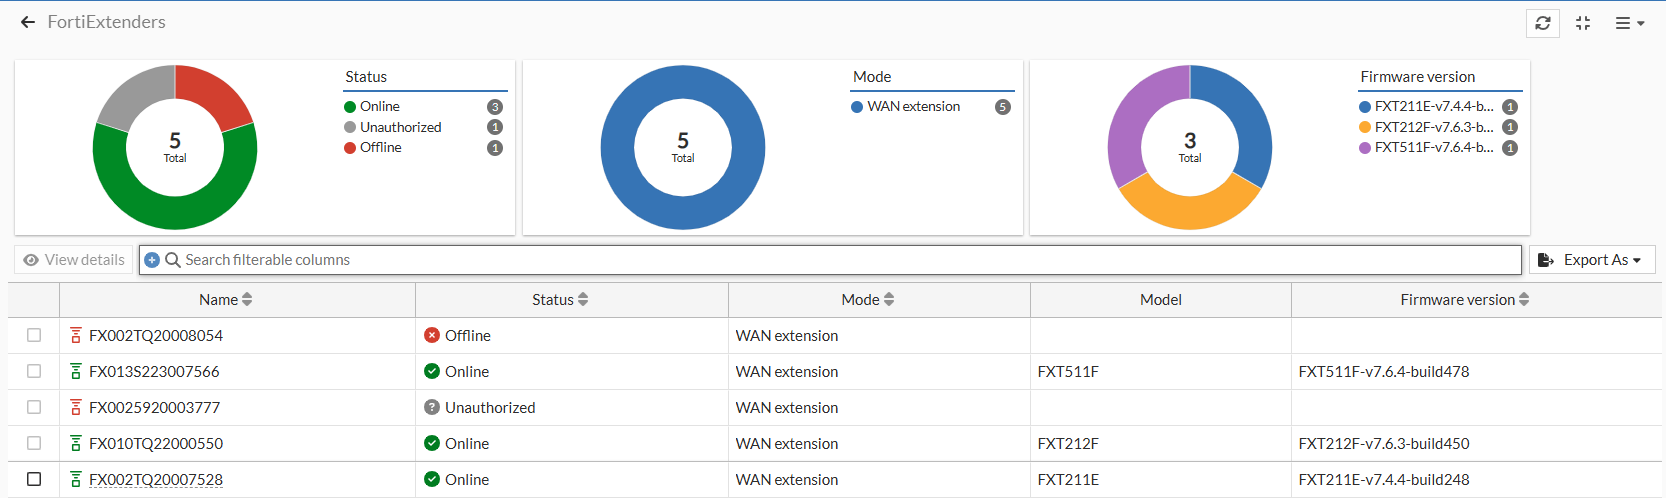
Select a FortiExtender device from the list and click View Details. The Diagnotics and Tools pane is displayed with more details. For more information, see Extenders.
FortiExtenders CPU Usage
The FortiExtenders CPU Usage chart displays the CPU usage of the FortiExtenders over a period of time.
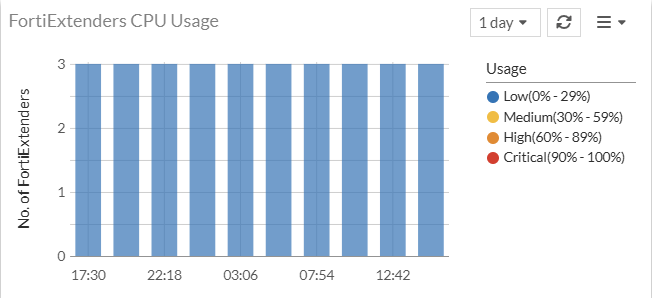
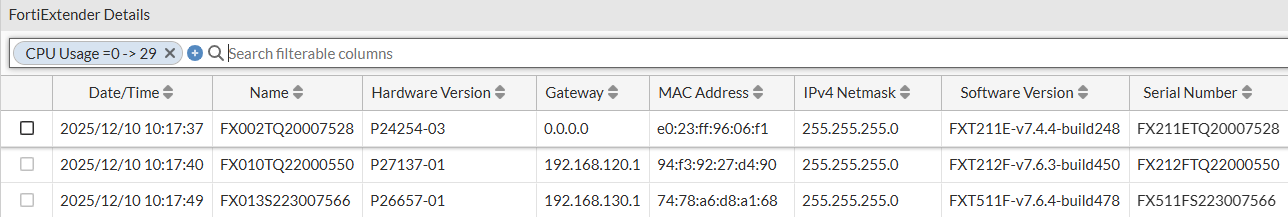
Click on a value on the chart to view more details on the FortiExtender Details pane.
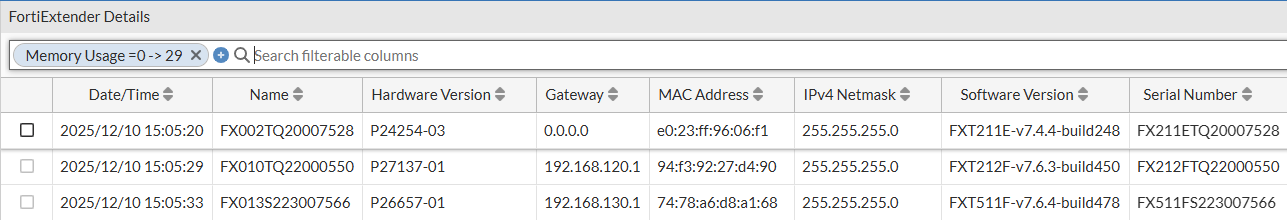
FortiExtenders Memory usage
The chart displays the memory usage of the FortiExtenders in your network over a period of time.
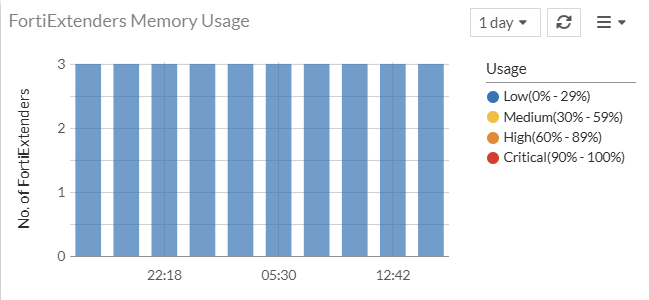
Click on a value on the chart to view more details on the FortiExtender Details pane.