FortiView Scanner Integration
Go to Dashboard > FortiView Scanner Integration. If it's not available in the Dashboard menu, refer to Monitors for how to add a monitor.
If you've configured FortiWeb to receive XML-format reports from third-party web vulnerability scanners, you can visualize the scanner reports here.
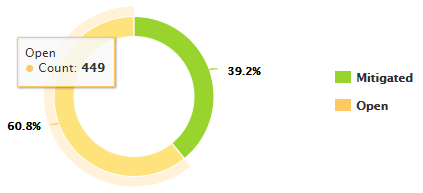
From this window, you can see a summary of mitigated and open threats from scanner reports:

In the top-right corner of the window, in the top menu bar, you can use the Vulnerability Status drop-down menu to view either Open or Mitigated threats. You can also use the Add Filter icon in the top menu bar to filter for the following information:
- Action
- Adom Name
- Date/Time
- File Name
- ID
- Profile Name
- Profile Type
- Rule Type
- Scanner Type
- Severity
- Vulnerability Name
Under the Summary Information, you can see the severity of Open and Mitigated threats that the vulnerability scans detect. Mouse over elements of the pie chart to learn more information:

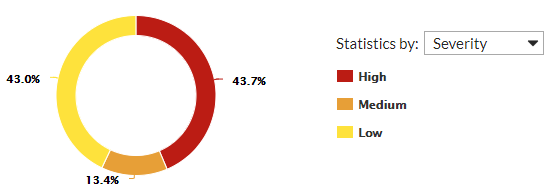
Click elements of the pie chart to drill down into them. When you click an element to drill down into it, use the Statistics by drop-down menu to view threats by:
- Severity
- Scanner Type

When viewing the pie chart by Severity or Scanner Type, click an element of the pie chart to drill down another level and view the proportion of specific types of vulnerabilities for that element:


