
Reports and scheduled delivery
There are predefined reports in FortiSOC to provide insights into Fortinet and third-party device activity, as well as case response operations.
Reports are available in three categories:
-
SOC Reports
-
Analyzer Reports
-
SIEM Reports
SOC reports display the data within the FortiSOC GUI, so you can use the report to navigate through the GUI and open object details for further information. These reports can also be exported according to your needs.
Analyzer and SIEM reports display data in HTML. Analyzer reports can also be viewed as PDF, XML, CSV, and JSON. Many predefined Analyzer and SIEM reports are available and can be managed in their respective modules (Analyzer and SIEM); however, only generated reports can be viewed from the FortiSOC Reports module. You can schedule reports from their respective modules, so the generated outputs are available in FortiSOC Reports when they are needed for other admins and analysts.
SOC Reports
This module includes predefined reports, which can be run on-demand or scheduled to run. These reports use all analytics data in FortiSOC. You can create or import new reports.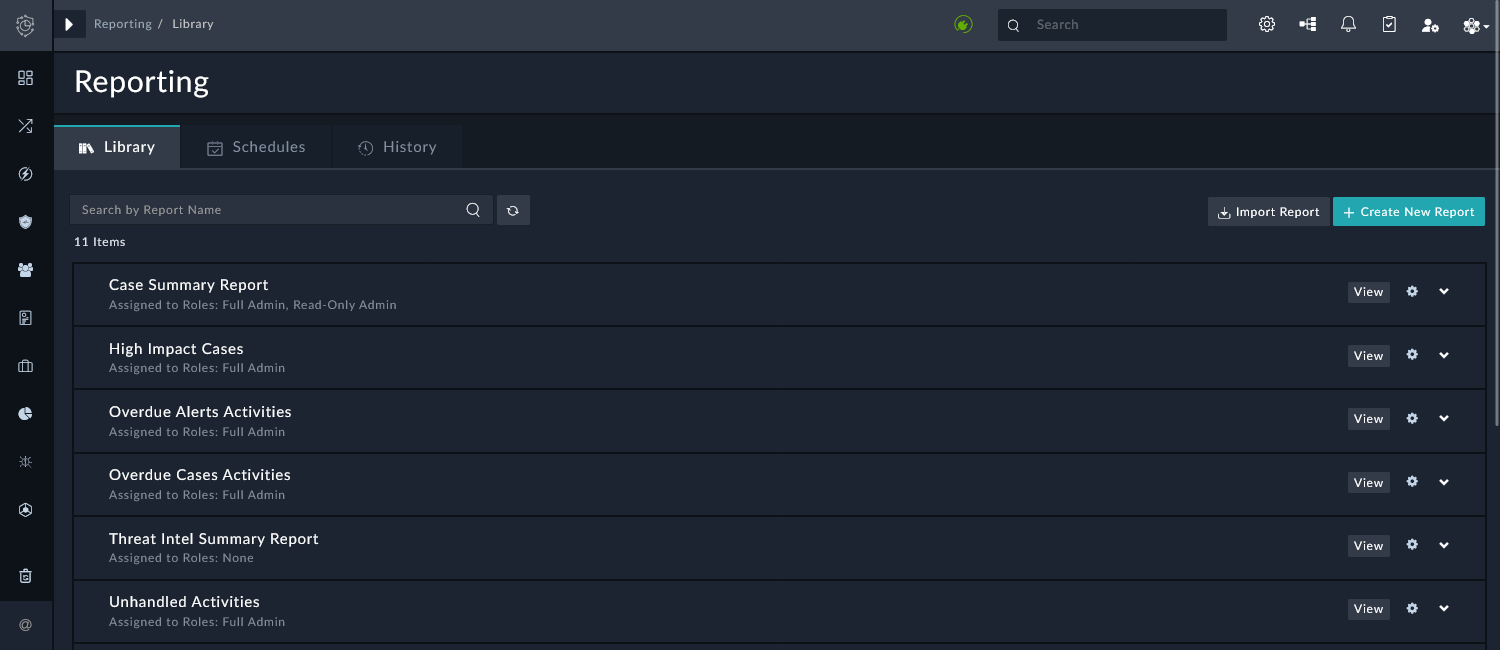
To view a SOC report, click View for the report in the list. You may be required to enter input variables, such as a date range, to view the report.
When viewing a SOC report, you can interact with the rows and widgets to navigate to related areas of the platform or to open related detail views. For example, if a widget displays a case count at a specified severity level, you can click the widget to open the Cases list filtered by that criteria. If a table includes a list of alerts, you can click an alert to open the Alert Details pane. You can also export the report as a PDF, if needed.
The following predefined reports are available for FortiSOC administrators.
|
SOC report |
Description |
|---|---|
|
Case Summary Report |
Displays a complete summary of the case, including case highlights, case timeline, and related records. Required input: Case ID. |
|
High Impact Cases |
Displays a summary of cases with Severity = High. Required input: Date range. |
|
Overdue Alerts Activities |
Displays open alerts with an overdue response due date. |
|
Overdue Cases Activities |
Displays open cases with an overdue response due date. |
|
Threat Intel Summary Report |
Displays a threat intelligence summary, including actor group analysis, impact analysis, next steps, and related feed records. |
|
Unhandled Activities |
Displays unassigned alerts and cases. |
|
War Room Summary |
Displays a summary of data from the war room. |
|
War Room Summary Report |
Displays performance metrics from the war room for related cases, alerts, indicators, and assets. |
|
Weekly Alert Report |
Displays a summary of alerts created in the past week. This includes number of alerts by type, assignment, and status as well as a list of the high severity open alerts. |
|
Weekly Case Report |
Displays a summary of cases created in the past week. This includes number of cases by type, assignment, and status as well as a list of the high severity open cases. |
|
Weekly IOC Report |
Displays a summary of indicators of compromise (IOCs) found in the past week. |
From the Settings icon for the SOC reports, you can perform the following actions:
|
Action |
Description |
|---|---|
|
Schedule Report |
Schedule the report to generate and send a notification to specified email address(es). |
|
Assign to Role |
Select the roles that will have access to the dashboard. Each report in the list displays the currently assigned roles. |
|
Edit Template |
Edit the report template. |
|
Clone Template |
Clone the report template. |
|
Export Template |
Export the report template on your machine in JSON format. You can click Import Report in the toolbar to import a report template in the appropriate JSON format. |
|
Remove Template |
Remove the report template. You will be asked to confirm the action. |
There is a Create New Report option in the toolbar. For information about creating a SOC Report, see Custom dashboards and reports.
Analyzer Reports
This module displays reports generated in the Analyzer module, including reports that were generated according to their schedule. These reports use only data from the Analyzer module.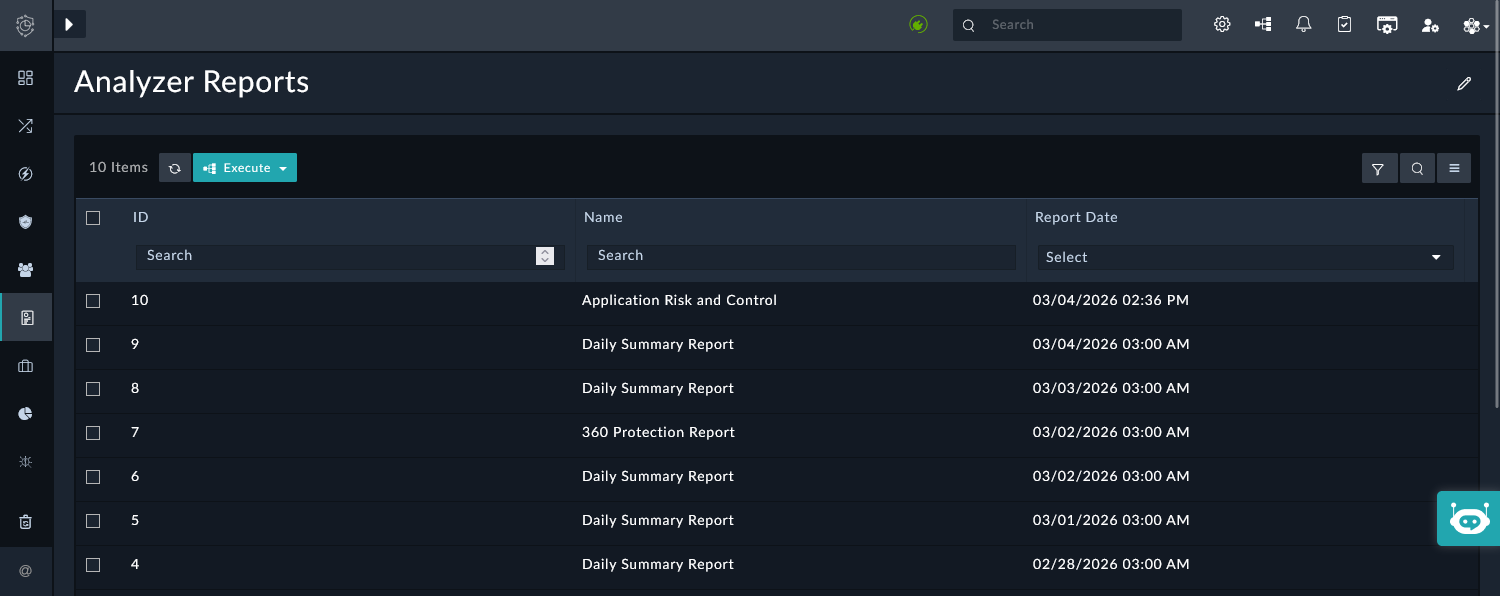
In Reports > Analyzer Reports, click Execute > Get FAZ Reports to fetch the reports that were generated in the Analyzer module.
Analyzer reports, including their schedules, can be managed in Analyzer > Settings > Report Definitions. In this pane, you can find all predefined reports and report templates that can be used for the Analyzer module.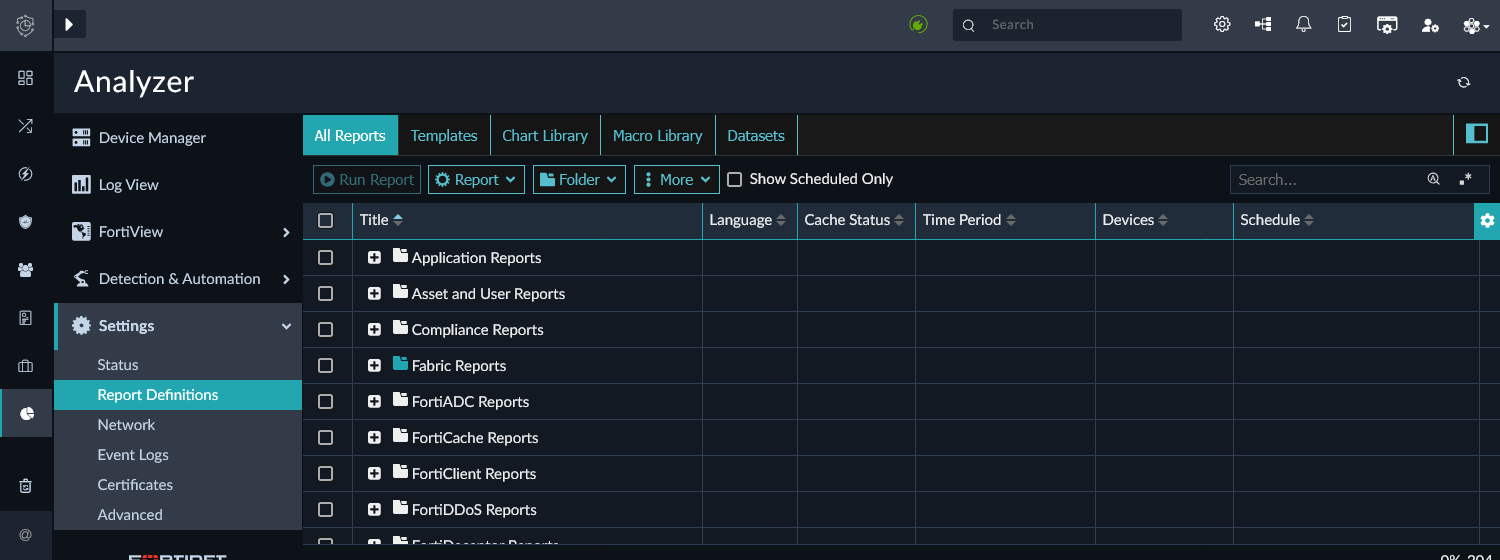
There are two predefined Analyzer reports that run on a schedule. Their generated outputs will appear in Reports > Analyzer Reports.
|
Analyzer report |
Description |
|---|---|
|
360 Protection Report |
Displays a summary of findings from the FortiGate devices over a 30 day period, together with recommendations and observations for follow up action where applicable. Schedule: Weekly on Monday at 03:00 AM. |
|
Daily Summary Report |
Displays the traffic usage, top applications by severity, top threats, and more according to the FortiGate devices. Schedule: Daily at 03:00 AM. |
To schedule an Analyzer report:
-
Go to Analyzer > Settings > Report Definitions > All Reports.
-
Double-click the report and go to the Settings tab.
-
Select the checkbox for Enable Schedule, and then configure the following options:
Option
Description
Generate Report Every
Select when the report is generated.
Enter a number for the frequency of the report based on the time period selected from the dropdown list.
Start Time
Enter a start date and time for the schedule.
End Time
Specify an end date and time for the report schedule, or set it to never ending (default).
-
Click Apply.
To manually generate a report from the Analyzer module:
-
Go to Analyzer > Settings > Report Definitions > All Reports.
-
Select the report and click Run Report.
You can double-click the report to view the status in the Generated Reports tab.
-
Once the report is generated, go to Reports > Analyzer Reports.
-
To include the newly generated report in the list, click Execute > Get FAZ Reports.
-
Double-click the record for the report to view it within the GUI. You can download the report as a PDF, XML, CSV, or JSON file.
SIEM Reports
This module displays reports generated in the SIEM module, including reports that were generated according to their schedule. These reports use only data from the SIEM module.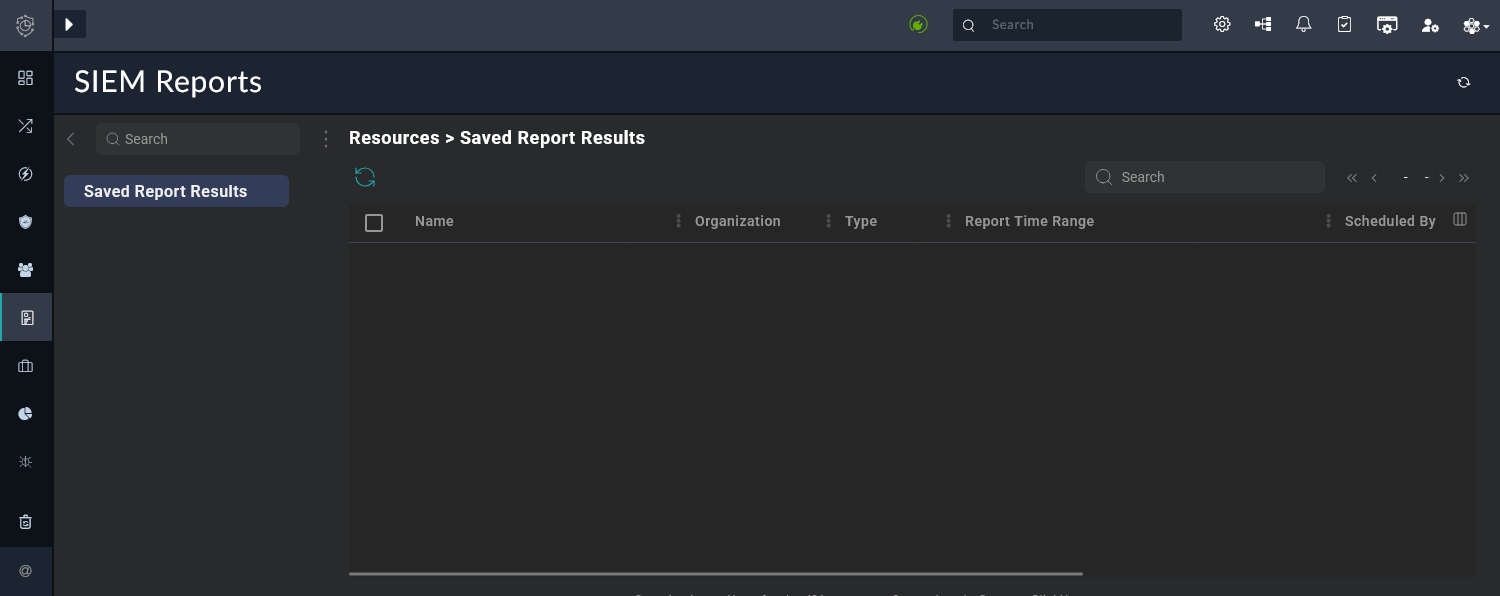
SIEM reports, including their schedules, can be managed from SIEM > Resources > Reports. In this pane, you can find all predefined reports that can be used for the SIEM module.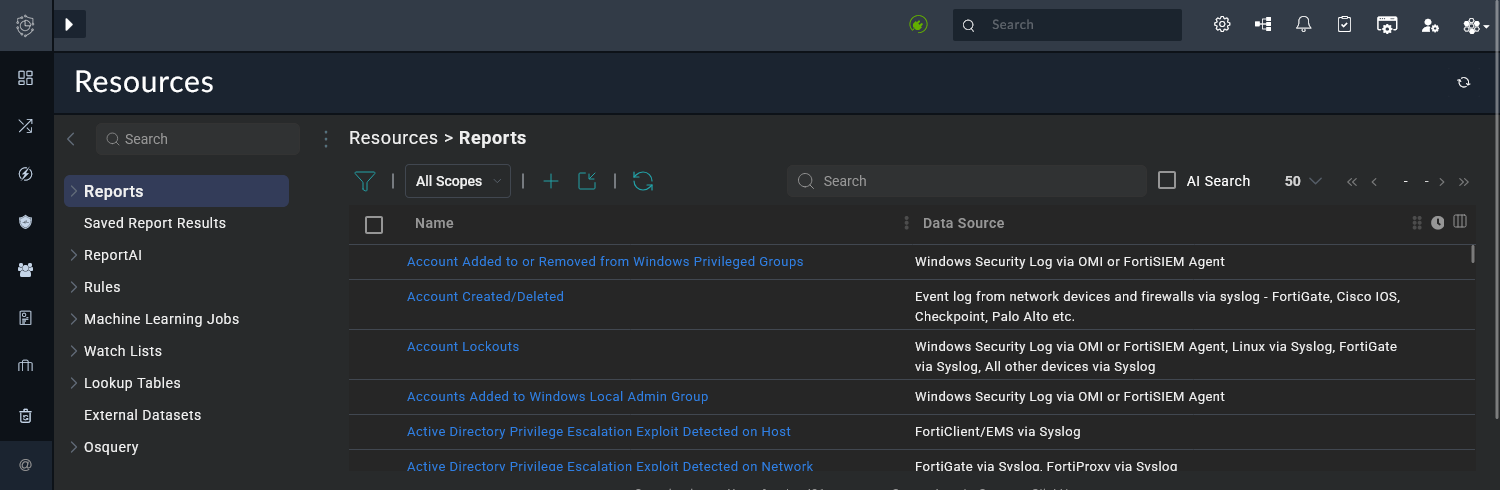
To schedule a report from the SIEM module:
-
Go to SIEM > Resources > Reports.
-
Select the checkbox for the report, and click the Schedule icon in the toolbar.
The Schedule dialog displays.
-
Configure the following options, and then click Next:
Option
Description
Report Time Range
Configure what timeline of data should be used to generate the report.
Trend
Select the granularity of the time axis for the trend chart. If unsure, leave as Auto.
-
Configure the following options, and then click Next:
Option
Description
Schedule Time Range
Configure the start time for the report generation.
Schedule Recurrence Pattern
Configure how often the report will be generated.
Schedule Recurrence Range
Configure the time range for the schedule recurrence.
-
Configure the following options, and then click Next:
Option
Description
Output Format
Select the report output format (PDF or CSV).
Notification
Configure the notifications:
-
Default Notification: send notification to new recipients by adding them using the + icon.
-
Custom Notification: send the notification to the specific email addresses.
-
Copy to a remote location: To copy the report to a remote directory, first define the remote location in SIEM > Settings > Settings > Analytics > Scheduled Report.
Retention
Configure how long the report should be kept for in FortiSOC.
-
-
Click OK.
The generated reports can be found in Reports > SIEM Reports according to their configured schedule and retention.