Navigating the FortiSOC GUI
The initial landing page for the FortiSOC GUI is the Dashboard. You can navigate to the other modules using the tree menu on the left. The available modules vary depending on the privileges (Role) of the user.
The table below lists the modules available by default for super user administrators.
|
Module |
Description |
|---|---|
|
Dashboard |
View dashboards to check the network for threat readiness, monitor existing and potential threats, and to review threat response. Many default dashboards are available to monitor the network according to the user's role or goals. For more information, see Dashboards, reporting, and visibility |
|
Cases & Alerts |
View and update cases and alerts. For more information, see Alerts and case management. |
|
Automation |
View and update automation tools, including connectors, playbooks, data ingestion, and schedules. For more information about data ingestion, see Data ingestion and onboarding. For more information about connectors, see Connectors, APIs, and integrations. For more information about playbooks, see Automation and response. |
|
Threat Intel Management |
View threat intelligence, using tools such as indicators, dashboards, and a threat intel search. You can also view threat intelligence from FortiGuard and tactics / techniques in the MITRE ATT&CK matrices to support threat hunting. Create threat hunts within the Hunts pane to track and report on findings within FortiSOC over a set period of time. The Threat Intel Management GUI is powered by the Threat Intel Management solution pack, which comes preconfigured for FortiSOC. For more information about this solution pack, go to Content Hub > Manage > Threat Intel Management > Documentation in the FortiSOC GUI. |
|
Assets & Identities |
View and update asset and identity information to enhance user and entity behavior analytics (UEBA) within FortiSOC. For more information, see Assets and identity context. |
|
Reports |
View and update reports. The reports are organized into the following categories:
For more information, see Reports and scheduled delivery. |
|
Resources |
View and update resources, including attachments, email templates, keys, and escalation rules. In this module, you can also manage queues, shifts, and leave schedules for analysts. Use the SLA Templates pane to configure SLAs for cases and alerts. |
|
Analyzer |
View and edit configuration for connected Fortinet logging devices and related detection rules. For more information about onboarding devices in the Analyzer module, see Onboarding Fortinet devices |
|
SIEM |
View and edit configuration for the collectors and agents used to ingest data from third-party sources and related detection rules. For more information about onboarding data sources in the SIEM module, see Onboarding third-party data sources. |
|
Content Hub |
Discover, install, and manage solution packs, connectors, and widgets for FortiSOC. You can also create your own solution packs from this module. |
|
Recycle Bin |
View soft-deleted playbooks and playbook collections. From this module, you can restore or permanently delete these records. |
In general, there are four primary components visible within any module: the banner, toolbar, tree menu, and content pane.
|
Component |
Description |
|---|---|
|
Banner |
Along the top of the page. The banner includes:
|
|
Tree menu |
On the left side of the screen. Use this navigation menu to open panes in the GUI. Different modules and panes are available depending on the users' role. You can collapse the tree menu to provide more space for the content pane. When the tree menu is collapsed, the module icons are still visible on the left side of the screen. You can mouse over the icons to display the full name of the module and its panes for navigation. |
|
Content pane |
Contains widgets, lists, configuration options, or other information, depending on the pane, menu, or options that are selected. Most management tasks are handled in the content pane. The content pane is primarily made up of charts, grids, and detail views which are described below. For many content panes, you can edit the template to change the information that is displayed. |
|
Toolbar |
Directly above the content pane. The toolbar includes options for managing content in the content pane, such as Add and Execute. |
Modules and display templates
With sufficient permissions, you can add, edit, and change the order of modules within the FortiSOC GUI.
Modules can added and edited from Settings > Application Editor > Modules. In this editor, you can select a display template for the module.
In many panes, you can click the edit icon at the top right to edit the existing template:
|
Option |
Description |
|---|---|
|
Template Title |
The title for the template. |
|
Add Row |
A container for widgets within the template. |
|
Define a new structure |
The layout for widgets in the row. |
|
Add Widget |
The widget type for the content as well as the data source. |
The default templates are primarily made up of charts, grids, and detail views which are described below.
Charts
Charts will often display in the top row, above a grid view in the content pane. For example, the Cases, Alert List, Assets, and Identities modules display with charts at the top. These donut charts and bar charts provide a summary of the information in the grid view below. In many cases, the charts can be used to quickly filter the grid.
You can perform the following actions with most charts:
-
Click the Refresh icon above the chart to refresh the information.
-
Click the Collapse/Expand icon above the chart to hide/show the chart.
-
Mouse over a section of the chart to display the related summary information in a tooltip.
-
Click a section of the chart to filter the grid below by that criteria.
When you click a chart to filter the grid, the filter criteria will appear above the grid. Click another chart or another area of the same chart to replace the filter criteria. To remove the filter, remove the filter criteria displayed above the grid.
In the example below, the user has clicked Critical in the Open Alerts By Severity chart to filter the grid.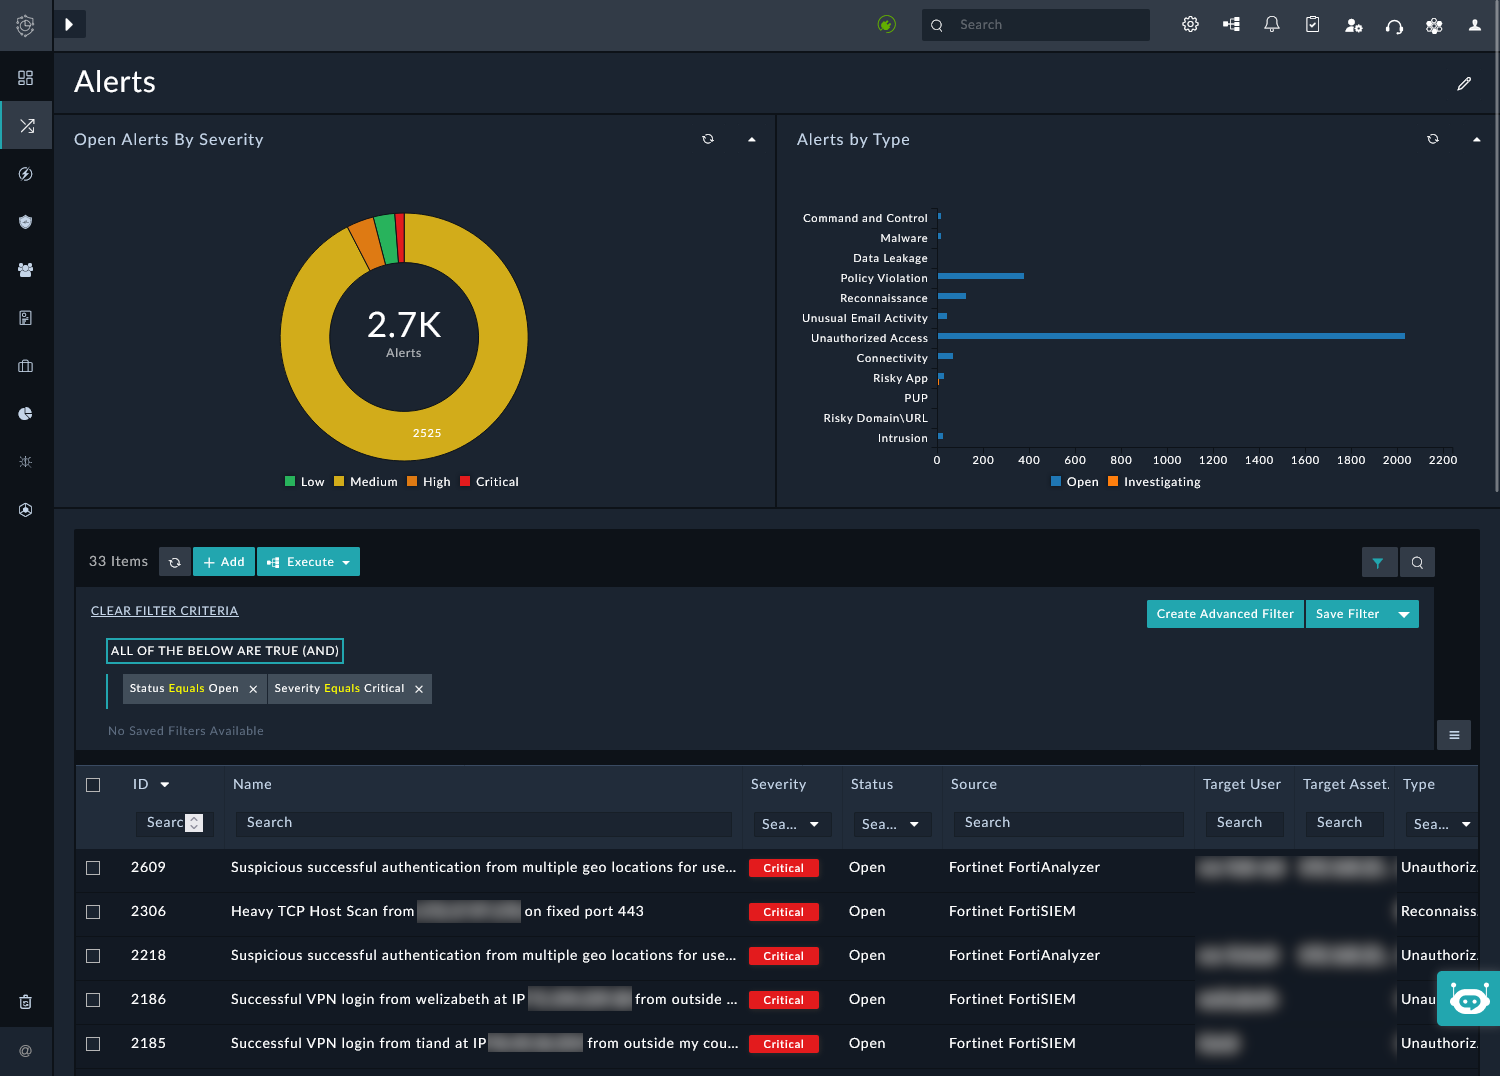
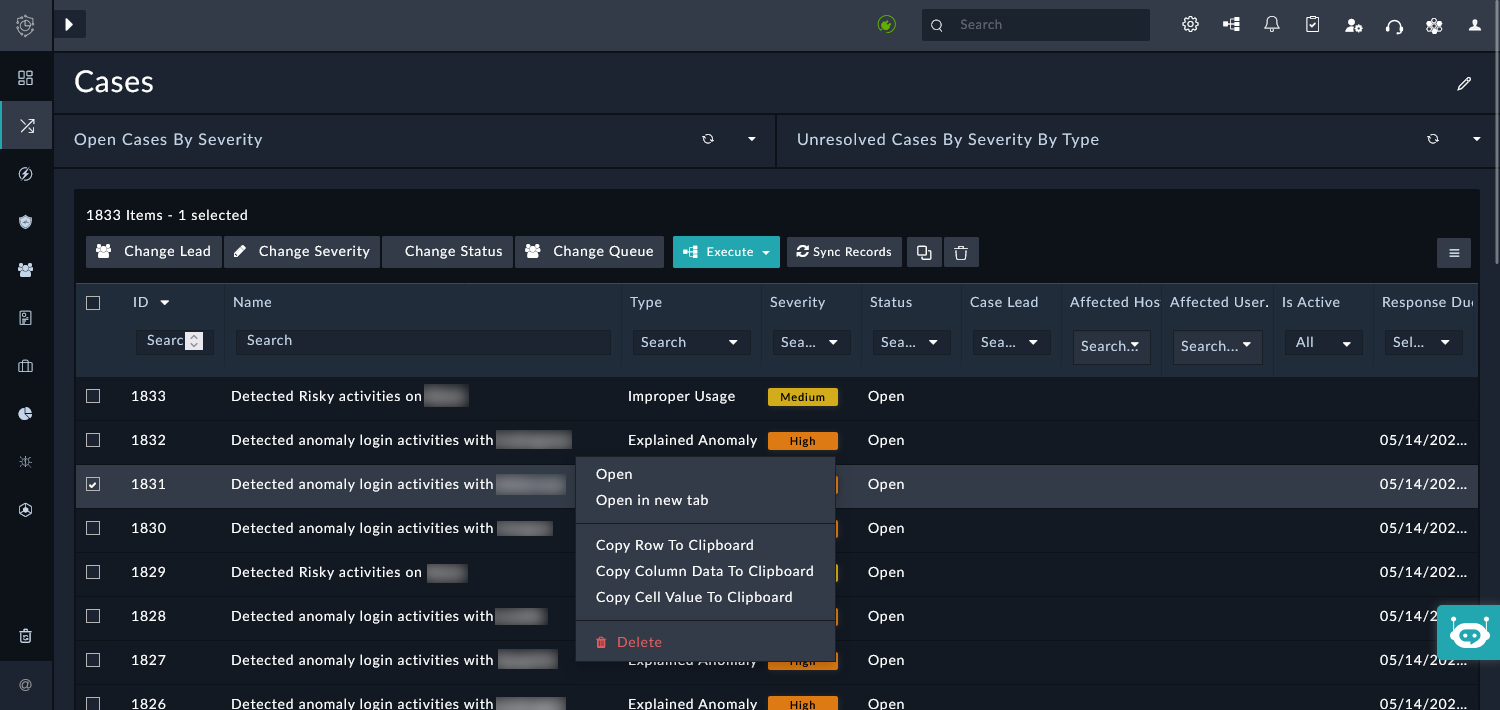
Grids
Grids display a list of records in the content pane, allowing you to search, filter, and perform actions on the content, when applicable.
Using buttons above the grid, you can perform the following actions:
-
Click the Refresh icon to refresh the records in the grid.
-
Click the Filter icon to use or create an advanced grid filter.
For simple filters, use the Search fields or dropdowns above at the top of the columns.
-
Click the Search icon to search the table across all columns and rows.
-
Click the Menu icon to:
-
Export all columns as CSV, or export all visible column as CSV or PDF.
-
Show/hide columns; you can also reset columns to default.
-
-
Click a column header to sort the records by that column. Click the column header again to reverse the sort order.
-
Select the checkbox for a record to perform actions on that record.
-
Click a record to open the detail view.
-
Right-click a record to open the detail view in a new tab, or to copy the row, column, or cell data to clipboard.
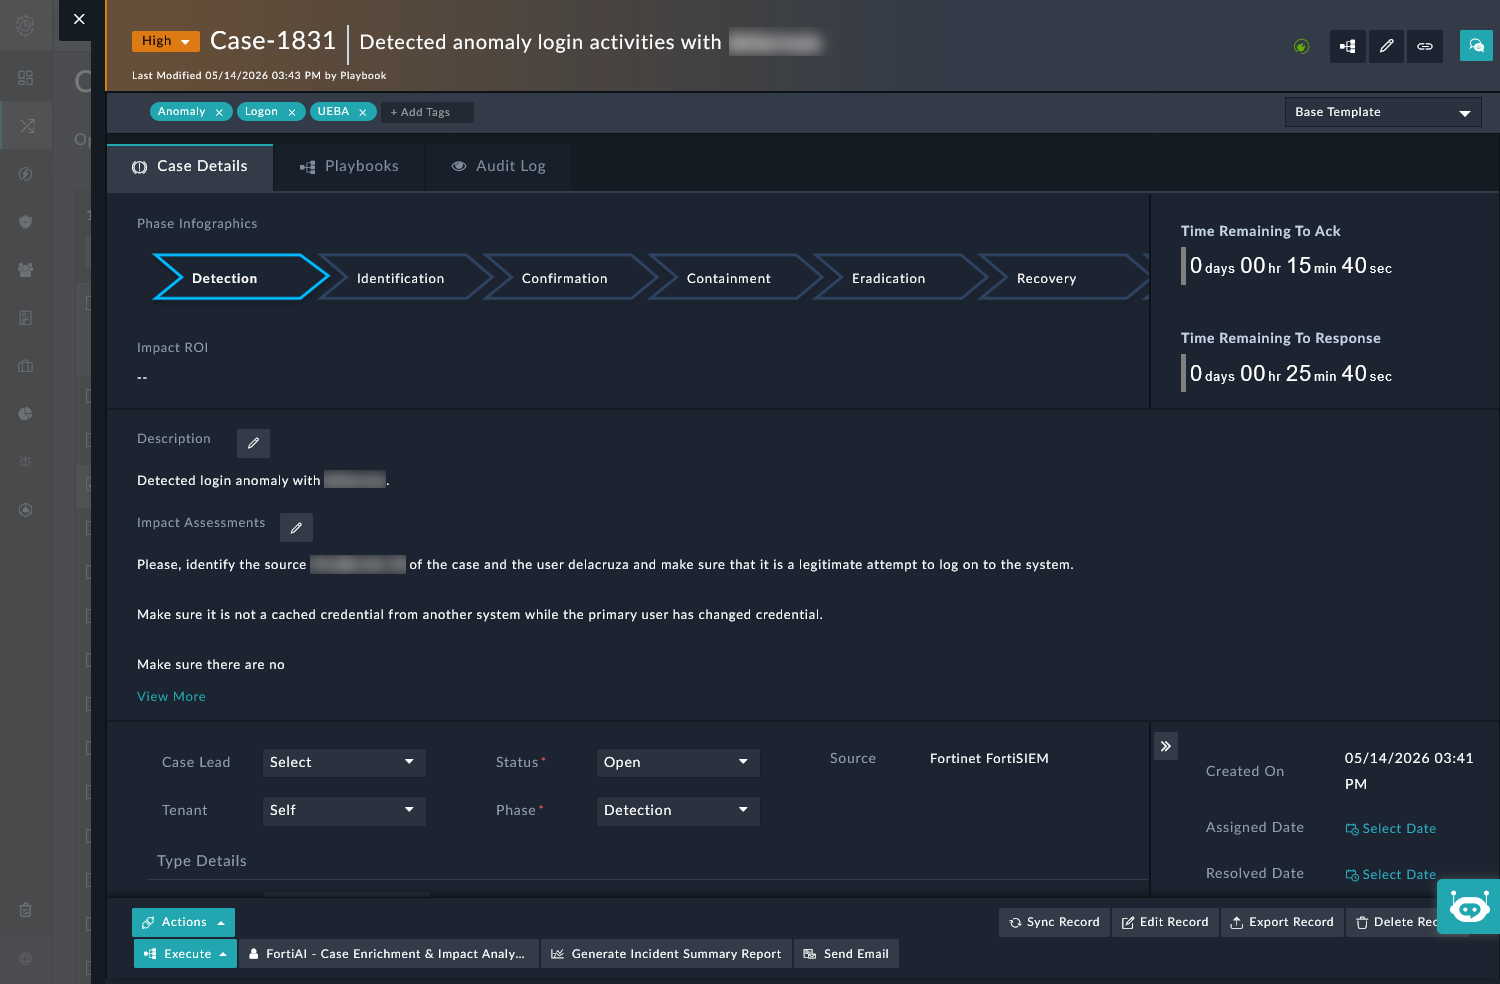
Detail views
You can access detail views by clicking records within the grids. The detail views open as a pane above the module; you can click the X in the top left to close the pane.
The detail views will include many sections, depending on the type of record. Most detail views will include:
-
Header information, such as the record name, last modified time, and tags. The header is fixed to the top as you scroll through the details view.
-
Tabs, such as Details, Playbooks, and Audit Logs.
-
Sections, such as details, correlations, and more.
There may be grids, charts, and other widgets included within sections of the detail view. These are interactive, as they would be in regular modules throughout FortiSOC.
-
Actions in the footer which can be performed on the record. The footer is fixed to the bottom as you scroll through the details view.
Below is an example of the Case detail view.