About the connector
Dragos WorldView industrial threat intelligence provides actionable information and recommendations on threats to operations technology (OT) environments.
This document provides information about the Dragos WorldView Threat Intelligence Connector, which facilitates automated interactions, with a Dragos WorldView Threat Intelligence server using FortiSOAR™ playbooks. Add the Dragos WorldView Threat Intelligence Connector as a step in FortiSOAR™ playbooks and perform automated operations with Dragos WorldView Threat Intelligence.
Version information
Connector Version: 1.1.0
FortiSOAR™ Version Tested on: 7.4.0-2034
Dragos WorldView Threat Intelligence Version Tested on: v1
Authored By: Fortinet
Certified: Yes
Release Notes for version 1.1.0
The following enhancements have been made to the Dragos WorldView Threat Intelligence Connector in version 1.1.0:
- Added the ability to configure data ingestion (using the Data Ingestion Wizard). The Data Ingestion Wizard also supports multiple configurations specified on the Configurations tab of the Dragos WorldView Threat Intelligence connector, ensuring respective global variables based on the selected configuration are used while ingesting data.
- Enhanced the 'Get All Indicators' action by adding the functionality to fetch all records.
Installing the connector
Use the Content Hub to install the connector. For the detailed procedure to install a connector, click here.
You can also use the yum command as a root user to install the connector:
yum install cyops-connector-dragos-worldview-threat-intelligence
Prerequisites to configuring the connector
- You must have the URL for the Dragos WorldView Threat Intelligence server to connect and perform automated operations, and credentials to access that server.
- The FortiSOAR™ server should have outbound connectivity to port 443 on the Dragos WorldView Threat Intelligence server.
Minimum Permissions Required
Configuring the connector
For the procedure to configure a connector, click here
Configuration parameters
In FortiSOAR™, on the Connectors page, click the Dragos WorldView Threat Intelligence connector row (if you are in the Grid view on the Connectors page), and in the Configurations tab enter the required configuration details:
| Parameter |
Description |
| Server URL |
The fully qualified domain name (FQDN) of the Dragos server to connect and perform automated operations. |
| Access Token |
The API access token that is required to connect to the Dragos server and perform automated operations. |
| Secret Key |
The API secret key required to connect to the Dragos server and perform automated operations. |
| Verify SSL |
Specifies whether the SSL certificate for the server is to be verified or not.
By default, this option is set to True. |
Actions supported by the connector
The following automated operations can be included in playbooks and you can also use the annotations to access operations from FortiSOAR™ release 4.10.0 and onwards:
| Function |
Description |
Annotation and Category |
| Get All Indicators |
Retrieves a paginated list of all indicators from Dragos based on indicator value, type (IP, Domain, or Hostname), and other filter criteria that you have specified. |
get_all_indicators
Investigation |
| Get All Indicators In Stix2 |
Retrieves a list of stix2 (Structured Threat Information Expression) bundle of indicators from Dragos based on indicator value, type (IP, Domain, or Hostname), and other filter criteria that you have specified. |
get_all_indicators_in_stix2
Investigation |
| Get All Reports |
Retrieves a list of all reports from Dragos based on indicator value, type (IP, Domain, or Hostname), and other filter criteria that you have specified. |
get_all_reports
Investigation |
| Get Report Metadata |
Retrieves the report metadata based on the specified serial number. |
get_report_metadata
Investigation |
| Get Indicators Of Report |
Retrieves indicators of the report from Dragos based on the report's serial number. |
get_indicators_of_report
Investigation |
| Get All Tags |
Retrieves a list of all tags from Dragos based on various parameters such as page number, page size, and tag type that you have specified. |
get_all_tags
Investigation |
operation: Get All Indicators
Input parameters
| Parameter |
Description |
| Indicator Value |
(Optional) Specify an indicator value to get details from Dragos. |
| Indicator Type |
(Optional) Specify the type of indicator whose details you want to retrieve from Dragos. Choose from the following indicator types:
- Domain
- Filename
- Hostname
- IP
- MD5
- SHA1
- SHA256
|
| Number of Records to Return |
Specify the total number of records that should be fetched by this operation from Dragos. You can choose from the following options:
- Fetch All Records: Fetches all indicators based on the parameters you have specified.
- Fetch Limited Records: Fetches a limited set of records based on the parameters you have specified. If you choose this option, then you must specify these additional parameters:
- Limit: Specify the maximum number of results, per page, that this operation should return. By default, this option is set as 500, with the maximum supported value of 1001.
- Offset: Specify the page number from which to retrieve the records. The default value is
1
|
| Updated After |
(Optional) Specify the date and time after which to retrieve indicators. The DateTime must be in the ISO format (UTC). |
| Report Serial Number |
(Optional) Specify the list of serial numbers of the report containing the indicators to retrieve. |
| Tags |
(Optional) Specify the list of tags for the indicators to search and retrieve. |
Output
The output contains the following populated JSON schema:
{
"indicators": [
{
"id": "",
"value": "",
"indicator_type": "",
"category": "",
"comment": "",
"first_seen": "",
"last_seen": "",
"updated_at": "",
"confidence": "",
"kill_chain": "",
"uuid": "",
"status": "",
"severity": "",
"threat_groups": [],
"attack_techniques": [],
"ics_attack_techniques": [],
"pre_attack_techniques": [],
"products": [
{
"serial": ""
}
],
"activity_groups": []
}
],
"total": "",
"page": "",
"page_size": "",
"total_pages": ""
}
operation: Get All Indicators In Stix2
Input parameters
| Parameter |
Description |
| Indicator Value |
(Optional) Specify an indicator value to get details from Dragos. |
| Indicator Type |
(Optional) Specify the type of indicator whose details you want to retrieve from Dragos. Choose from the following indicator types:
- Domain
- Filename
- Hostname
- IP
- MD5
- SHA1
- SHA256
|
| Page Size |
(Optional) Specify the count of records that the operation should include per page. Page size must be less than 1001. The default value is 500. |
| Page Number |
(Optional) Specify the page number from which to retrieve the records. The default value is 1 |
| Updated After |
(Optional) Specify the date and time after which to retrieve indicators. The DateTime must be in the ISO format (UTC). |
| Report Serial Number |
(Optional) Specify the list of serial numbers of the report containing the indicators to retrieve. |
| Tags |
(Optional) Specify the list of tags for the indicators to search and retrieve. |
Output
The output contains the following populated JSON schema:
{
"type": "",
"id": "",
"spec_version": "",
"objects": [
{
"id": "",
"type": "",
"created": "",
"modified": "",
"created_by_ref": ""
}
]
}
operation: Get All Reports
Input parameters
| Parameter |
Description |
| Sort By |
(Optional) Specify criteria to sort the reports. The default value is Release Date. Following are the available options
- Title
- Threat
- TLC
- Release Date
|
| Sort Order |
(Optional) Specify the sorting order of the results. |
| Page Number |
(Optional) Specify the page number from which to retrieve the records. The default value is 1 |
| Page Size |
(Optional) Specify the count of records that the operation should include per page. Page size must be less than 1001. The default value is 500. |
| Updated After |
(Optional) Specify the date and time after which to retrieve indicators. The DateTime must be in the ISO format (UTC). |
| Report Serial Number |
(Optional) Specify the list of serial numbers of the report, containing the indicators, to retrieve. |
| Indicator |
(Optional) Specify the indicator to filter the reports (exact match only). |
Output
The output contains the following populated JSON schema:
{
"products": [
{
"tlp_level": "",
"title": "",
"executive_summary": "",
"updated_at": "",
"threat_level": "",
"serial": "",
"ioc_count": "",
"tags": [
{
"text": "",
"tag_type": ""
}
],
"release_date": "",
"type": "",
"report_link": ""
}
],
"total": "",
"page": "",
"page_size": "",
"total_pages": ""
}
operation: Get Report Metadata
Input parameters
| Parameter |
Description |
| Report Serial Number |
Specify the report's serial number from which to retrieve details. |
Output
The output contains the following populated JSON schema:
{
"tlp_level": "",
"title": "",
"executive_summary": "",
"updated_at": "",
"threat_level": "",
"serial": "",
"ioc_count": "",
"tags": [
{
"text": "",
"tag_type": ""
}
],
"release_date": "",
"type": "",
"report_link": "",
"ioc_csv_link": "",
"ioc_stix2_link": ""
}
operation: Get Indicators Of Report
Input parameters
| Parameter |
Description |
| Process Response As |
Specify the file format in which to save the indicators. Available options are:
- Save as CSV - The CSV file can be found in FortiSOAR's Attachments module.
- STIX2.0 JSON
|
| Filename |
Specify the name of the CSV file to be saved. |
| Report Serial Number |
Specify the report's serial number from which to retrieve details. |
Output
The output contains the following populated JSON schema when you choose Process Response as Save as CSV:
{
"id":"",
"@id":"",
"file":{
"id":"",
"@id":"",
"size":"",
"uuid":"",
"@type":"",
"assignee":"",
"filename":"",
"metadata":[],
"mimeType":"",
"thumbnail":"",
"uploadDate":""
},
"name":"",
"type":"",
"uuid":"",
"@type":"",
"tasks":[],
"alerts":[],
"assets":[],
"owners":[],
"people":[],
"@context":"",
"assignee":"",
"comments":[],
"warrooms":[],
"incidents":[],
"createDate":"",
"createUser":{
"id":"",
"@id":"",
"name":"",
"uuid":"",
"@type":"",
"avatar":"",
"userId":"",
"userType":"",
"createDate":"",
"createUser":"",
"modifyDate":"",
"modifyUser":""
},
"indicators":[],
"modifyDate":"",
"modifyUser":{
"id":"",
"@id":"",
"name":"",
"uuid":"",
"@type":"",
"avatar":"",
"userId":"",
"userType":"",
"createDate":"",
"createUser":"",
"modifyDate":"",
"modifyUser":""
},
"recordTags":[],
"userOwners":[],
"description":""
}
The output contains the following populated JSON schema when you choose Process Response as STIX2.0 JSON:
{
"type": "",
"id": "",
"spec_version": "",
"objects": [
{
"id": "",
"type": "",
"created": "",
"modified": "",
"created_by_ref": ""
}
]
}
The output contains the following populated JSON schema when you choose Process Response as Save as CSV:
operation: Get All Tags
Input parameters
| Parameter |
Description |
| Page Number |
(Optional) Specify the page number from which to retrieve the records. The default value is 1 |
| Page Size |
(Optional) Specify the count of records that the operation should include per page. Page size must be less than 500. The default value is 100. |
| Tag Type |
Specify the tag type of the tags to retrieve. |
Output
The output contains the following populated JSON schema:
{
"content": [
{
"text": "",
"special_tag_type": "",
"special_tag": {
"description": "",
"external_uuid": "",
"long_name": "",
"url": ""
}
}
],
"total": "",
"page": "",
"page_size": "",
"total_pages": ""
}
Included playbooks
The Sample - Dragos WorldView Threat Intelligence - 1.1.0 playbook collection comes bundled with the Dragos WorldView Threat Intelligence connector. These playbooks contain steps using which you can perform all supported actions. You can see bundled playbooks in the Automation > Playbooks section in FortiSOAR™ after importing the Dragos WorldView Threat Intelligence connector.
- > Dragos > Fetch and Create
- Dragos > Ingest
- Get All Indicators
- Get All Indicators In Stix2
- Get All Reports
- Get All Tags
- Get Indicators Of Report
- Get Report Metadata
Note: If you are planning to use any of the sample playbooks in your environment, ensure that you clone those playbooks and move them to a different collection since the sample playbook collection gets deleted during the connector upgrade and delete.
Data Ingestion Support
Use the Data Ingestion Wizard to easily ingest data into FortiSOAR™ by pulling data from Dragos WorldView Threat Intelligence. For more information on the Data Ingestion Wizard, see the Connectors Guide in the FortiSOAR™ product documentation.
Prerequisites
Before you begin ingesting data into FortiSOAR, it is strongly recommended that you deploy and set up the Threat Intel Management Solution Pack, since, by default, data ingestion is mapped to the Threat Intel Feed modules.
Configure Data Ingestion
You can configure data ingestion using the Data Ingestion Wizard to seamlessly map Dragos WorldView Threat Intelligence content to related FortiSOAR™ modules.
- To begin configuring data ingestion, click Configure Data Ingestion on the Dragos WorldView Threat Intelligence connector's Configurations page.
Click Let's Start by fetching some data, to open the Fetch Sample Data screen.
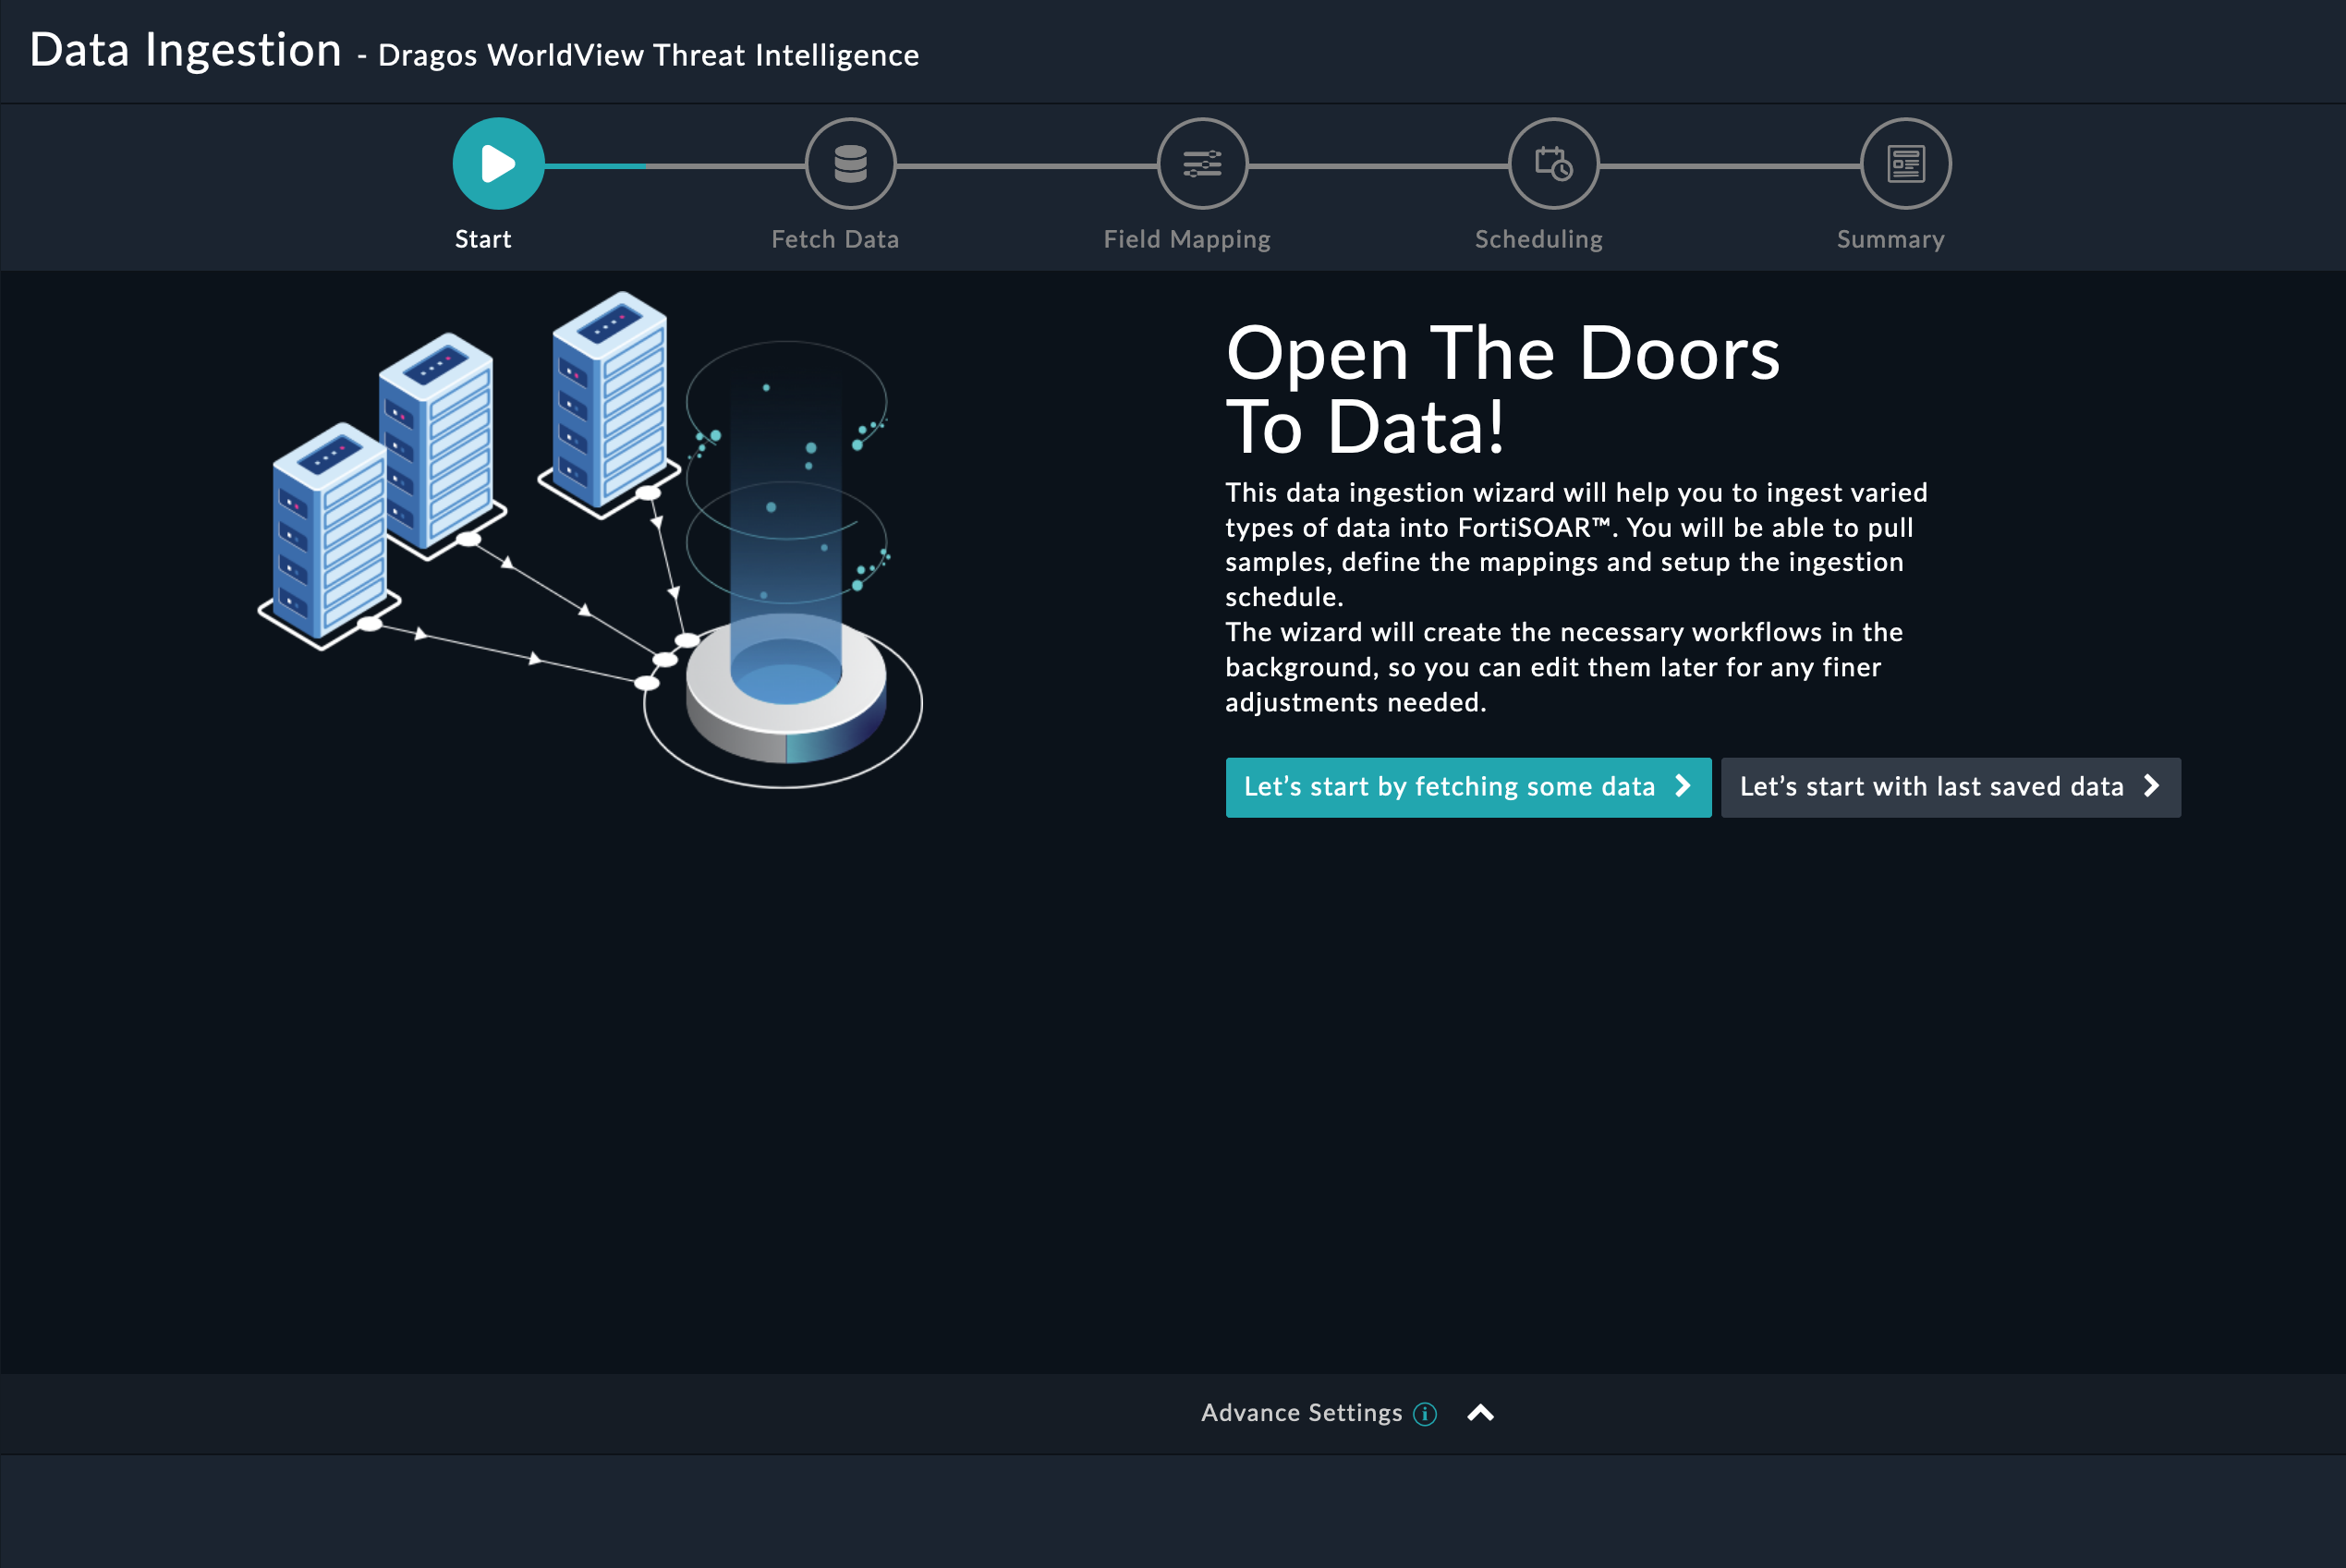
Sample data is required to create a field mapping between Dragos WorldView Threat Intelligence data and FortiSOAR™. The sample data is pulled from connector actions or ingestion playbooks.
- On the Fetch Data screen, provide the configurations required to fetch Dragos WorldView Threat Intelligence data.
Users pull data, i.e., indicators, from Dragos WorldView Threat Intelligence by specifying the last X minutes based on which they want to pull indicators, from Dragos WorldView Threat Intelligence. You can filter the indicators based on the values specified in the reputation, TLP, confidence marking, TLP, or report serial numbers fields. Additionally, you can choose to pull all indicator records based on filters you have specified or a limited set of records. The fetched data is used to create a mapping between the Dragos WorldView Threat Intelligence data and FortiSOAR™ indicators:
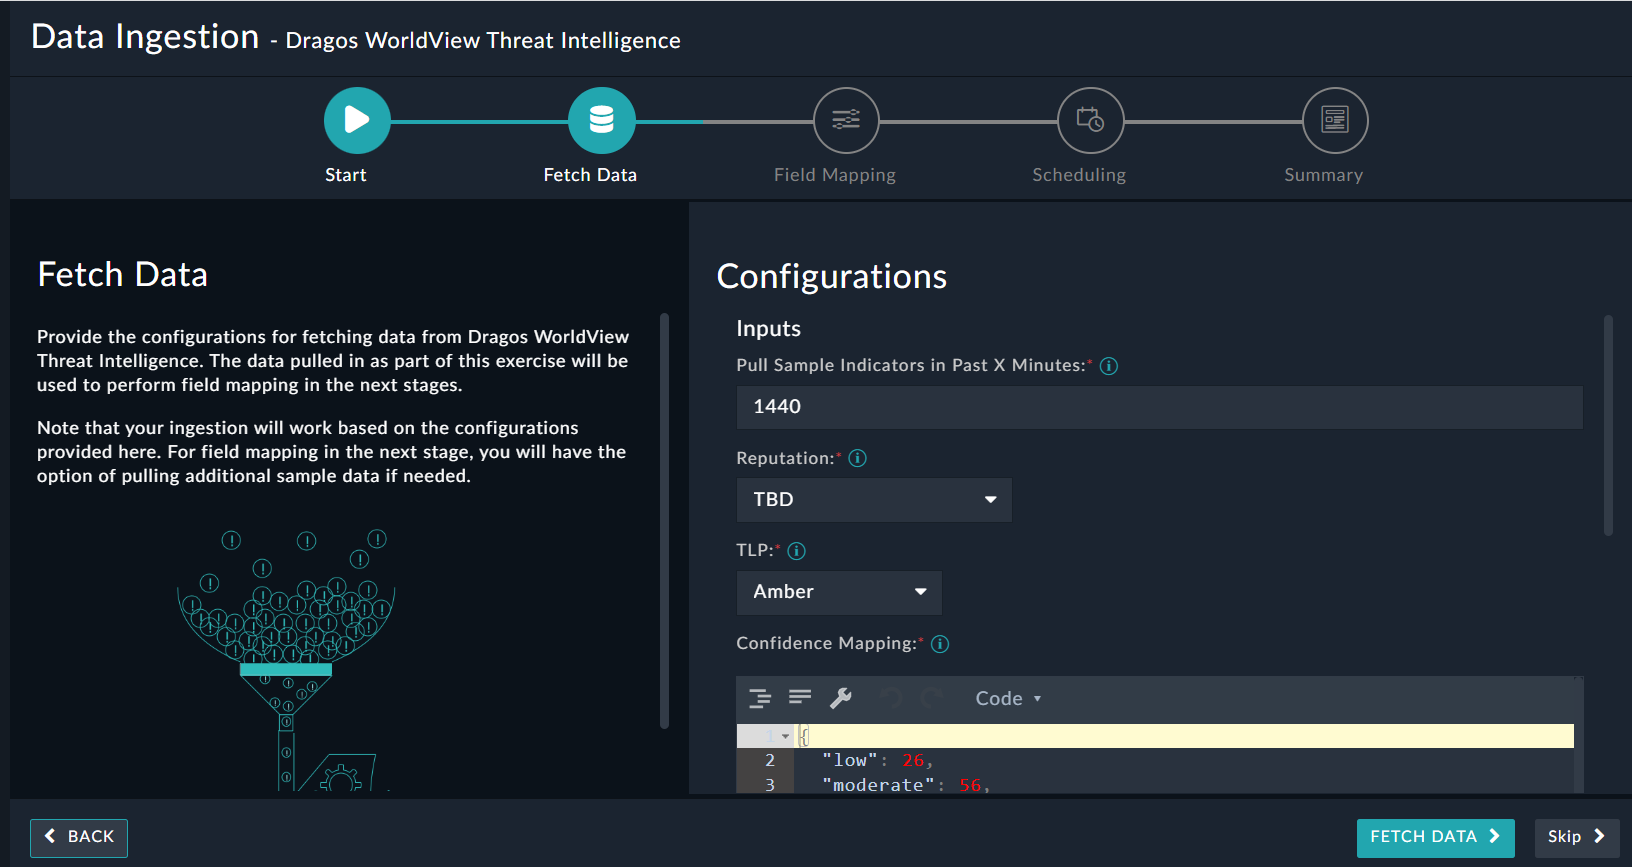
Once you have completed specifying the configurations, click Fetch Data.
-
On the Field Mapping screen, map the fields of a Dragos WorldView Threat Intelligence indicators to the fields of a Threat Intel Feed present in FortiSOAR™.
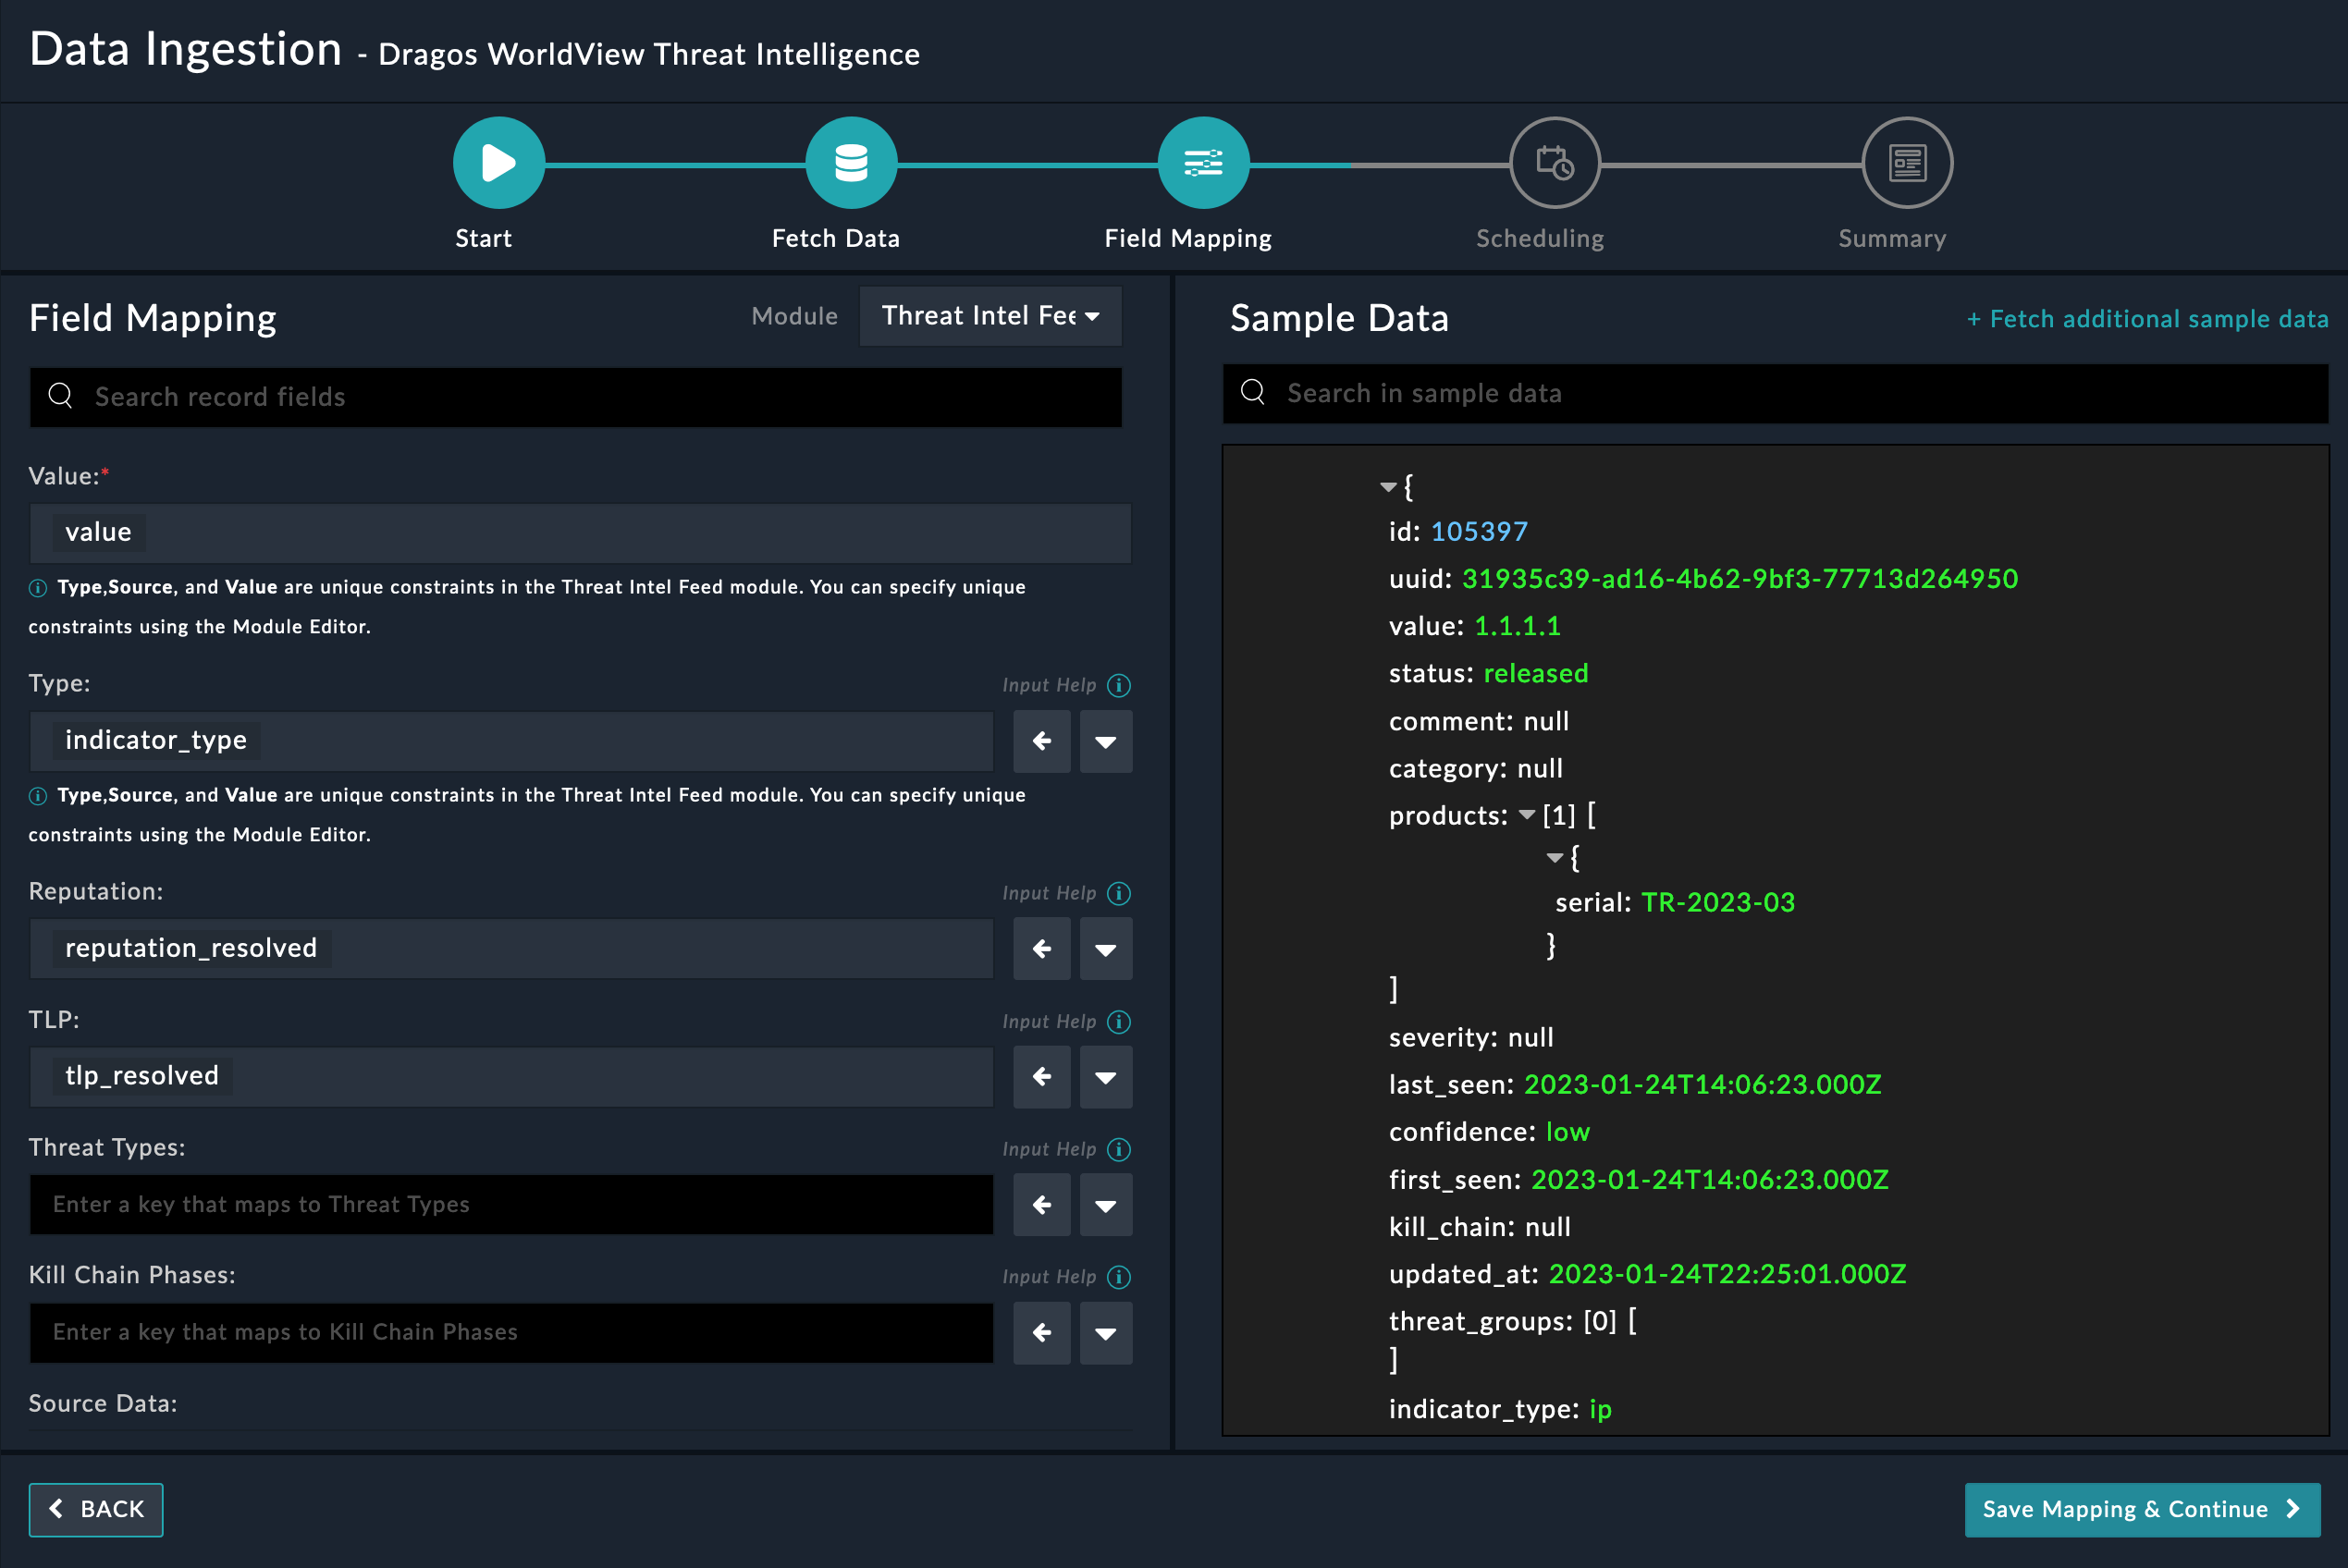
For more information on field mapping, see the Data Ingestion chapter in the Connectors Guide in the FortiSOAR™ product documentation. Once you have completed mapping fields, click Save Mapping & Continue.
-
(Optional) Use the Scheduling screen to configure schedule-based ingestion, i.e., specify the polling frequency to Dragos WorldView Threat Intelligence, so that the content gets pulled from the Dragos WorldView Threat Intelligence integration into FortiSOAR™.
On the Scheduling screen, from the Do you want to schedule the ingestion? drop-down list, select Yes.
In the Configure Schedule Settings section, specify the Cron expression for the schedule. For example, if you want to pull data from Dragos WorldView Threat Intelligence every 5 minutes, click Every X Minute and in the minute box enter */5. This would mean that based on the configuration you have set up, data, i.e., indicators will be pulled from Dragos WorldView Threat Intelligence every 5 minutes.
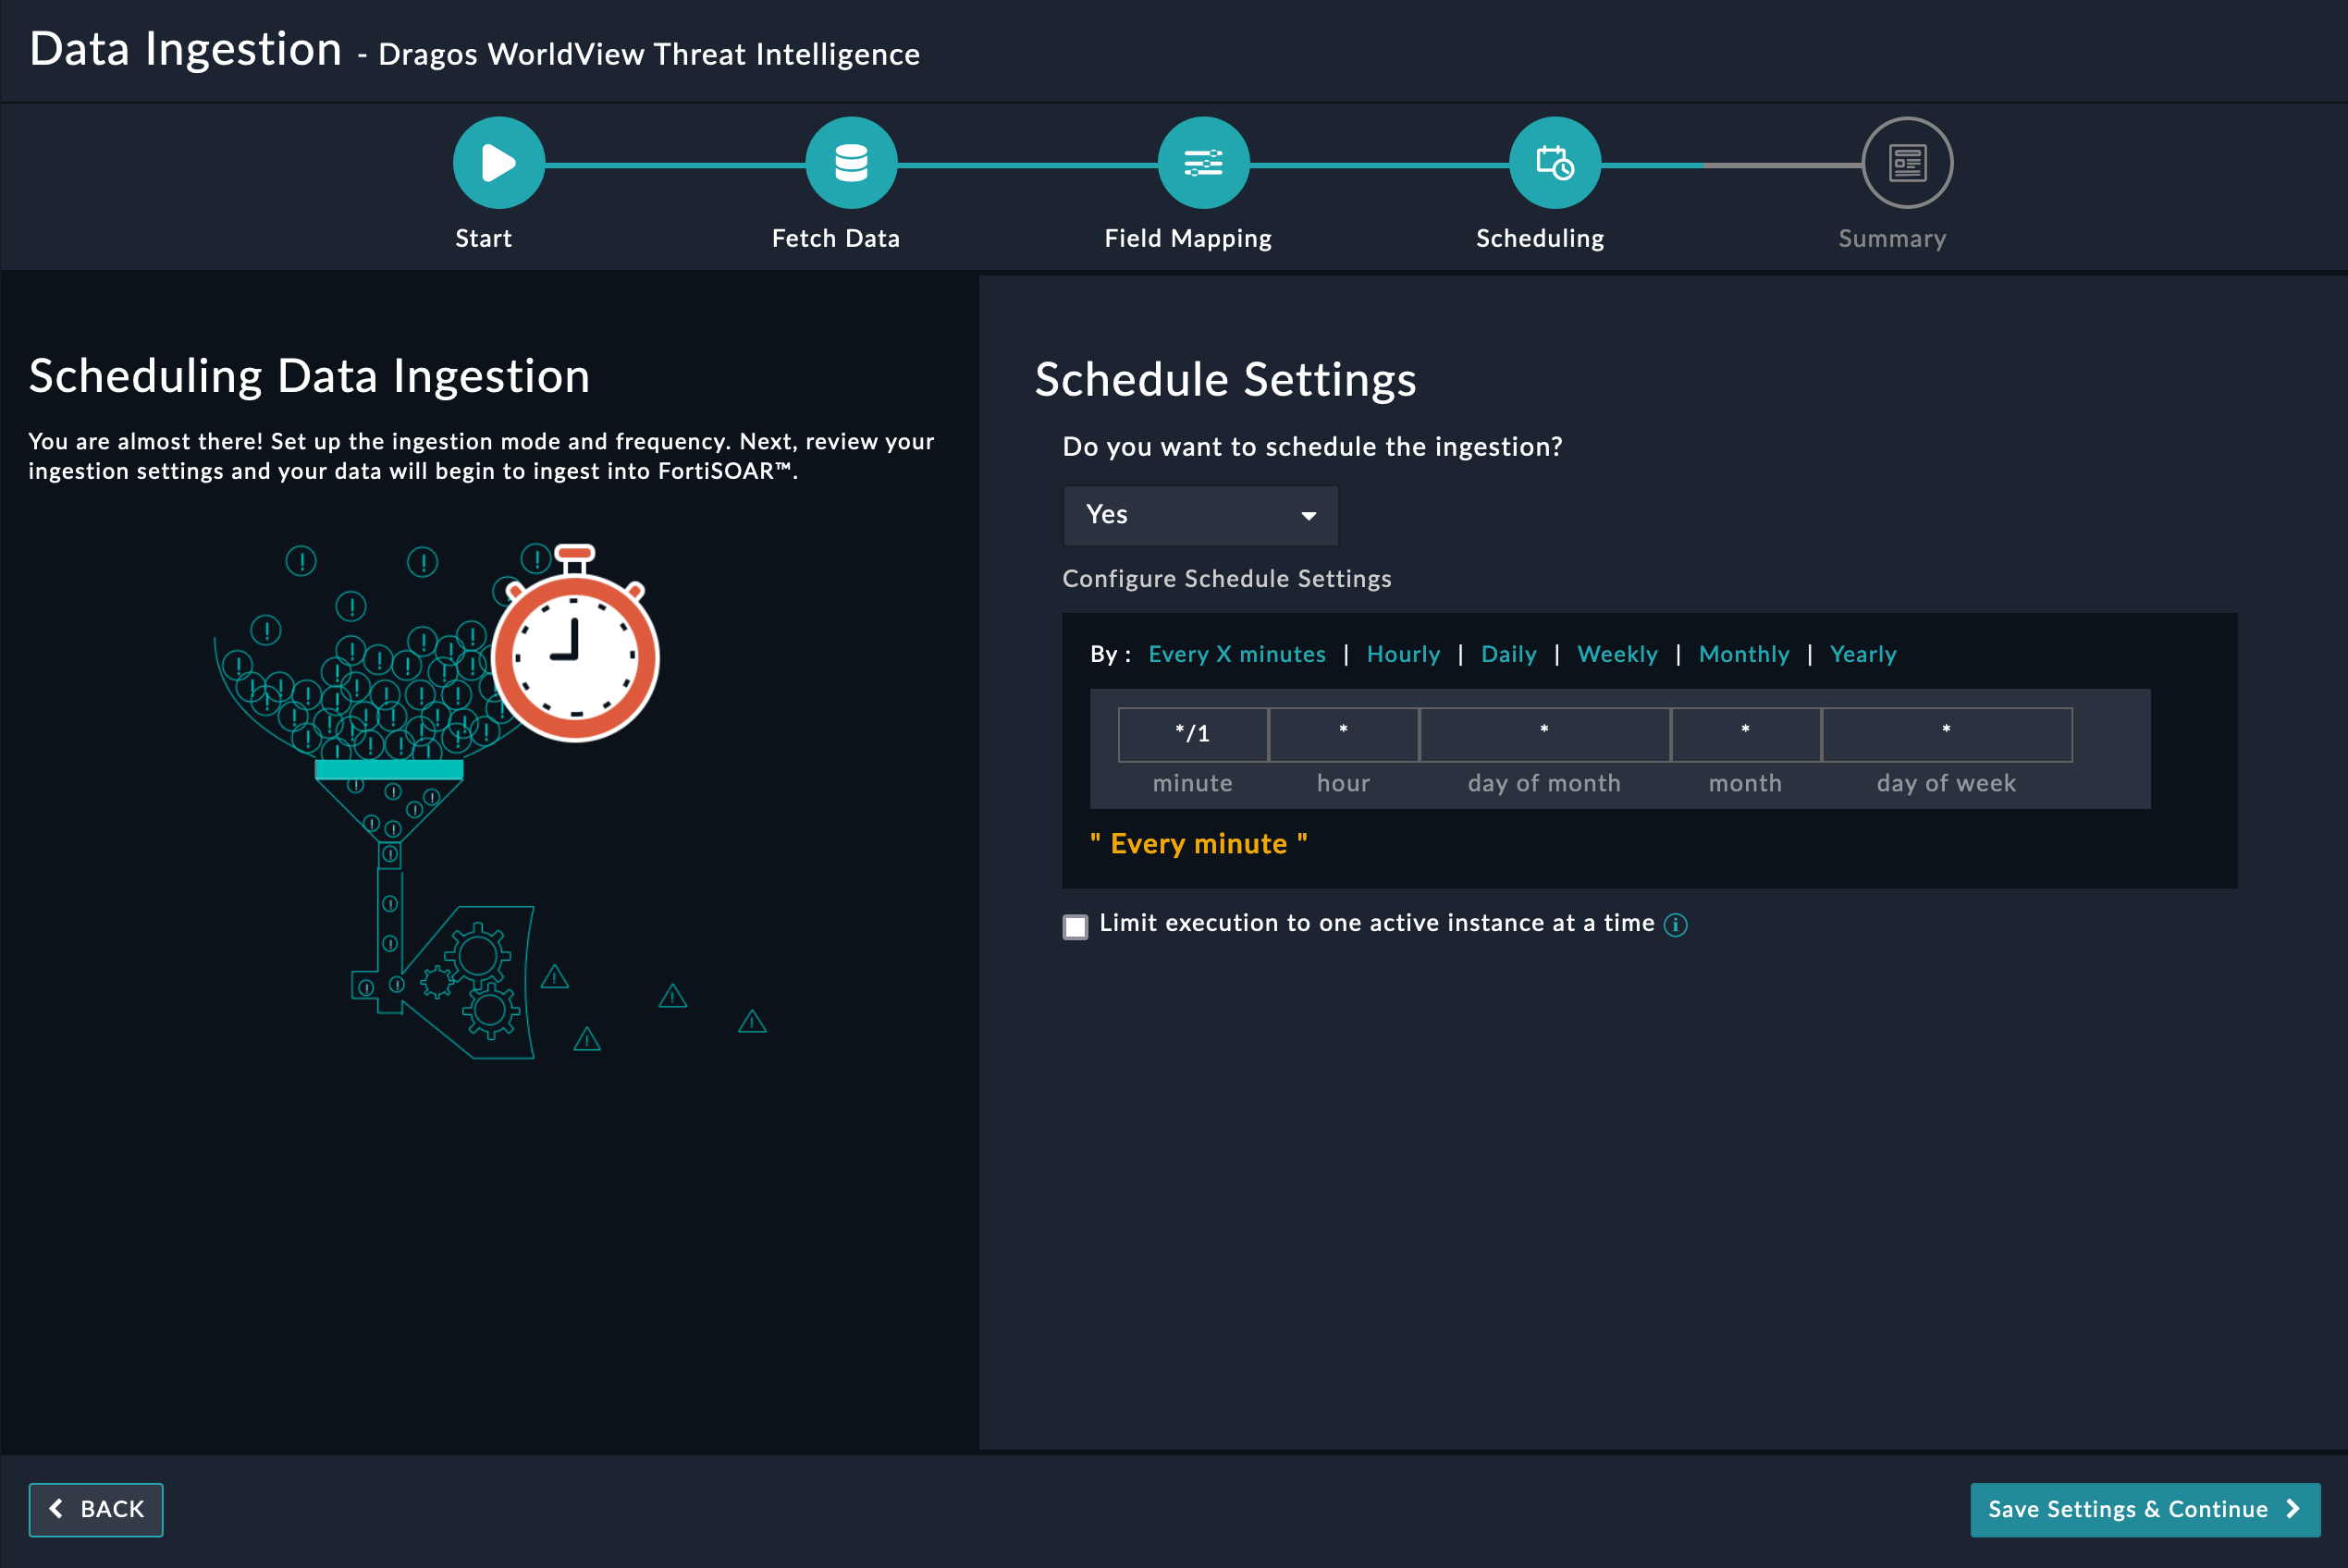
Once you have completed scheduling, click Save Settings & Continue.
-
The Summary screen displays a summary of the mapping done, and it also contains links to the Ingestion playbooks. Click Done to complete the data ingestion and exit the Data Ingestion Wizard.


