
Diagnostics
Administrators can use the Diagnostics page to create a filter on an interface to capture a specified number of packet streams to examine in real-time with header and payload information. Once completed, packets can be filtered by various fields or through the search bar. The capture can be saved as a PCAP file that you can use with a third-party application, such as Wireshark, for further analysis.
To capture packets in the GUI:
-
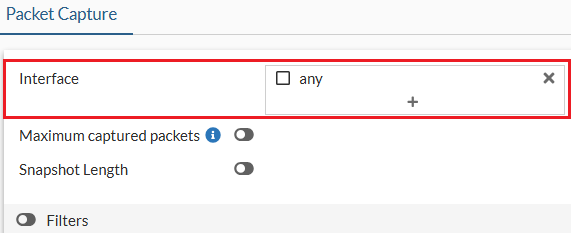
Go to Network > Diagnostics and select one or multiple interfaces (default is any).
-
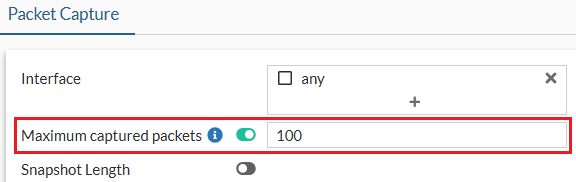
Optionally, enable Maximum captured packets and enter a number which is the maximum number of packets that the FortiProxy will capture. The default is 100. When disabled, the FortiProxy automatically stops after capturing 50,000 packets to preserve memory.
-
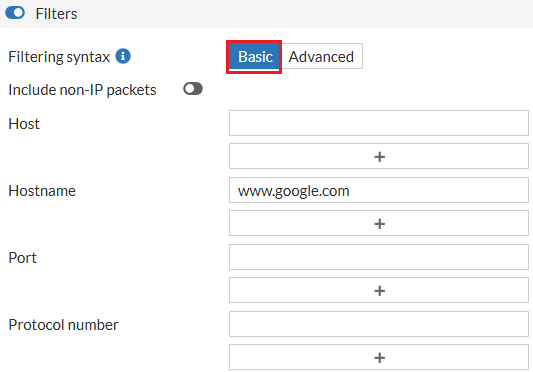
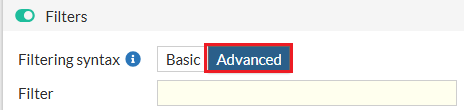
Optionally, enable Filters and select a Filtering syntax:
-
Basic: enter criteria for the Host, Hostname, Port, and Protocol number.
-
Advanced: enter a string, such as src host 172.16.200.254 and dst host 172.16.200.1 and dst port 443.
-
-
Click Start capture. The capture is visible in real-time.
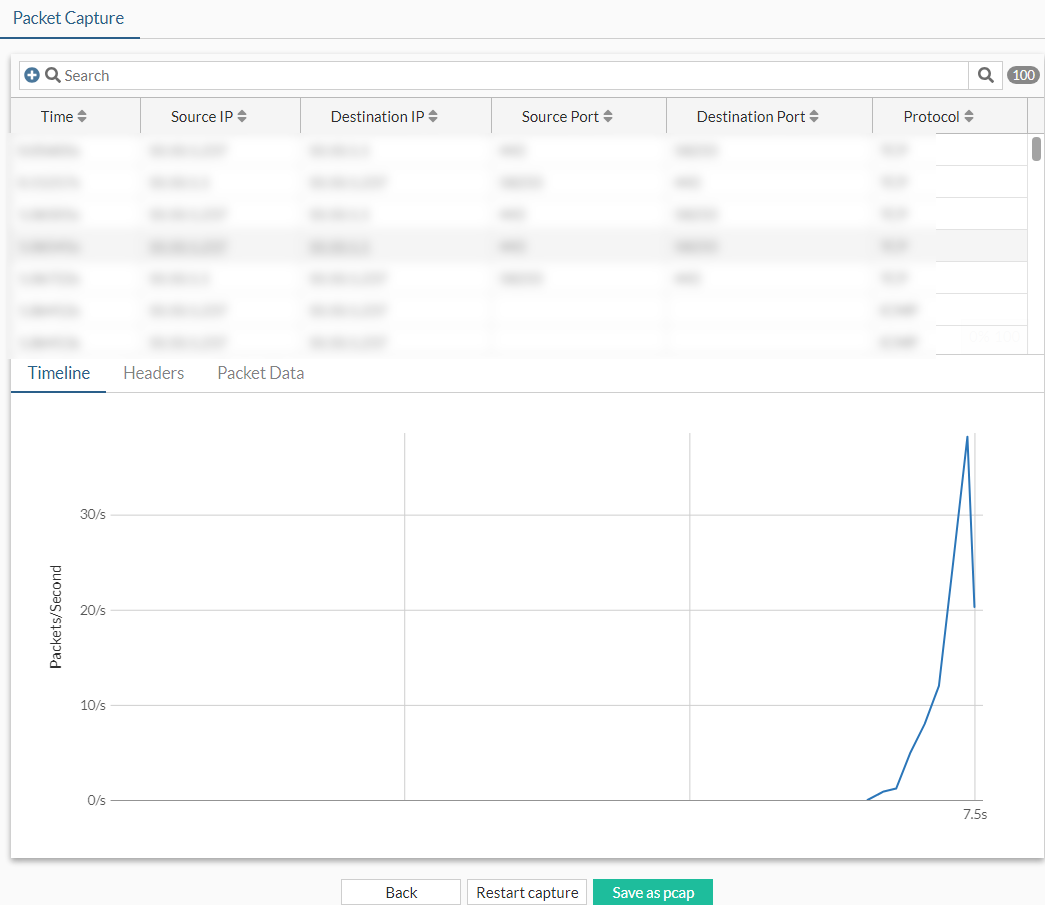
-
While the capture is running, select a packet, then click the Headers or Packet Data tabs to view more information.
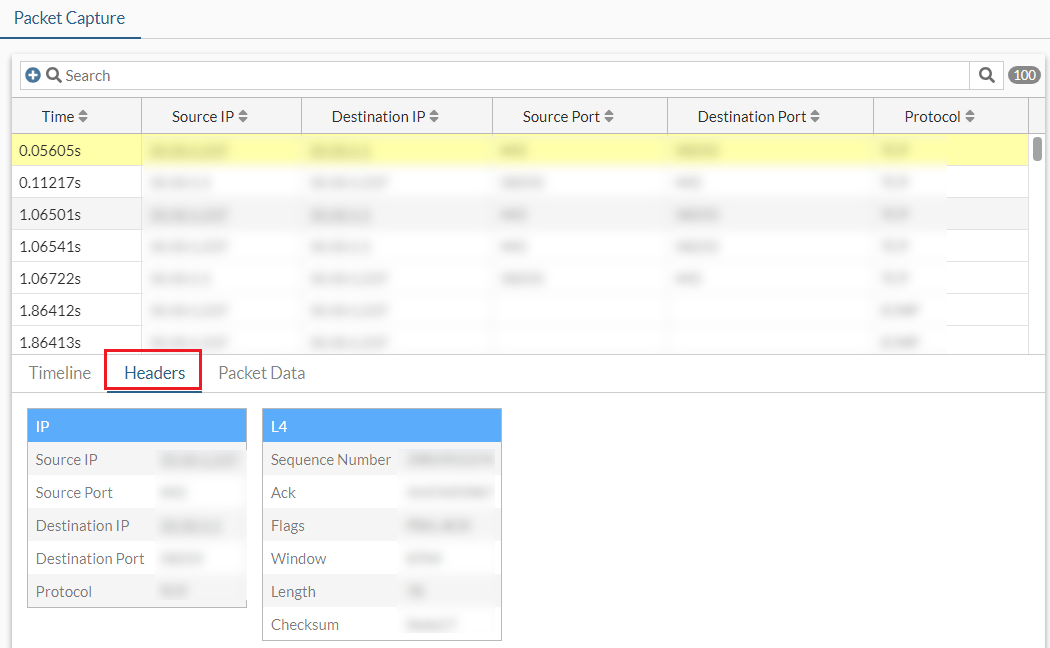
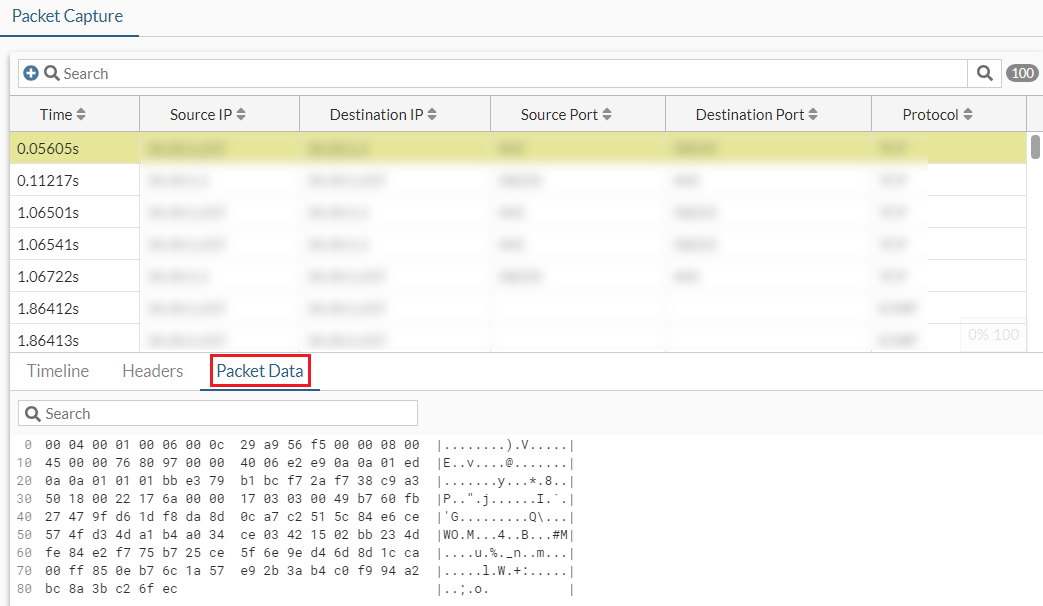
-
When the capture is finished, click Save as pcap. The PCAP file is automatically downloaded.
-
Optionally, use the Search bar or the column headers to filter the results further.
|
|
For more granular sniffer output with various verbose settings, use |