


Secure SD-WAN
The Secure SD-WAN tab in View > Monitors displays the SD-WAN monitoring information.
The dashboard includes the following widgets:
- SD-WAN Rules Utilization
- SD-WAN Performance Status
- Link Health: Jitter, Latency, and Packet Loss
- SD-WAN Utilization by Application
- Bandwidth Utilization by SD-WAN Rules
- SD-WAN Link Utilization
- SD-WAN High and Critical Events.
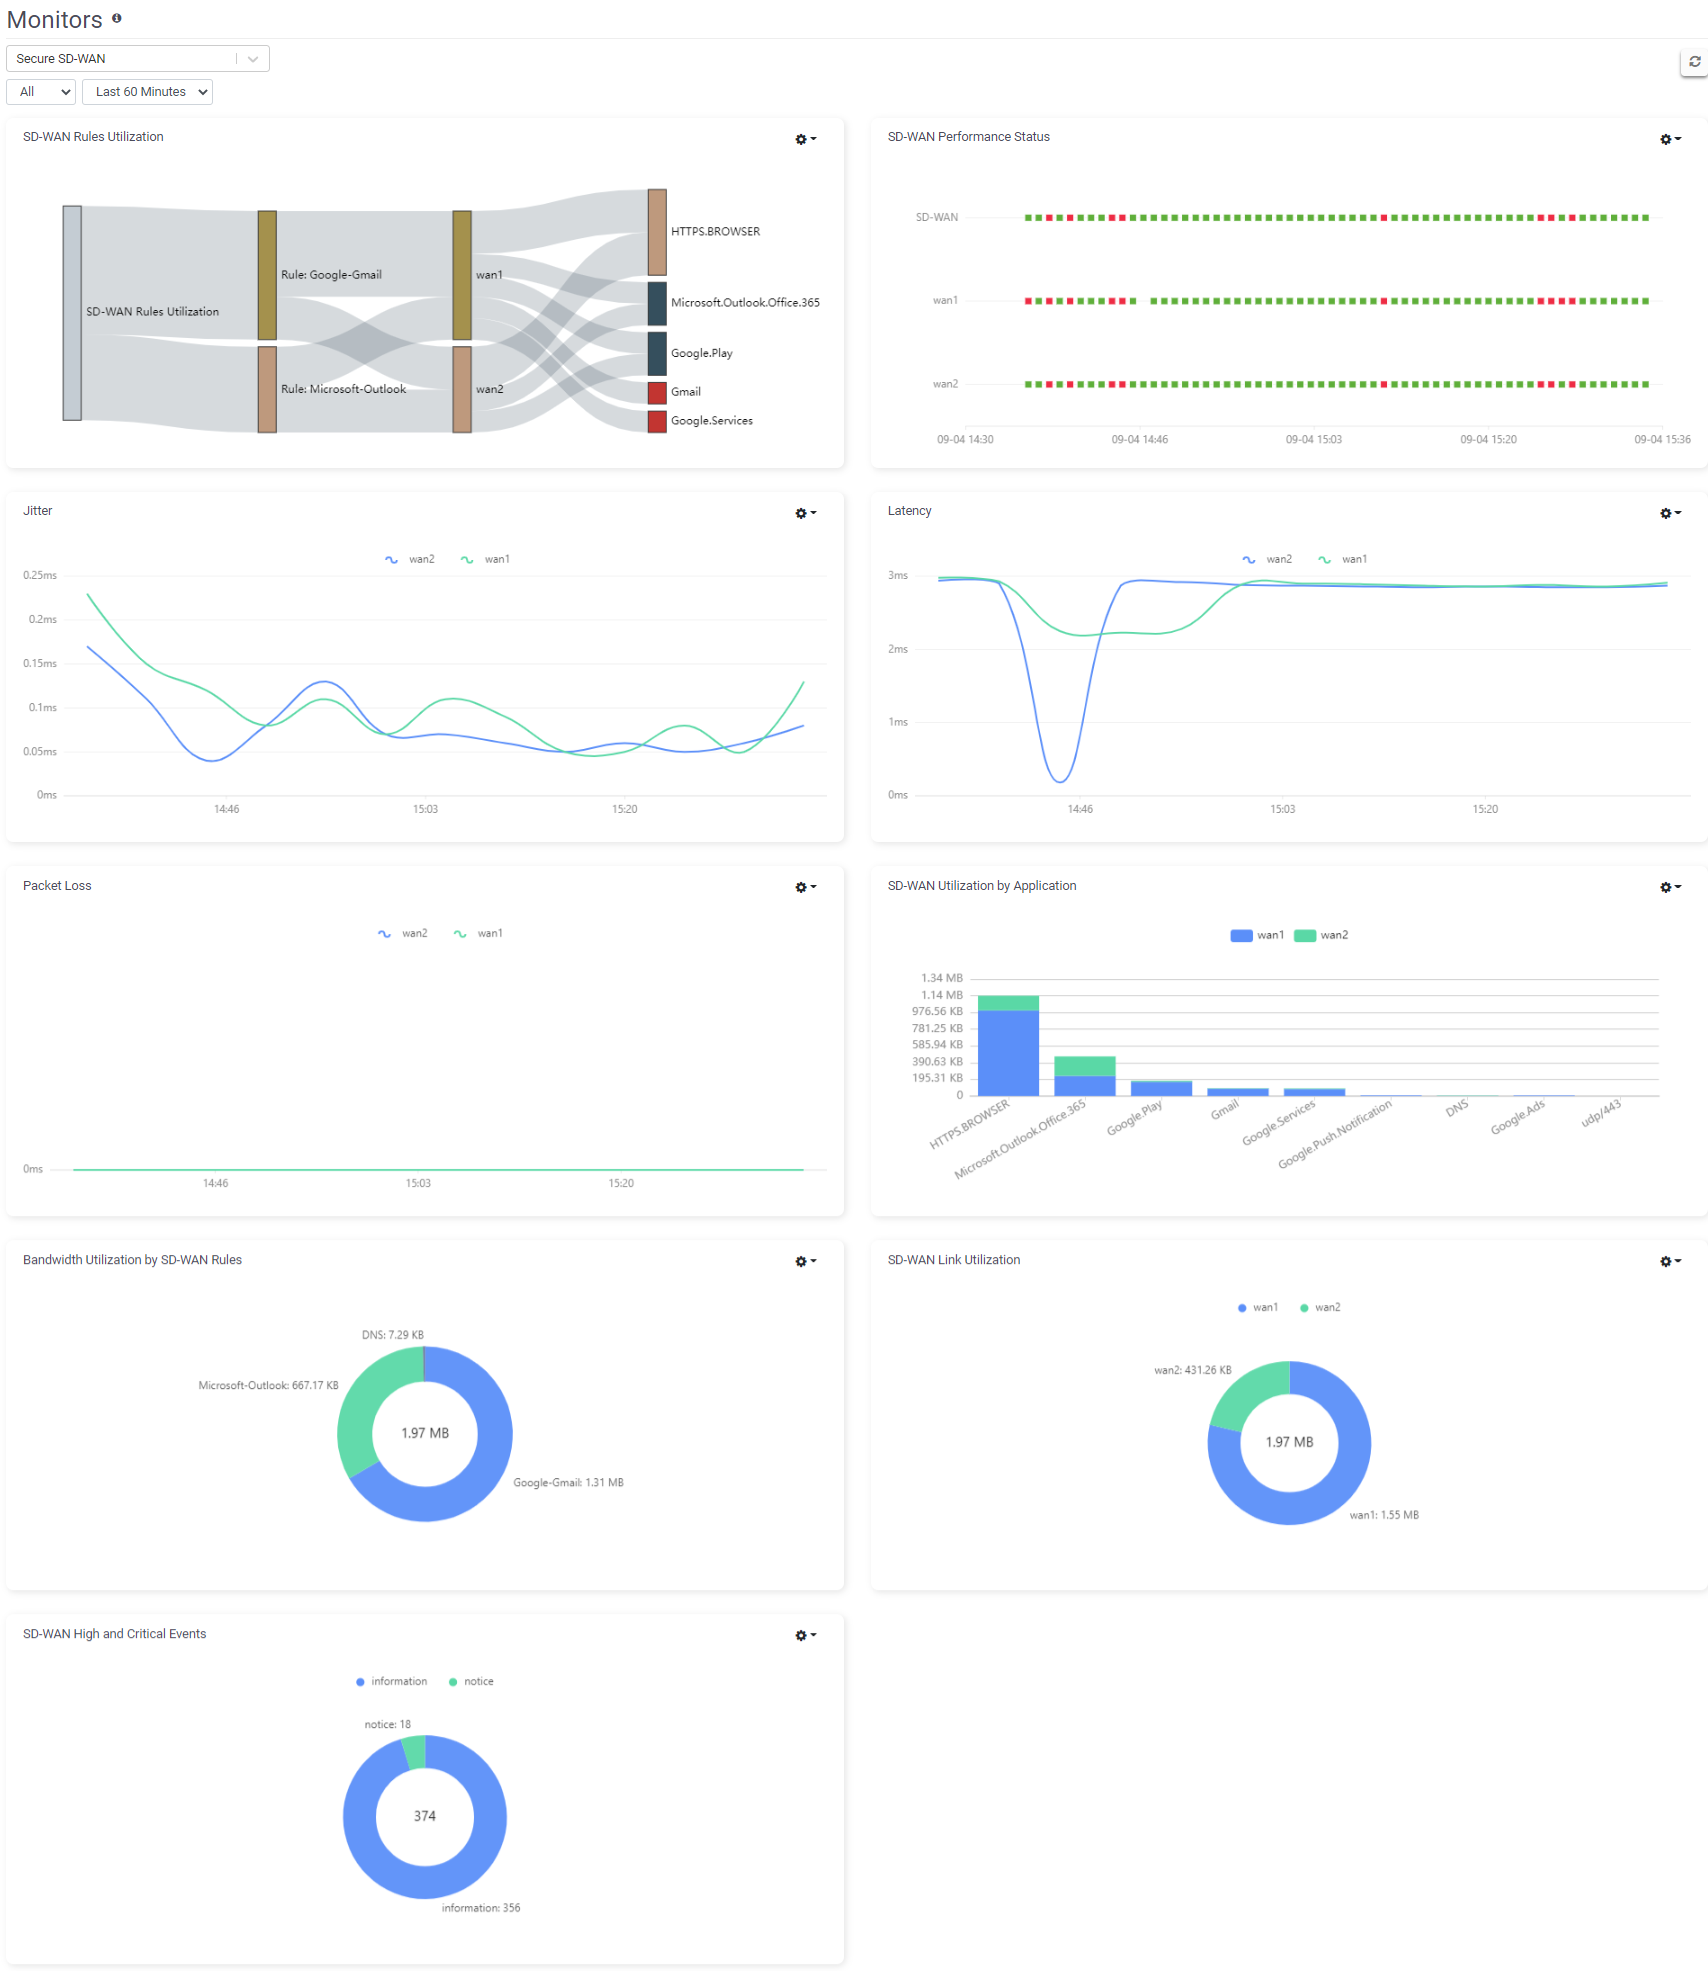
Hover over the widgets to see additional SD-WAN monitoring information. For instance, hover over the SD-WAN Performance Status widget to see the performance status at a time:

|
|
You can zoom in and out of the widgets that display graphs by rotating the wheel. |
Widget settings
Clicking the Settings (![]() ) icon in the title bar of each widget provides the following controls:
) icon in the title bar of each widget provides the following controls:
- Edit—opens a new page with a dialog to edit the widget details.
- Refresh—refresh the widget display.
Drag and drop—select and hold a widget to change its position in the pane.