
Dashboard
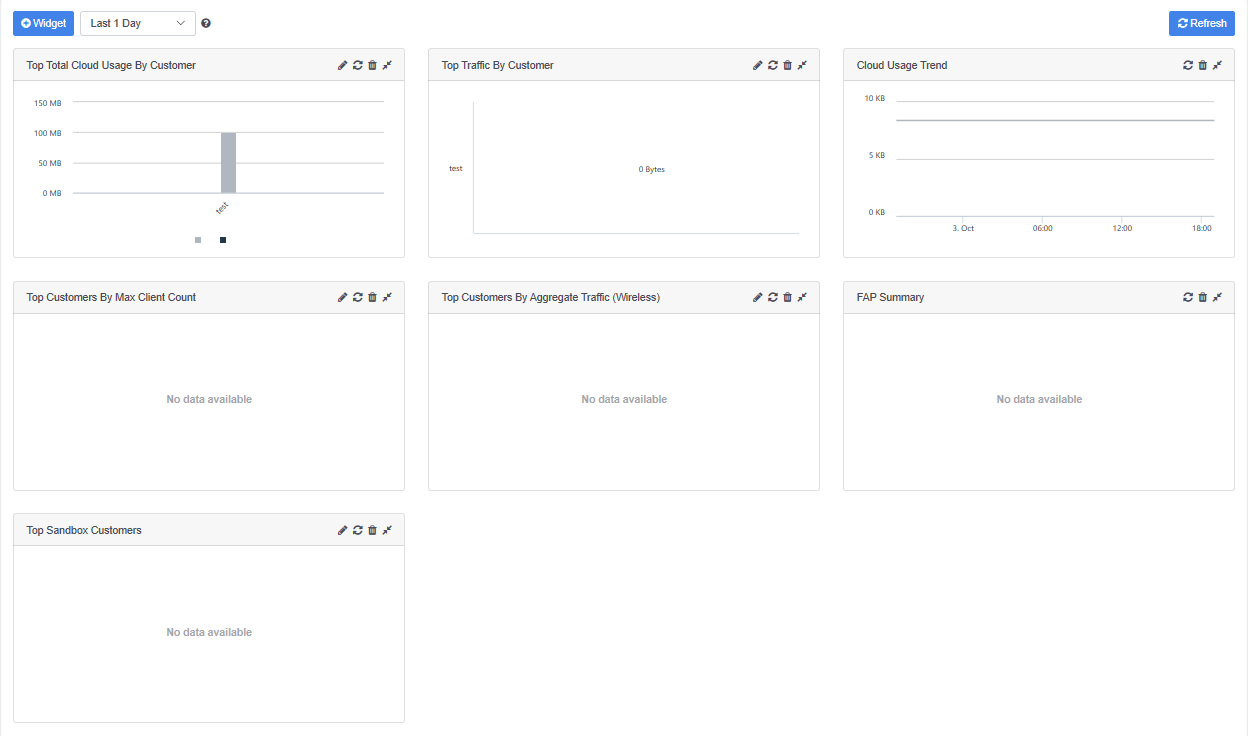
The dashboard displays information about the FortiPortal and is organized as a set of widgets.
Actions available (at the top of the Dashboard page):
- Widget—add a widget to the dashboard
- Filter—filter the data based on time (last 5 minutes, last 30 minutes, last 60 minutes, last 4 hours, last 12 hours, last 1 day, last 7 days, or specify a custom filter)
- Refresh—refresh the display for all of the widgets on the page
The dashboard includes the following default widgets:
- Top Total Cloud Usage By Customer
- Hover your cursor over each customer to view the detailed usage numbers
- Top Traffic By Customer
- Cloud Usage Trend
- Hover your cursor over each customer to view the detailed numbers over the selected usage period
- Top Customers By Max Client Count
- Top Customers By Aggregate Traffic (Wireless)
- Hover your cursor over each customer to view the detailed traffic numbers
- Fortinet Access Point (FAP) Summary
- Select the pie chart to view a list of the FAPs that are up (select the left side) or FAPs that are down (select the right side of the pie chart)
- Top Sandbox Customers
The title bar on each widget provides the following controls:
- Edit Settings—opens a new page with a form to edit the widget details
- Refresh—refresh the widget display
- Delete—delete the widget
- Collapse/Expand—collapses the widget to display only the title bar
- Drag and drop—select and hold the title bar of the widget to change its position on the page