Dashboard
The Dashboard displays the overall events detected by FortiNDR as well as the system status. The Dashboard contains three views: NDR Overview, Malware Overview, and System Status. Users are welcome to add custom dashboards and appropriate widgets tailored for their operations. There are FortiNDR widgets such as Botnet, Attack Scenarios, and Sessions Analyzed to cater to different needs.
The following sections describes the manual and usage in FortiNDR GUI:
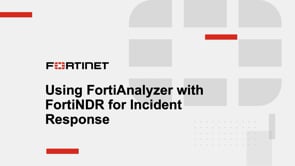
NDR Overview
The NDR Overview dashboard displays the information in the Network Insights as charts and graphs. Each widget can be filtered with a time range of 1 day, 1 week, or 1 month. When you click the Network Insights widgets, such as ML Discovery and Botnet, the widget expands to full screen.
Available sensor(s) can be selected on top right of any widget(s) , it's important to include the sensors you want to view after adding new sensors.
|
Widget |
Description |
|---|---|
|
Device Statistic |
Summarizes information from the Device Inventory dashboard. It displays device statistics for the past day, week, or month, showing the total number of active devices categorized by type. Click the widget to open the Device Inventory dashboard. |
|
Detection/Observation Statistic |
Summarizes security analysis for the past day, week, or month. It shows the number of sessions analyzed and the number of detections and observations detected across those sessions. Detections and observations are categorized by risk level. Click the magnifying glass icon next to the risk level to open the NDR Log page. |
|
Malware Attack Scenarios |
Shows the number of files analyzed over the past day, week, or month, along with the percentage detected as malicious. It categorizes scenarios by risk level. Click the widget to view a breakdown of scenario types for each risk level. You can drill down further to view the Malware Attack Scenario Detail page. |
|
OT Device Statistic |
Displays the number of operational technology (OT) devices detected across various layers of the Purdue Model over the past day, week, or month. Users can view statistics on the top 10 products for deeper insights into device types and activity trends. OT devices not yet assigned a Purdue level are still detected and shown in the inventory, where users can manually set their appropriate Purdue level. |
|
NDR Detection Overview |
Displays a stacked bar chart of detections against the current timeframe selected. |
|
Observation Overview |
Displays a stacked bar chart of observations against the current timeframe selected. |
|
Malware Attack Scenario Overview |
Summarizes the frequency of malware attacks over the past day, week, or month. Each bar in the chart represents a different malware type. It highlights peak attack periods to provide a clear visual of when and what types of malware activity are most prevalent. Click a bar to open the Malware Attack Scenario Details page. |
|
Botnet Connections |
Provides a snapshot of botnet activity over the past day, week, or month. It highlights the total number of botnet connections detected and identifies specific botnet families involved. |
|
FortiGuard IOC |
Displays threats detected over the past day, week, or month. It shows the number of IOCs, threat categories, and muted alerts. |
|
Top Network Attacks |
Displays the most frequent and severe network threats detected over the past day, week, or month. It reports the total number of attacks, including muted detections and their severity levels. Hover over an attack name to view recommended actions. You can also explore the attack name or view attack information in FortiGuard. |
|
Weak Ciphers / Vulnerabilities |
Shows the number of weak and vulnerable instances detected on sniffer port(s) on NDR interfaces over the past day, week, or month. |
|
Notifications |
Displays real-time alerts for new detections. Events appear as they are received, and push notifications are supported. Hover over an alert to view the IP address or drill down to the IP details page. |
|
Top Talkers (Internal) - By Traffic Volume |
Shows internal network traffic over the past day, week, or month. The legend identifies each device pair. |
|
ML Discovery |
Displays machine learning-based event detection results from the past day, week, or month. It shows the number of events, including muted detections, and indicates baseline status. A timestamp at the bottom shows when the ML model was last trained. ML Discovery is visible in Standalone and Center mode. ML Discovery settings are configured and viewed from Center for all sensors. ML Discovery is not available in Sensor mode.
|
|
Top Applications |
Displays the amount of network traffic distributed across various applications over the past day, week, or month. Hover over an application to view the traffic source. |
|
Top URLs Visited |
Displays the most frequently accessed URLs over the past day, week, or month. It lists high-traffic destinations and endpoints with visit counts. |
|
Top Domains Visited |
Displays the most accessed domains over the past day, week, or month. It shows visit counts for each domain, followed by internal IPs and external domains. |
|
Traffic by Protocol |
Provides a visual breakdown of network traffic by protocol over the past day. It features charts for internal and external traffic, segmented by protocol. |
|
MITRE ATT&CK |
Shows the frequency of various cyberattack tactics observed over the past day within an Enterprise or ICS environment. Click on a tactic to view the NDR Detection page where you can access the device and session details. |
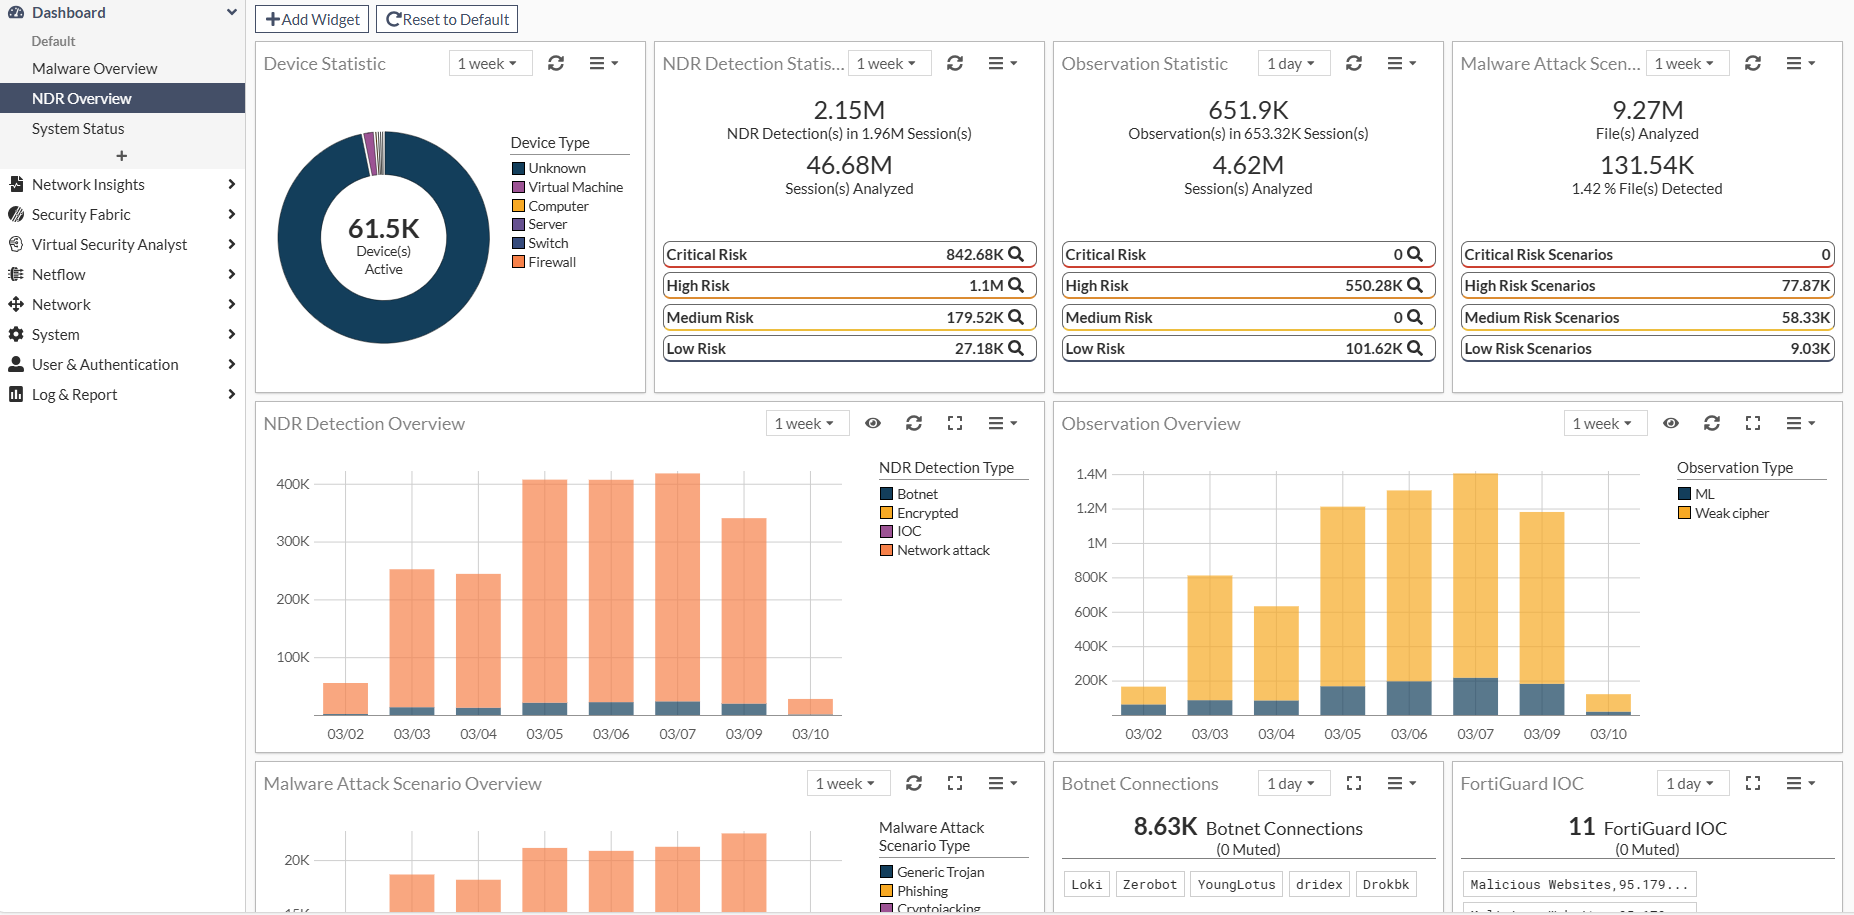
Malware Overview
The Malware Overview dashboard displays information about malware attacks and performance information as charts and graphs.
|
Widget |
Description |
|---|---|
|
Malware Detection Type |
Shows the distribution of threat detections by type over the past hour, day, or week. |
|
Malware Attack Scenario |
Summarizes malware attack types detected over the past day, week, or month. The chart segments represent attack categories and the total number of events. Click a segment in the chart to open the Malware Attack Scenario details page. |
|
Top 10 Learned Feature Type |
Displays the distribution of the top 10 learned feature types, based on the number of features. Each segment corresponds to a specific threat category, with color-coded labels in the legend for easy identification. |
|
Performance Information |
Displays key performance metrics over the past hour, day, or week, including the number of samples detected, processed, and accepted. It also shows the total number of features in use. Additional breakdowns include PE and text files detected, as well as other file types. |
|
Weekly Top 10 Virus Families |
Highlights the most prevalent virus families detected over the past day, week, or month. The names are displayed in varying font sizes to visually represent their relative frequency or impact. |
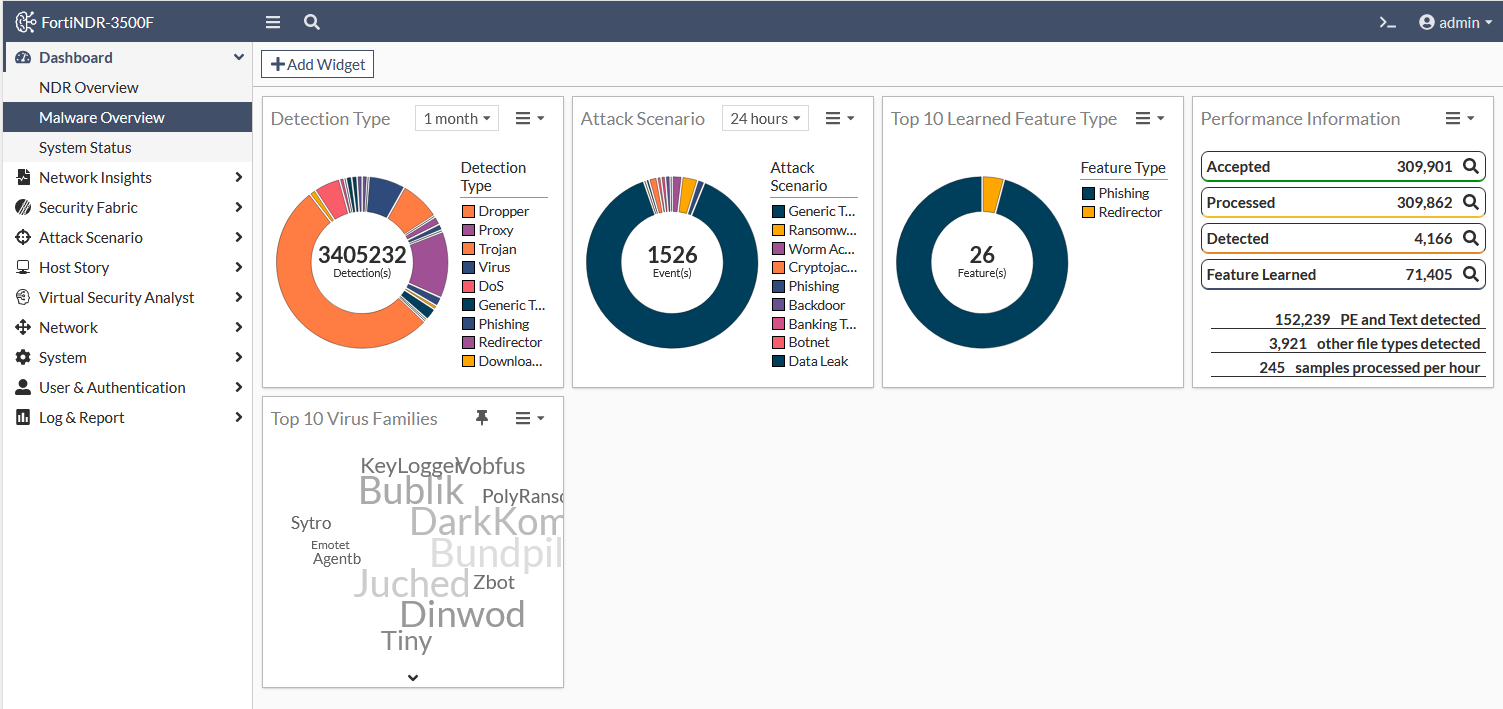
System Status
The System Status dashboard displays information about the FortiNDR device. Use this dashboard to view license information, resource usage, and the processing queue.
|
Widget |
Description |
|---|---|
|
System information |
The System Information widget provides an overview of the FortiNDR device’s operational state and configuration. It displays key details about the device, including its hostname, serial number, firmware version, system time, uptime, disk usage, and the status of features like ICAP, HA, and SNMP. |
|
Licenses |
The Licenses widget displays the status of Fortinet services, indicating which are active and which require attention. Active services are marked with a green checkmark, while inactive services or those with issues are marked with a red exclamation mark. |
|
CPU |
The CPU widget displays real-time CPU usage over 5, 10, and 20-minute intervals. |
|
Memory |
The Memory widget displays real-time memory usage over 5, 10, and 20-minute intervals. |
|
VM Machine |
The VM Machine widget displays licensing and resource allocation details, including license status, expiry date, and the number of vCPUs allocated. |
|
Sample Processing |
The Sample Processing widget monitors the system’s file processing performance. A red dotted line indicates the performance threshold, which is the maximum recommended processing rate for the specific appliance or VM model in use. This threshold is based on the system’s expected capacity as defined in the product datasheet. The performance threshold indicator appears only when the number of accepted files approaches the threshold; it remains hidden when file volume is significantly lower. |
|
Bandwidth |
The Bandwidth widget displays inbound and outbound traffic for port1 (MGMT) over 1-hour, 1-day, and 1-month periods. It shows how much data is being sent and received over time, with traffic levels measured in kilobites per second and plotted against a time-based graph. |
Custom dashboards
You can create a custom dashboard using NDR Overview, Malware Overview and System Status widgets.
To add a widget to a dashboard:
- In the dashboard banner, click Add Widget. The Add Dashboard Widget window opens.
- Click the plus sign (+) next to the widget name.
- Click OK.
The maximum number of widgets for each type of dashboard is as follows:
NDR dashboard: 60 widgets
- Malware: 20 widgets
- System: 30 widgets
- Netflow: 30 widgets
- Custom: 30 widgets
To create a custom dashboard:
- Go to Dashboard and click the Add (+) button below the System Status dashboard. The Create Custom Dashboard Widget pane opens.
- In the Display Name field, enter a name for the dashboard and click Next.
- Select the widgets to add to the dashboard and click Next.
- Review your selections and click Next. The dashboard is added to the navigation pane below System Status.
You can create up to four custom dashboards.
To delete a custom dashboard:
Click the Actions menu next to the dashboard name and click Delete.
Dashboard widgets in Center mode
In Center mode, dashboard widgets are used to monitor the sensors. You can add the same widget for each sensor in your network, allowing you to easily compare the sensor's statistics.
Remember to use the widget settings to include sensors, so their data is displayed in the widgets.
To add a widget in Center mode:
- In the dashboard, click Add Widget.
- In Source Sensor, click the plus (+) sign, then select a sensor from the list and click Close.
- From the Timeframe dropdown, select 1 Hour, 24 hours, 1 Week or 1 Month.
- Click OK.
- (Optional) To add the same widget for a different sensor, click Add Widget and repeat steps 2-4.