
Network Insights
Network Insights monitors display information about NDR detections. The charts in Network Insights can display a maximum of 30,000 insights.
The Network Insights monitors display the following information:
|
Monitor |
Description |
|---|---|
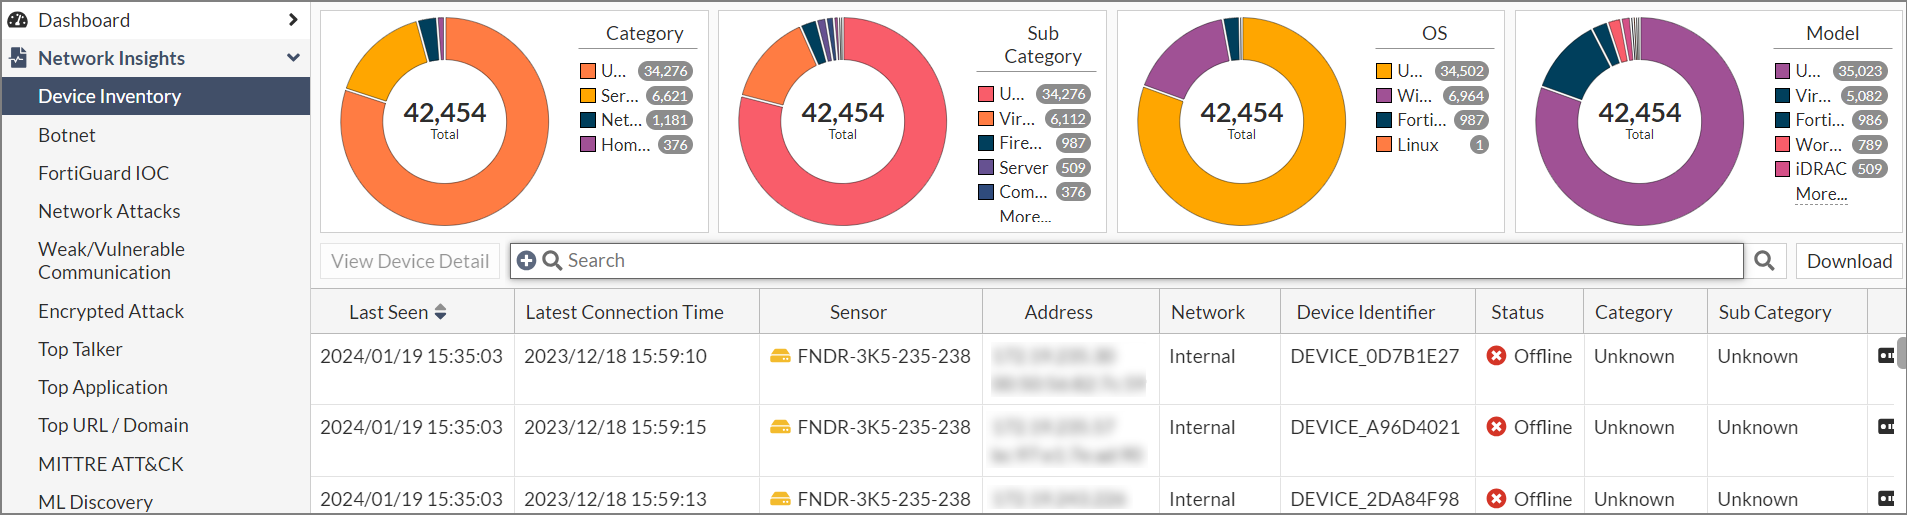
| Device Inventory |
Displays the discovered devices. The priority of devices is from highest to lowest:
The device name in the Device column is determined by the OS_hash of the mac address Status (online/offline). If FortiNDR does not see a session from a device within 60 seconds, the status will be Offline. |
| Botnet | Displays the botnet traffic detections. If there is a known Botnet name, it will be displayed. |
| FortiGuard IOC | Displays suspicious URLs and IPs that are flagged by FortiGuard. This anomaly discovery depends on FortiNDR look up in the FortiGuard IOC service. Apart from URL category (e.g. malicious websites), you will also see an extra information column for any campaign name involved (e.g. Solarwind, Locky Ransomware). |
| Network Attacks | Known attacks detected by the Network Intrusion Protection Database. FortiNDR can detect North-South, East-West IPS attacks depending on where NDR sniffer port(s) are placed. |
| Weak/Vulnerable Communication | Displays the list of weak or vulnerable communication detected on sniffer port(s) on NDR interfaces. Detection of weak and vulnerable communications in the network can be signs of weak or compromised network security (for example, a weak cipher used by an older version of SSL). |
| Encrypted Attack | Displays encrypted attacks that are detected by analyzing JA3 hashes in TLS transactions. FortiNDR will utilize both JA3 client and server SSL fingerprints in detection, resulting in fewer false positive detections. |
| ML Discovery |
Displays a list of anomalies detected by Machine Learning configuration. Each row is based on a session. The configuration and baselining of ML Discovery is located under Virtual Security Analyst > ML configuration. ML discovery is switched ON by default. |
Anomaly, Connection and Session tabs
The Botnet, FortiGuard IOC, Network Attacks, Weak/Vulnerable Communication, Encrypted Attack and ML Discovery monitors contain the Anomaly, Connection and Session tabs. These tabs display the following information:
| Anomaly |
The records in the Anomaly tab are grouped by anomaly types and sensor. Each record may contain different IP pairs. If you display the Destination IP and Source IP columns, you will see the most recent Destination and Source IPs. Double-click a record to open the Anomaly Information pane which contains all the connection pairs. Connections are grouped by destination-source IP pairs. Example: Network Attacks Insights
For more information, see Anomaly tab . |
| Connection |
Shows attacks grouped by Source and Destination IP pairs, and sensor. Example: Botnet Network Insights
For more information, see Connection tab. |
| Session |
Shows granular session information for each attack including the Source and Destination IPs. For more information, see Session tab. |
Common fields
The following fields are shared by all of the Network Insights dashboards:
| Column | Description |
|---|---|
| Latest Timestamp | The date the record was updated. |
| URL Category | The URL category such as Newly Observed Domain or Malicious Website. |
|
IOC |
The Indications of Compromise. |
| Anomaly Severity | The anomaly severity (Not Anomaly, Info, Low, Medium, High or Critical). |
|
Category |
The device category (Unknown, Home & Office, Mobile and Network). |
| Count (Historic) | The total number of times the anomaly was observed. |
| Count (Past week) | The total number of times the anomaly was observed during the past week. |
| First Timestamp | The timestamp for the first time the anomaly was detected. |
| Destination IP | The destination IP. |
| Source IP | The source IP. |
| Data Source | The Interface, Link and Role (if available). |
| Destination Category | The destination category Unknown, Home & Office, Mobile and Network). |
| Destination Model | The model number of the destination device (if available). |
| Destination Network |
The destination network. You can use this column to filter IP addresses based on the category of the IP, such as Internal, External (public addresses), Broadcast, Multicast address, Loopback, Reserved Address and Link-local Address. You can filter for both IPv4 and IPv6 Addresses. |
| Destination OS | The operating system of the destination device. |
| Destination Port | The destination port. |
| Destination Sub Category | The destination sub category (Unknown, IP Phone, Computer, Phone, or Firewall) |
| Destination Vendor | The destination vendor, such as VMware, Dell Inc or Hewlett Packard. |
| Session ID | The session ID. |
| Source Category | The source category (Unknown, Home & Office, Mobile and Network). |
| Source Model | The source model. |
| Source Network |
The source network. You can use this column to filter IP addresses based on the category of the IP, such as Internal, External (public addresses), Broadcast, Multicast address, Loopback, Reserved Address and Link-local Address. You can filter for both IPv4 and IPv6 Addresses. |
| Source OS | The source operating system. |
|
Source Port |
The source port. |
|
Source Sub Category |
The source sub category (Unknown, IP Phone, Computer, Phone, or Firewall) |
|
Source Vendor |
The source vendor, such as VMware, Dell Inc or Hewlett Packard. |