Observation details
The Observation Details page provides an in‑depth view of a specific network behavior detected by FortiNDR Cloud. It summarizes the observation type, explains why it was triggered, and presents a timeline showing how often the behavior has occurred. The page also includes a table listing up to 1,000 recent observation instances with key attributes such as source, destination, confidence level, and risk score to help you investigate patterns and assess severity.
You can adjust the time range by selecting any 90‑day period within the past year using the date picker. To view observation details for a specific device, enter its IP address in the Device IP to search field. To filter by confidence level, choose All, H, M, or L (Low, Moderate, or High).
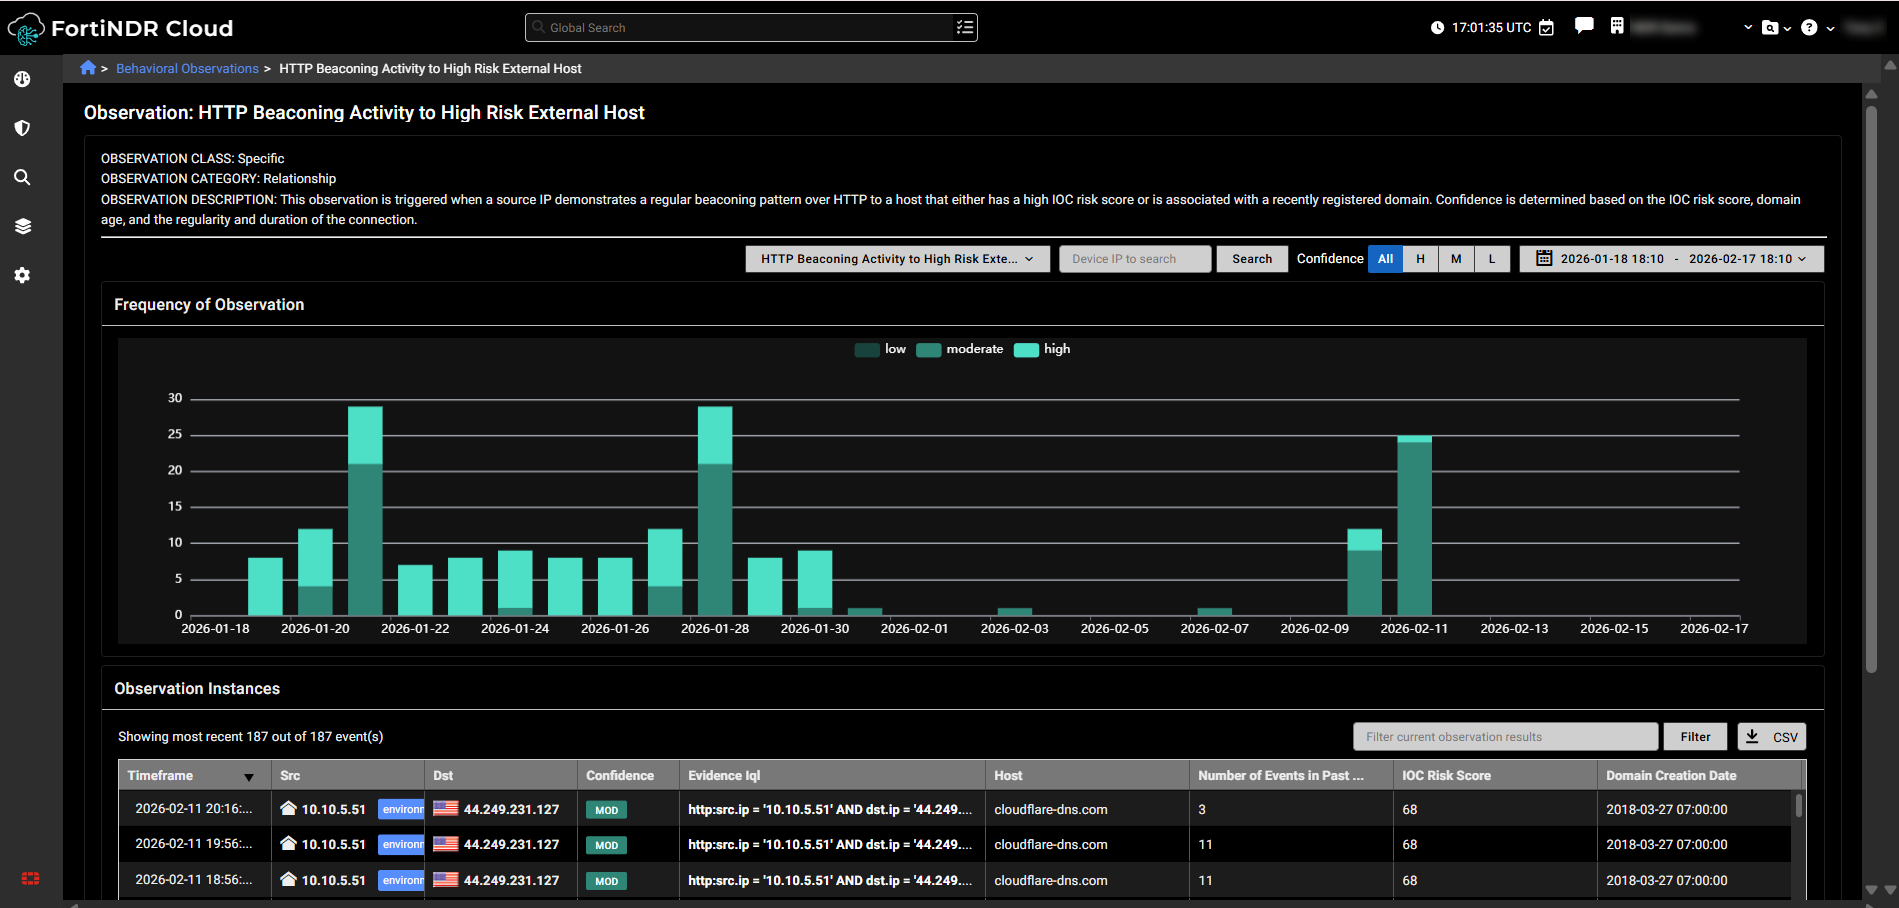
Frequency of observation graph
The Frequency of Observation graph shows how often a specific observation has occurred over time, categorized by confidence level.
- Hover over the graph to view the number of instances by confidence level.
- To filter the table, click a confidence level (Low, Moderate, or High).
- Click on a bar in the graph to apply its time range and confidence filter to the page.
- Hover over a confidence level at the top of the graph to isolate it.
Observation instances table
The Observation Instances table displays the most recent instances for the selected observation, up to 1,000 entries.
- Click any column header to sort the table by that column.
- To refine the table, enter a search term in the Filter current observation results field and click Filter.
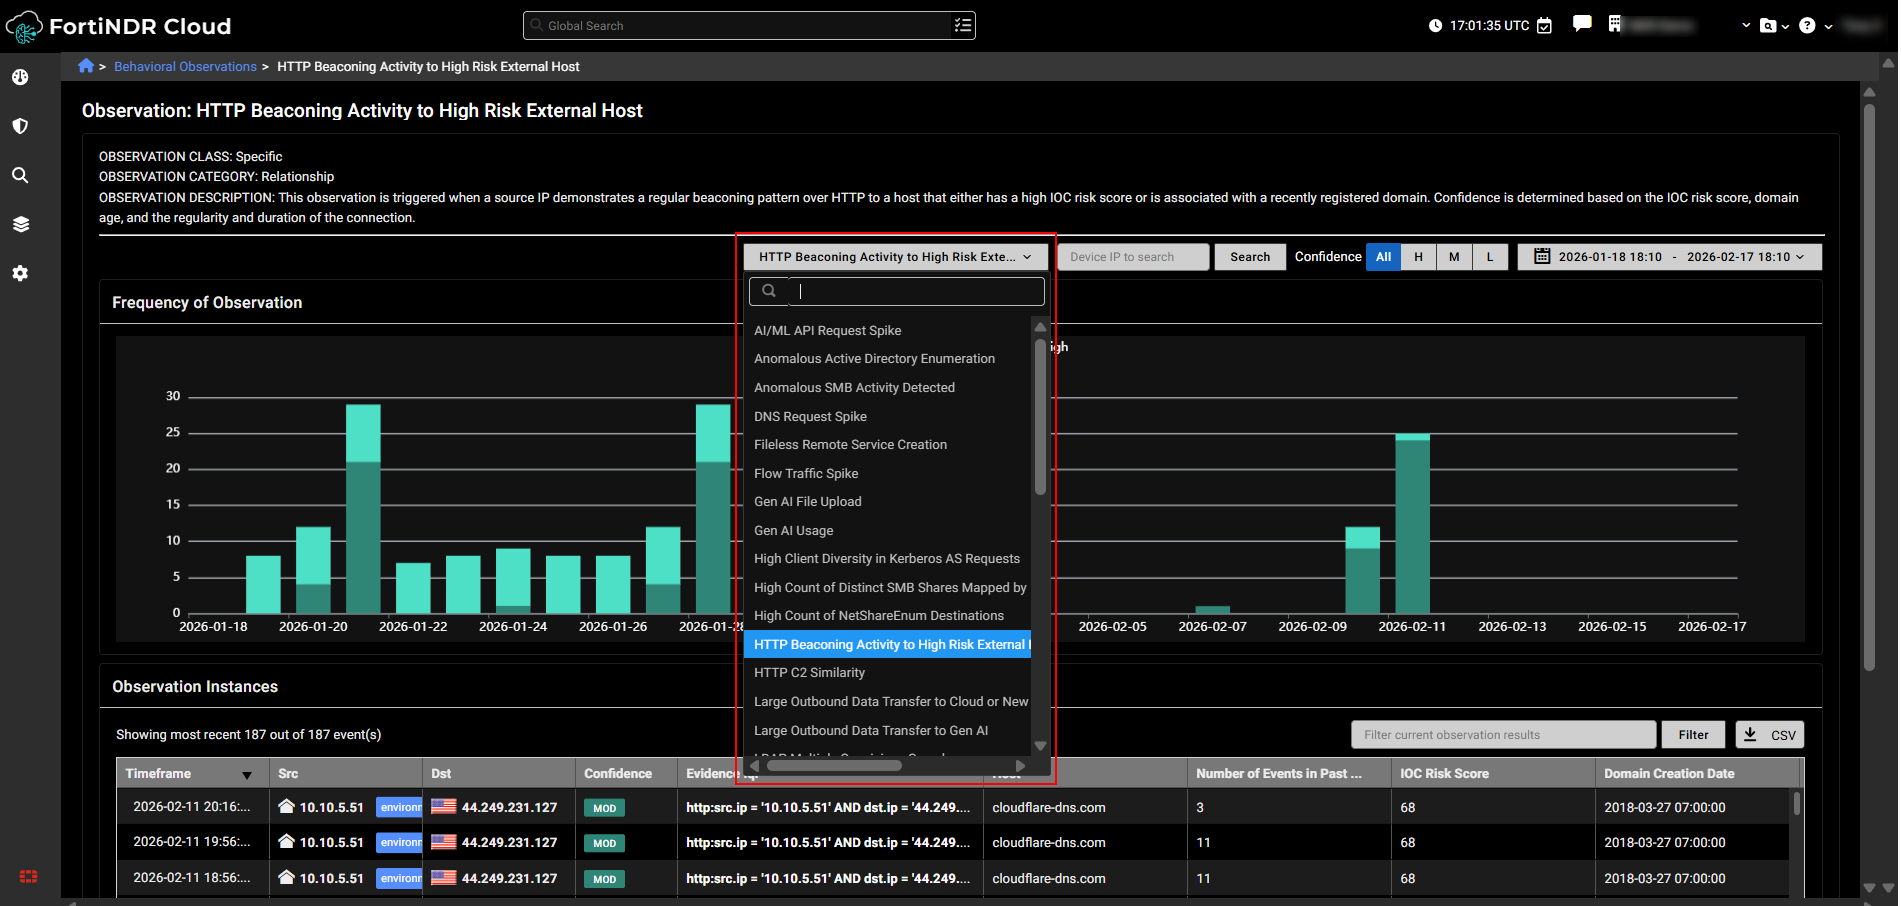
Observation selector
Use the observation selector at the top-center of the page to switch between different observations available for your account.