Triage detections
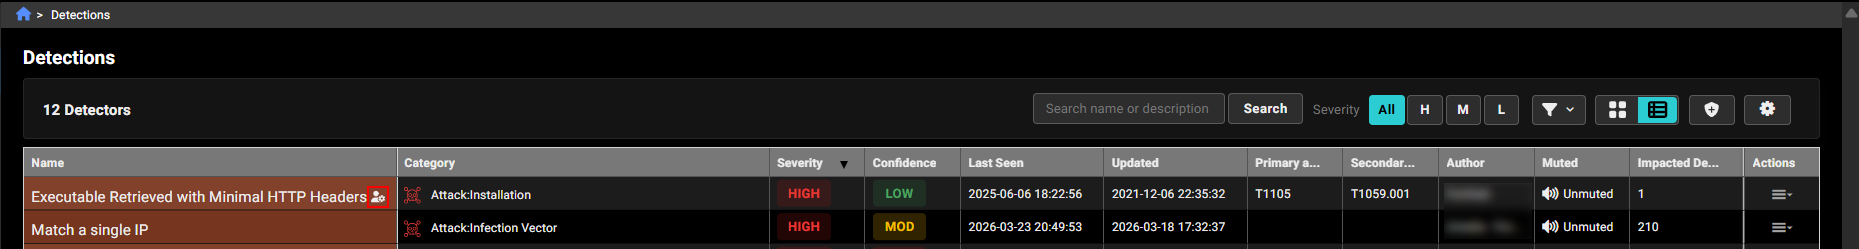
The Triage Detections page displays all Active detectors in your account. Use this page to review and respond to detections triggered by the detector. Each row in the page displays a single detector with at least one active detection. Once all detections for a detector are resolved or muted, the detector's status is automatically updated from Active to Idle. You can create a filter to view all detectors and detections regardless of their status.
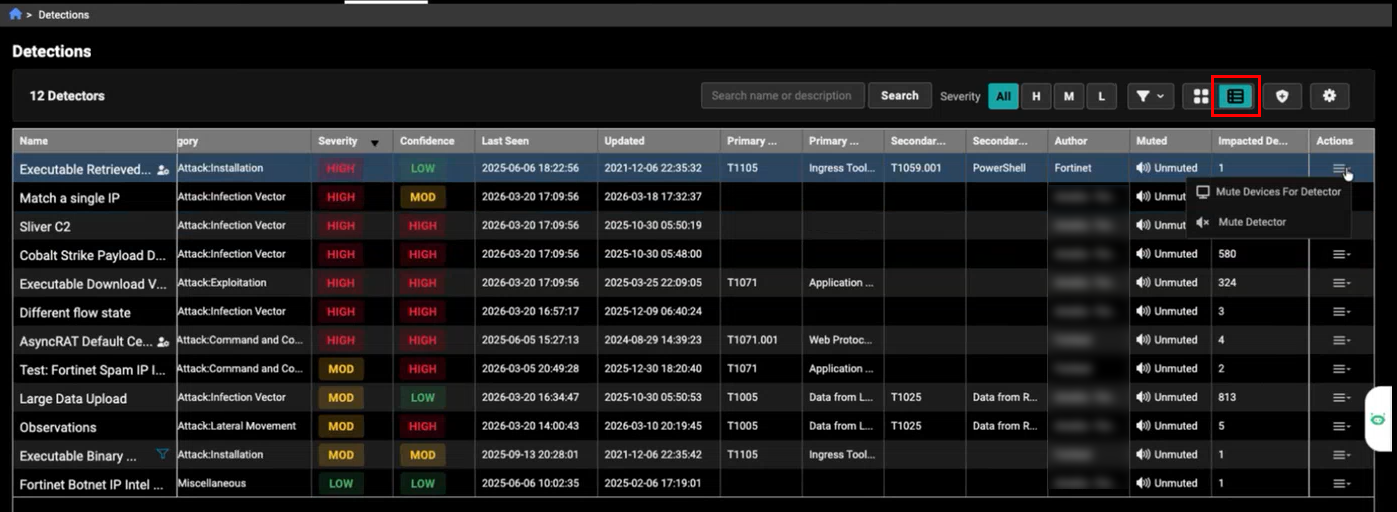
Table view is the default layout for displaying detections. Table View presents detections in a compact, row‑and‑column format for easier sorting and comparison. Each detection appears as a single row with detailed fields such as name, category, severity, confidence, timestamps, author, mute status, and impacted devices. This view is useful when you need to quickly scan large amounts of data, sort by specific columns, or perform detailed analysis across multiple detections.
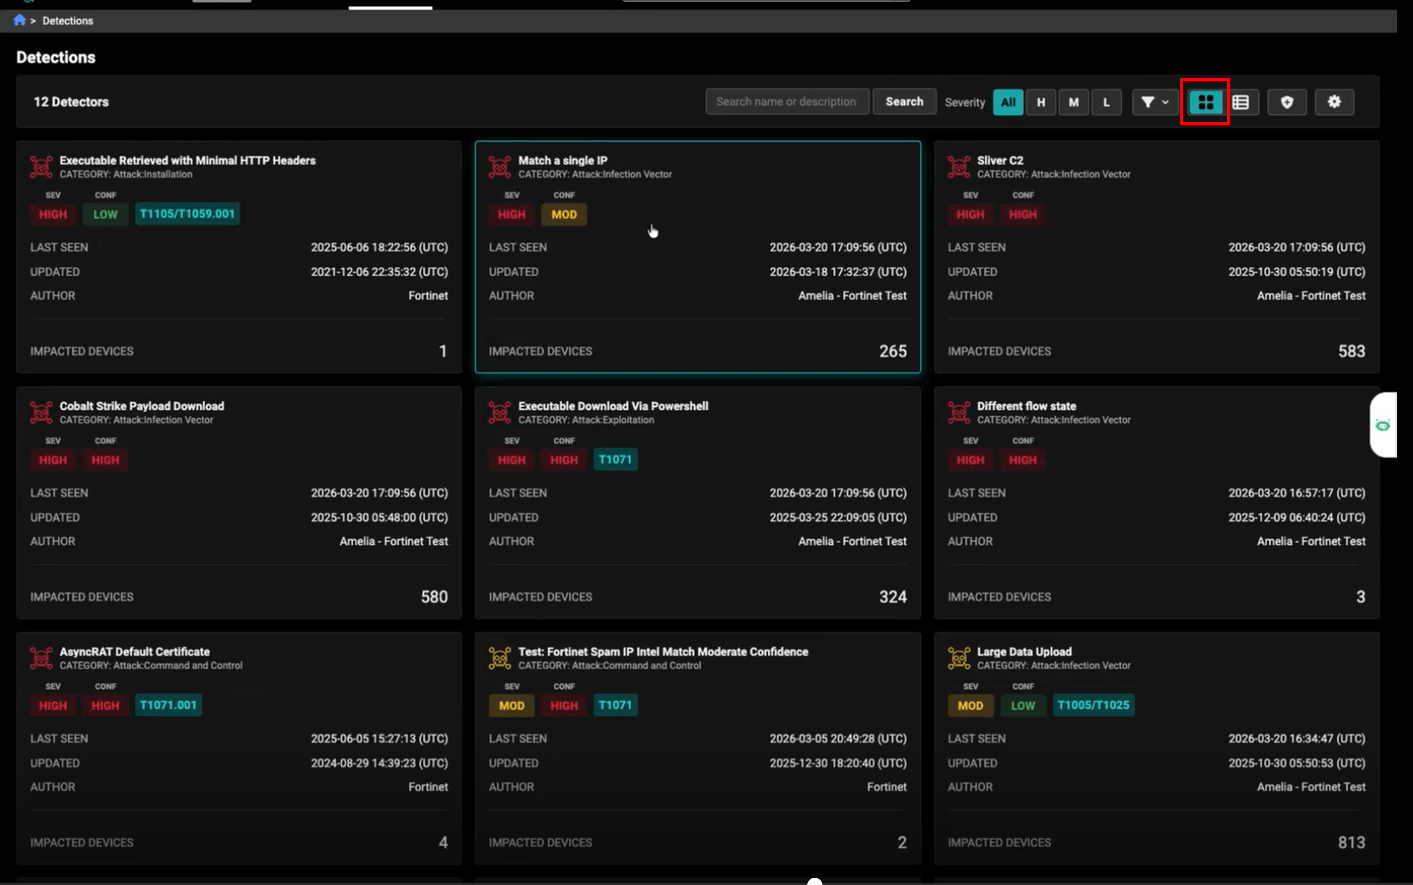
Gallery view presents each detection as a card in a grid, showing key information such as the detection name, severity, category, last‑seen time, and impacted devices. This view makes it easy to scan multiple detections quickly and identify the most important items at a glance.
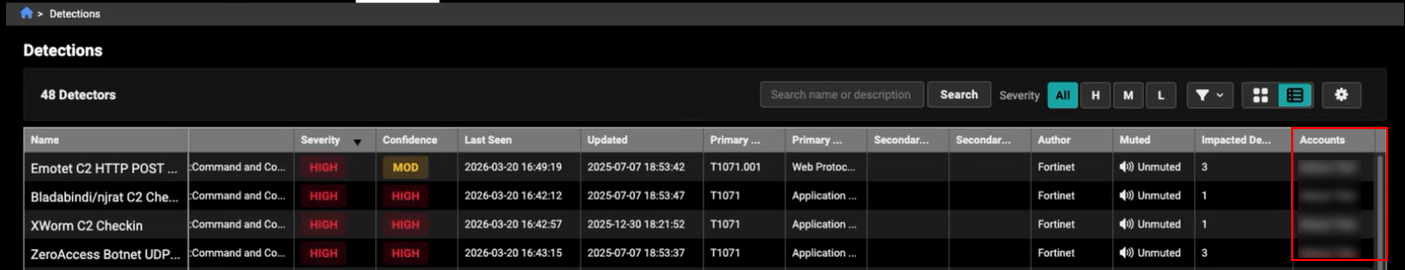
When the All accounts view is enabled, the Accounts column appears and shows all accounts a detector is running on. For detectors that run on a single account, the column displays that account name. For detectors running across multiple accounts, hovering over the value opens a tooltip listing all associated accounts.
The Triage Detections page displays the following information:
| Name | The detector name. | ||||||||||||
| Category |
There are three categories for detectors: Attack, Potentially Unwanted Application (PUA), and Posture. Each category contains a more detailed subcategory. For more information, see Detector Categories. |
||||||||||||
| Severity |
The severity measures the potential impact to the confidentiality, integrity, or availability of information systems and resources if the activity is confirmed to be a true positive. Severity can be assigned to one of the following values:
|
||||||||||||
| Confidence |
Confidence measures how likely events matching the detector’s query are indicative of the activity specified in the detector description. A detector's confidence indicates its minimum true-positive detection rate.
FortiGuard Lab assigns a detector's initial confidence based on its performance during testing. Once deployed, detectors are monitored for changes in their true-positive detection rate, which is based on the resolution state chosen by an analyst when resolving a detection. Once a detector crosses a higher or lower threshold, it is reviewed to determine whether it should be tuned or whether the confidence should be modified. |
||||||||||||
| Last Seen | The UTC date and time when the last known event tied to the detector was observed. This is useful when determining when the most recent change to a detector has occurred. | ||||||||||||
| Author | The account that authored the detector. | ||||||||||||
| Impacted Devices | The internal IP address in the src.ip or dst.ip fields used to generate detections. This field is configurable. |
||||||||||||
| Status |
By default, every detection is in an Active state upon creation. Active detections generate a notification (see Email notifications), but Muted detections will not. Detections remain Active until they are resolved manually by an analyst or automatically based on the detector's Resolution Period. Once resolved, their status changes to Resolved.
|
Toolbar
|
Option |
Description |
|---|---|

|
View the page as a gallery. |

|
View the page as a table. |

|
Create a detector |

|
Settings:
Actions:
|
Detector Categories
| Category | Subcategory | Description |
|---|---|---|
| Attack | Infection Vector | Attacks in the initial stages before an exploit attempt has been made or malicious code has been executed. Examples include downloading a malicious executable file, navigating to a web site that is known to redirect to exploitation servers, or an attempt to authenticate to an SSH server from a malicious host. |
| Attack | Exploitation | Attacks in the process of exploiting known vulnerabilities such as those listed in MITRE’s Common Vulnerabilities and Exposures (CVE) list. While FortiNDR Cloud may be unable to determine the success of a launched exploit, any hosts attempting exploits (that are not approved internal scanners) should be investigated for signs of compromise. |
| Attack | Installation | Installation of malicious software (staging) for persistence in an environment. For example, the Cobalt Strike staging tool downloading a Beacon backdoor over HTTP in order to provide persistence on a compromised host and run further post-exploitation commands. |
| Attack | Lateral Movement | Tools and techniques commonly used by attackers to pivot from a compromised host to other assets within the environment. Such tools may also be legitimately used by system administrators but should be investigated, especially for hosts from which this activity has not be observed before. |
| Attack | Command and Control | Command and control traffic between compromised hosts and attacker infrastructure. |
| Attack | Exfiltration | Data exfiltration from compromised assets to external entities. |
| Attack | Discovery | Tools and techniques commonly used by attackers to identify accesible hosts and services. Such tools may also be legitimately used by system administrators but should be investigated, especially for hosts from which this activity has not be observed before. |
| Attack | Impact | Malware or behavior intended to disrupt the business, such as distributed denial of service (DDoS) and ransomware attacks. |
| PUA | Adware | Malware characterized by its use of advertisements to generate revenue for the author. Adware is often installed alongside third-party applications and remains on a system as a browser add-on or self-proclaimed optimization software. Most adware is considered low risk due to its innocuous nature. |
| PUA | Spyware | Malware characterized by its focus on gathering device and user information without the user’s knowledge. This information is usually sent back to the authors for a variety of purposes, ranging from market research to targeted monitoring. Spyware is usually installed alongside third-party applications and persists on a system as a backdoor or as software that purports to be useful. Most spyware is considered low risk due to its historical use for low-impact data collection and advertising. |
| PUA | Unauthorized Resource Use | Applications that utilize system resources without a user’s knowledge or consent. Such applications are usually installed alongside third-party applications or as a component of malware in order to monetize a successfully compromised host (for example, via click fraud or cryptocurrency mining). |
| Posture | Potentially Unauthorized Software of Device | Applications or devices that circumvent organizational policies or increase the attack surface of an organization. These detectors cover various applications that may be used to bypass monitoring tools and access controls, or store sensitive information in unauthorized locations. This category also includes tools that may be legitimately used for system administration, development, or penetration testing, but are also commonly used by attackers to enumerate access and pivot within a compromised environment. |
| Posture | Insecure Configuration | Configurations within an environment that make it more vulnerable to exploitation or post-exploitation techniques used by attackers. Such configurations include outdated software, use of deprecated cryptographic standards, or configurations resulting in data leakage. |
| Posture | Anomalous Activity | Network activity that is abnormal and should be investigated to determine its cause. The activity may be malicious in nature or a misconfiguration that may or may not have security implications. |
Viewing and filtering detections
To view the Triage detections page:
- Go to Detections > Triage detections. The Detections page opens.
- (Optional) Filter the detections on the page.
Search Enter the technique ID, technique name or technique description.
Detectors are filtered based on the prefix matching the selected technique ID. If Technique T1234 is entered, the detectors returned include its sub-techniques T1234.001, T1234.002, T1234.003, etc.
Severity Select High (H), Medium (M), or Low (L).
Additional Filters Click the filter icon to view additional filters.
Filter
Description
Category Filter the detectors by category. See, Detector Categories. Assigned to
Filter by assigned detections. See, Assigning detections.
Created By Filter by the account that created the detector. Sensors
This filter displays all sensors in the account. The dropdown is divided into two groups: online sensors appear at the top, while other statuses are listed below.
Technique Filter by the technique used for the detection. Confidence Select High (H), Medium (M), or Low (L).
Detector Stat Select All, Active or Idle.
All
Returns all detections the user has access to regardless of whether or not it was triggered in the current account.
Active Returns all active detections. Idle Returns all detections that have been triggered in the current account but are not currently active. Muted Select Unmuted or Muted. See, Muting . Disabled Select Enabled or Disabled. See, Disabling detectors. Custom Filters
Finds detectors with a custom filter in the query.
Custom Resolution Method
Filter by the Automatic Resolution Period.
Order By Order the detectors by Impacted Devices, Muted Devices, Severity, Confidence, Category, or Last Seen. - Click a detector to open the Details page. The following information is displayed:
Category
The attack category.
First Seen
The UTC date and time the first event associated with the detection occurred.
Last Seen
The UTC date and time of the last known event tied to the detector was observed.
Updated
The UTC date and time the detector was modified.
Resolution Method
Automatic: The detection will be resolved if events containing the same host and sensor ID are not observed for the specified time period.
Manual: The detection will remain active until an analyst resolves the detection.
MITRE ATT&CK
The MITRE ATT&CK ID.
Primary Technique
The primary attack name and ID.
Specificity
Behaviors
The behavior coverage.
Description A description of the detection. You can use this description to search for detections. See, Searching for detections with the detector description
Next Steps Recommendations to resolve the detection. Show Matching Events Click to view the Entity Lookup. Author The detector author. Impacted Device The fields used to generate the detection. The internal IP address in the src.ipordst.ipfields is the default.Indicator Fields The indicators the detector uses to generate the detection.
This information is useful for identifying related activity and tracking indicators over time.
Detectors can define up to five fields to extract indicators from, and each detection can store up to five unique indicators for each indicator field.
Impacted devices The active detections for the detector. All Active defections are displayed by default. You can create a filter to view Muted or Resolved detections. See, Impacted Devices.
You can use this tab to resolve detections or to search for a device by IP.
Query This tab displays the IQL query defined for the detector. You can use a query string to create a custom detector. See, Adding custom filters to detectors.
Events This tab displays all of the events that have matched the detector's query.
Left-click on an entity to open the Entity Panel.
Right-click a field to open its menu (for example, Search Events, Targeted Search and Copy to Clipboard).
Hover a column header to lock, sort or arrange the columns.
These events are duplicates of the original matching event. When an event matches a detector's query, a copy is created and added to the detector's list of Latest Events so the event remains associated with the detector.
This list can display up to the last 1000 matching events. Events could remain in the list in perpetuity if the detector rarely fires.
Indicators This tab displays the field value extracted from a detection's event(s) as defined by the detector.
This information is useful for identifying related activity and tracking indicators over time. Detectors can define up to five fields to extract indicators from and each detection can store up to five unique indicators for each indicator field.
Searching for detections with the detector description
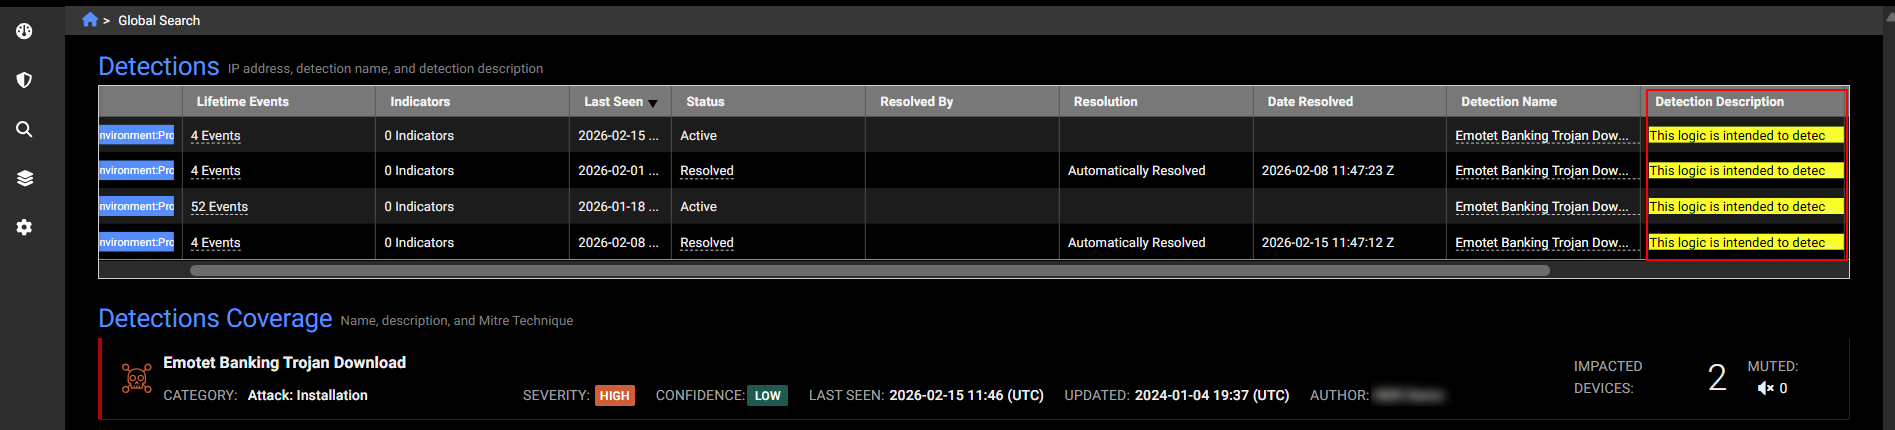
You can use text of the detector description to search for detections. Copy and paste the description text into and Global Search field and click Enter.
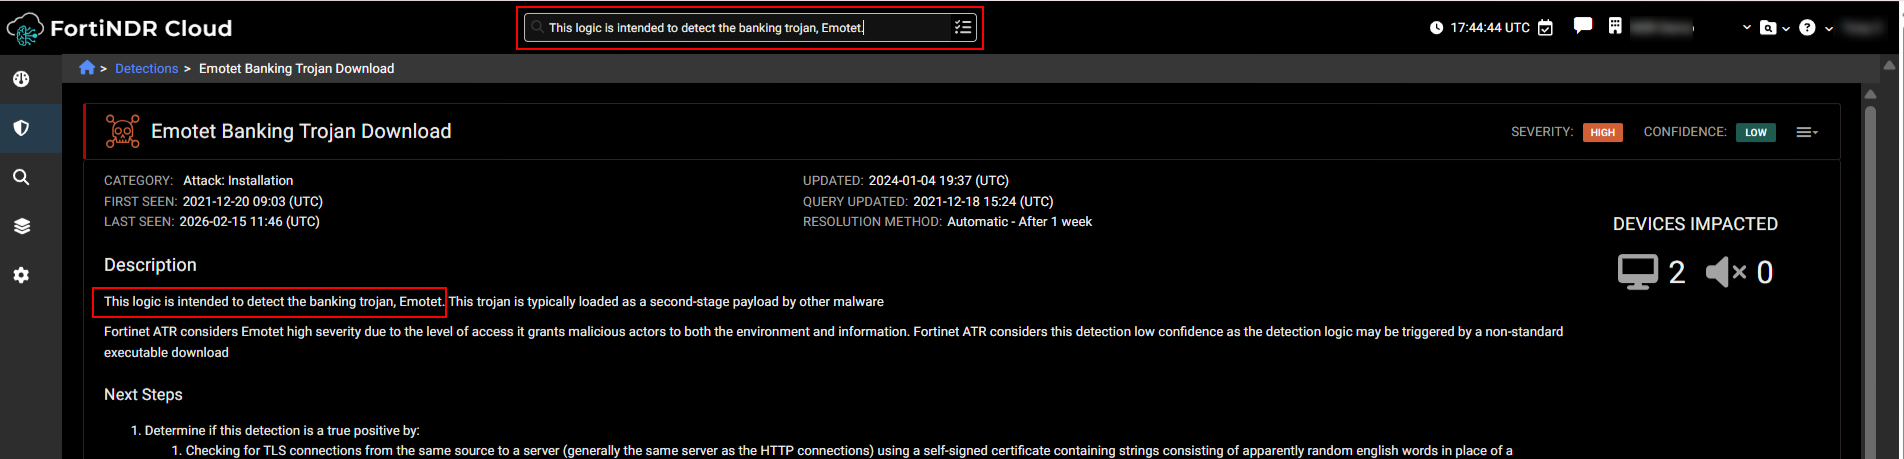
Search results will be highlighted in the Detection Description column of the in the Detections section of results.
Impacted Devices
|
Column |
Description |
|---|---|
| Device IP |
The device IP address. |
| DHCP Hostname |
The DHCP lease hostname. |
| Username |
The device username. |
| Hostname |
The device hostname. |
| MAC Address |
The device MAC address |
| Lifetime Events |
The number of events over the device lifetime. Click the link to drill down to the earliest events. |
| Indicators |
The number of indicators of compromise. Click the link to view the indicators associated with the device IP. |
| First Seen |
The date the event was first seen. |
| Last Seen |
The date the event was last seen. |
| Created |
The date the event was created. |
| Updated |
The date the event was updated. |
| Sensor ID |
The sensor ID. Hover over the ID to view the sensor information and annotations. Tags associated with the sensor are displayed within the column. Click the ID to open the Sensor Details page. |
| Account |
The account the device belongs to. |
| Status |
The detection status (Active, Muted or Resolved). See Detections. |
| Muted by |
The user who muted the detector. |
| Date Muted |
The date the detector was muted. |
| Resolved by |
The user who resolved the detection. |
| Resolution |
The resolution description. |
|
Date Resolved |
The date the detection was resolved. |
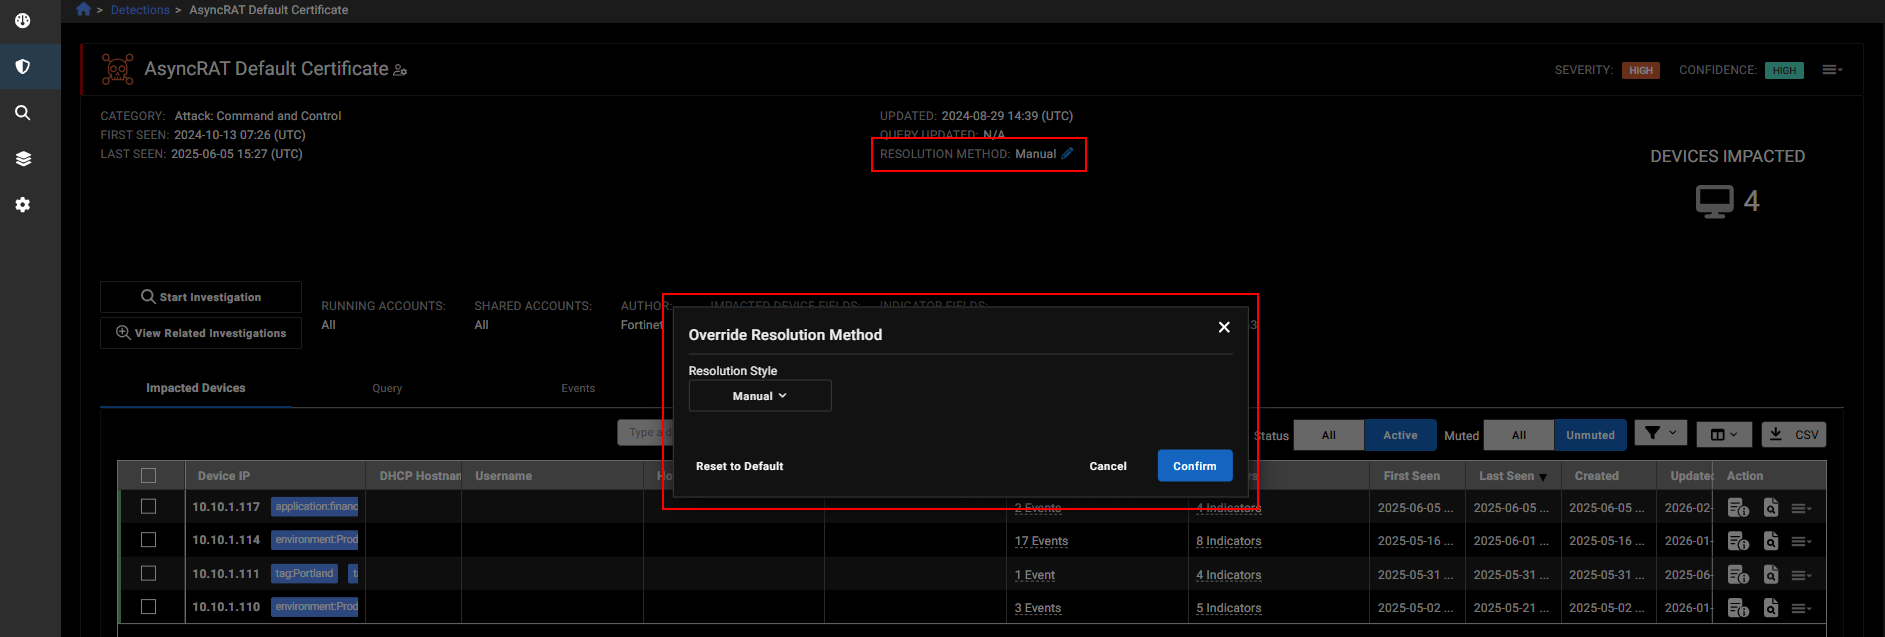
Overriding the default resolution method and time
You can override the default resolution method and resolution time for detectors that were created by another account. Each detector includes an edit option that lets you update the resolution method (automatic or manual) and adjust the resolution time. You can also restore the original settings defined by the detector’s creator if needed.
This option is available only for detectors your account did not create. For detectors created by your account, the override option is hidden.
When a detector has a overridden resolution method, an override indicator appears both in the detector header and in the list view, similar to the existing custom filter icon.
To override the resolution method:
- Go to Detections > Triage detections and open a detector created by another account.
- Next to Resolution Method, click the pencil icon. The Override Resolution Method dialog opens.
- Configure the Resolution Style and click Apply.