
Version 26.1.b
New functionality
DPI Payload
DPI payload capability is now available for sensors running version 2.5.0 or later. This ASCII representation helps determine whether traffic is malicious or benign. In the Sensor Details page, the Packet Inspection Engine settings now include additional options for DPI Payloads and DPI File Scanning.
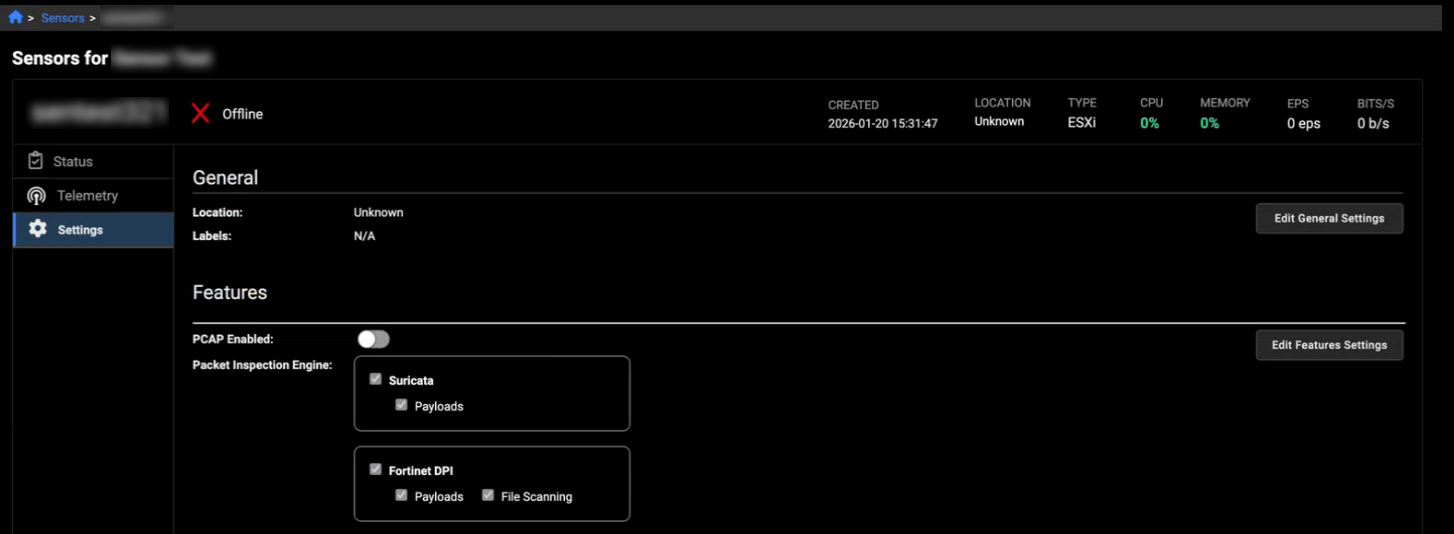
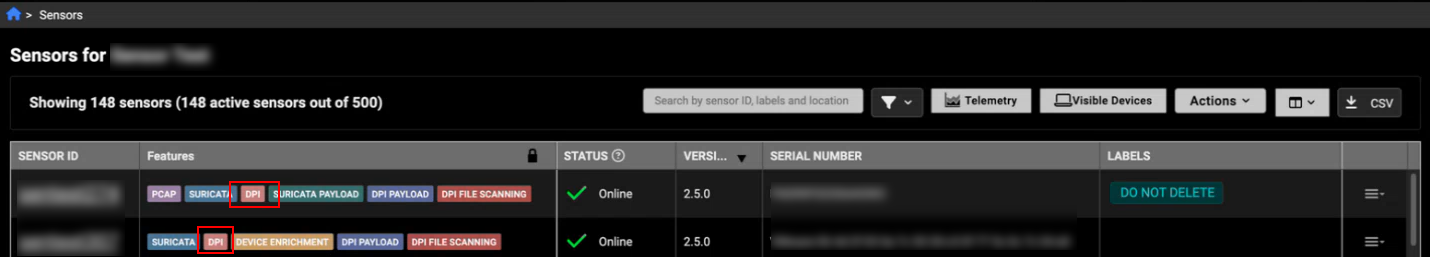
When these features are enabled, they appear in the Features column of the sensor list, allowing you to quickly see whether payload inspection or file scanning is active without opening the full sensor configuration.
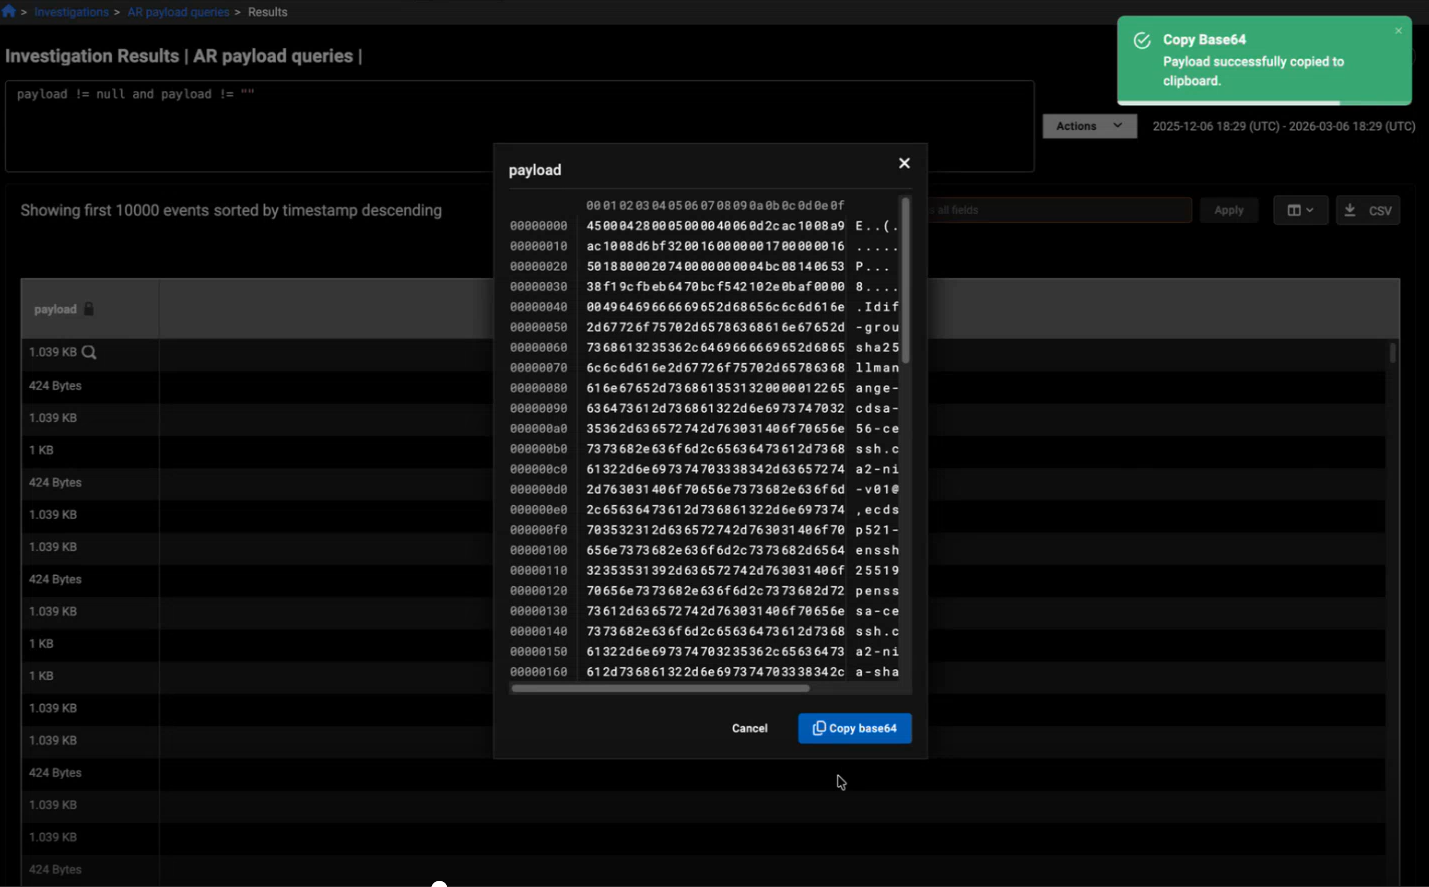
A new Payload field has also been added to the investigation results.
Detections details
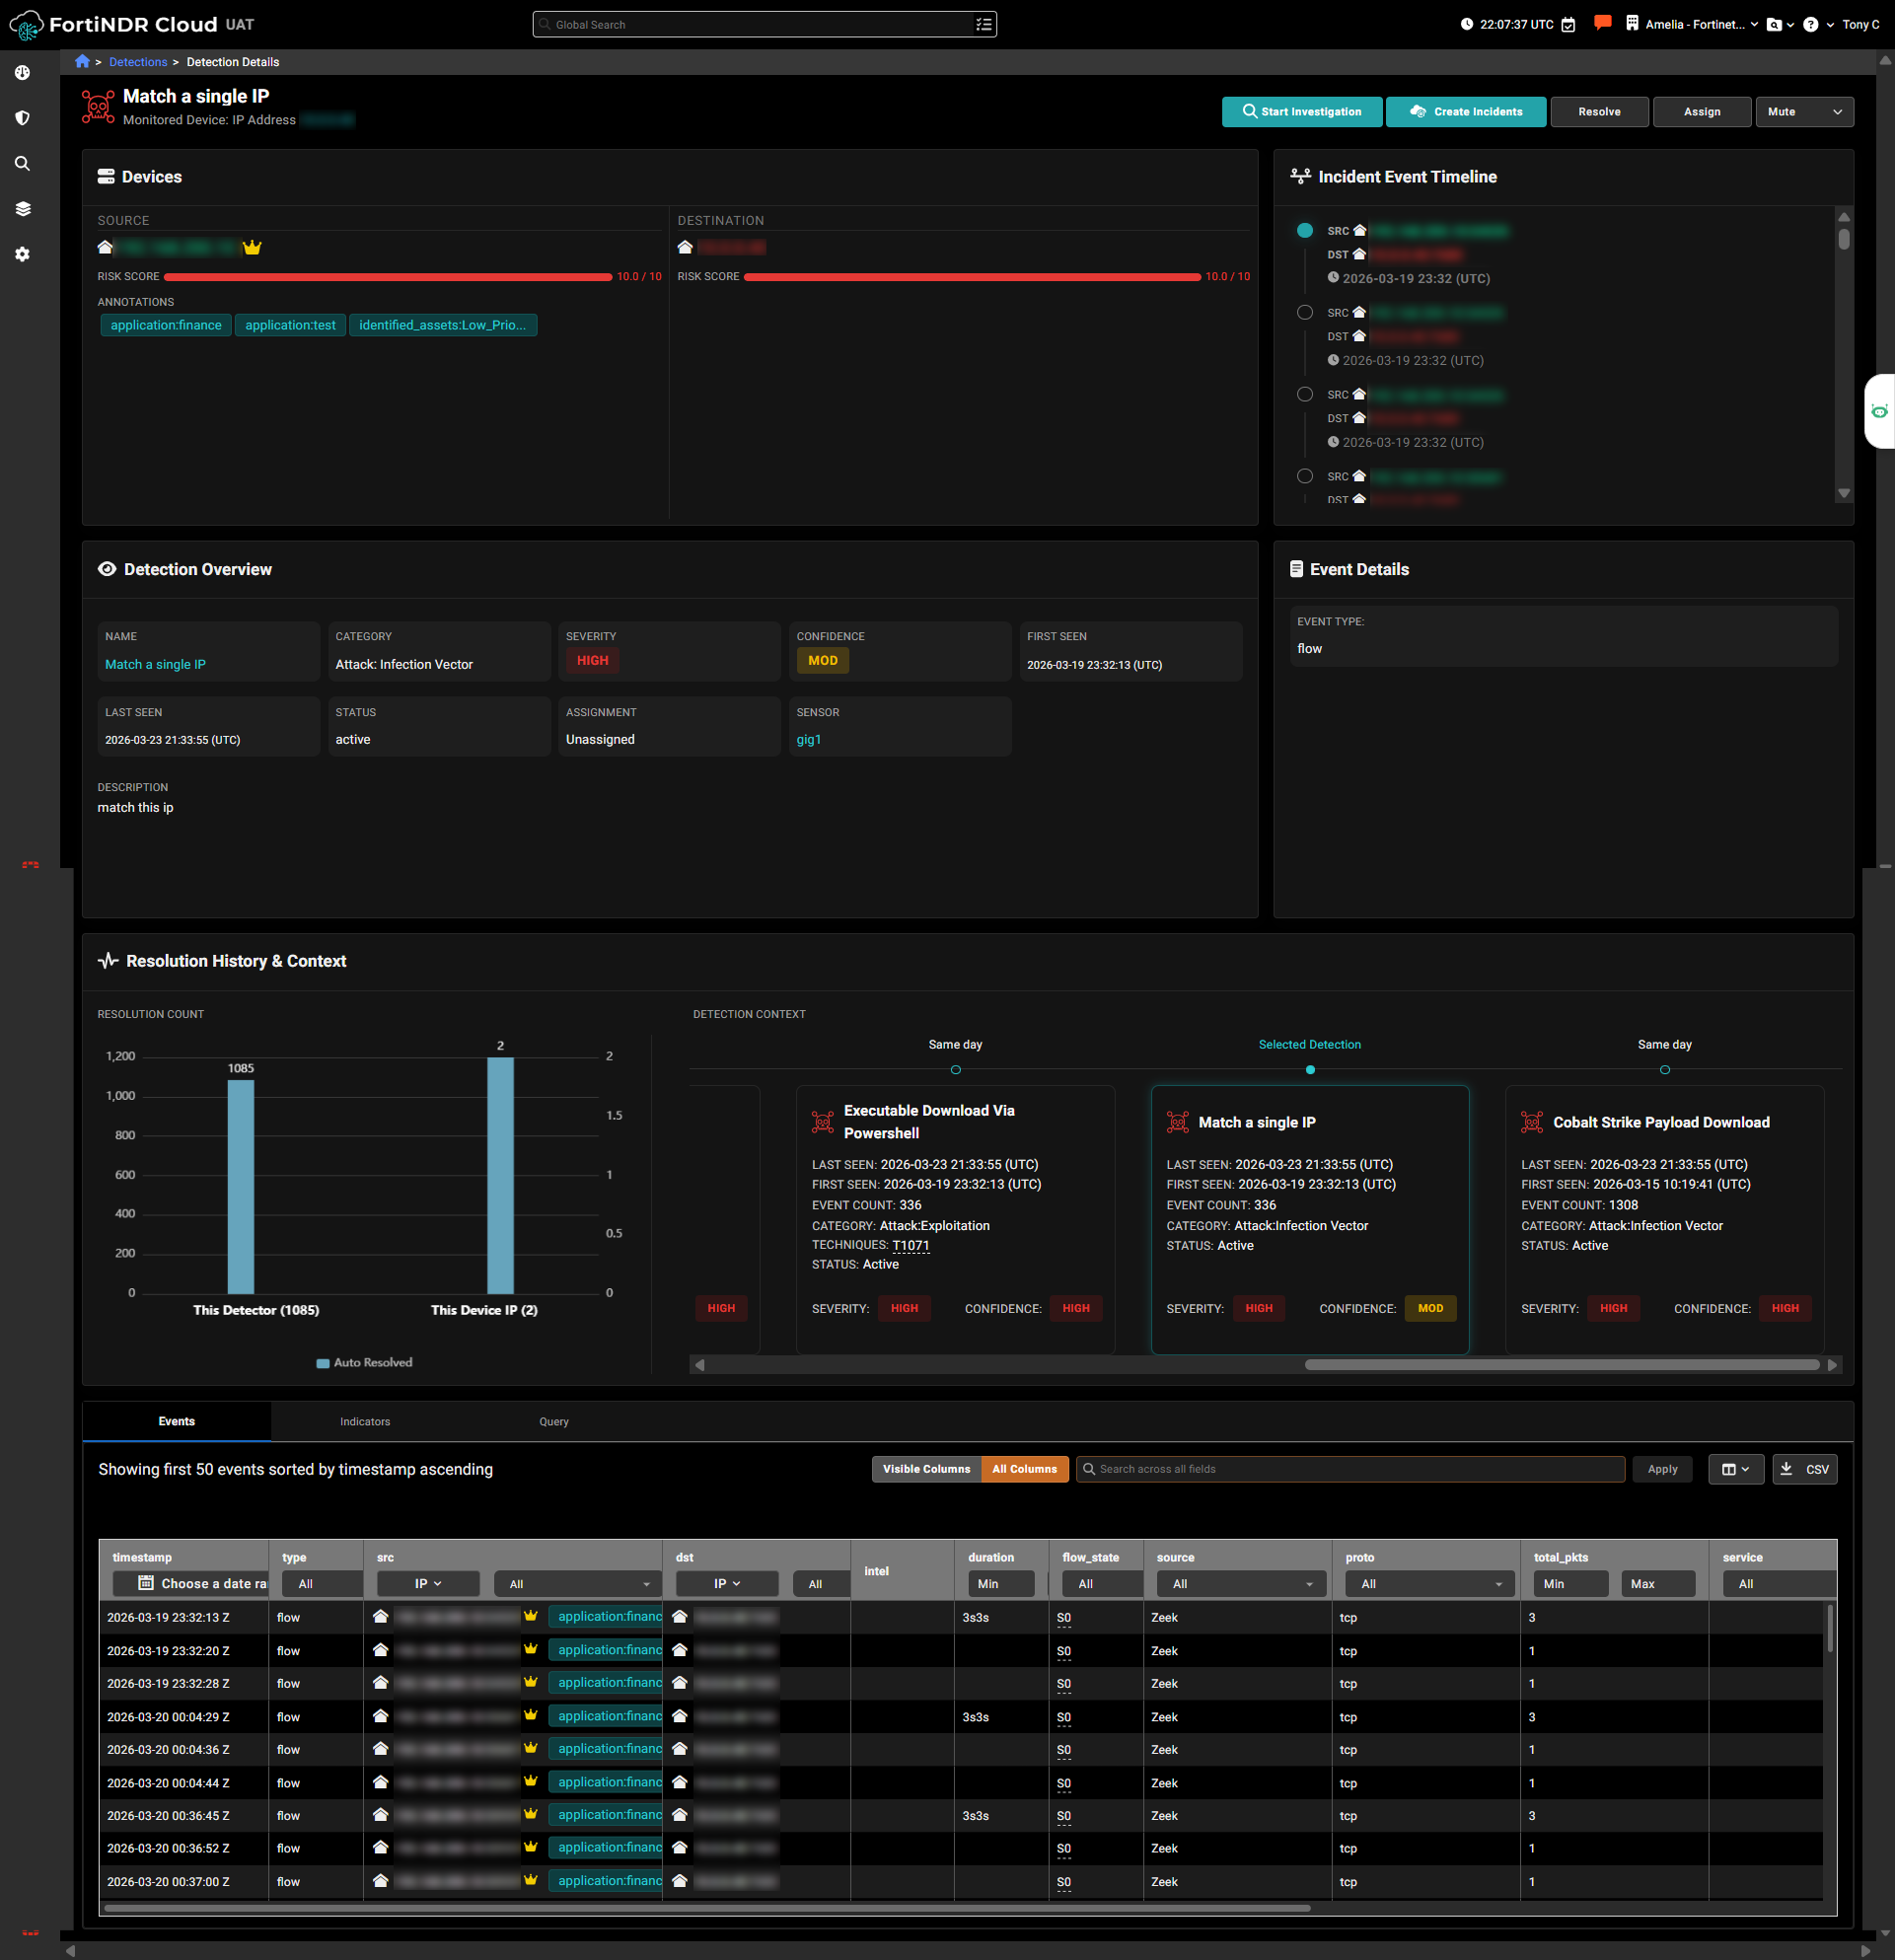
The new Detection Details page now provides a consolidated, in‑depth overview of an individual detection. To access the page from the Detections table, click a row or select the See Detection Details icon. This updated view brings together all essential information, including source and destination IPs, event timelines, resolution history, detection context, and related events.
The improved layout also highlights related detections to help you quickly identify recurring issues, while clearly presenting event information for observation‑based detections. This unified view eliminates the need to navigate across multiple pages.
A new Create Incidents feature is available in the Detection Details page and related views starting in version 26.1.b. This feature requires an active Fortinet Automation Service subscription. Customers with an active subscription can access the feature in the forthcoming Service Pack 1.0.3 release, which will include support for ServiceNow and Jira connectors and their associated playbooks.
Improved functionality
Manage annotations
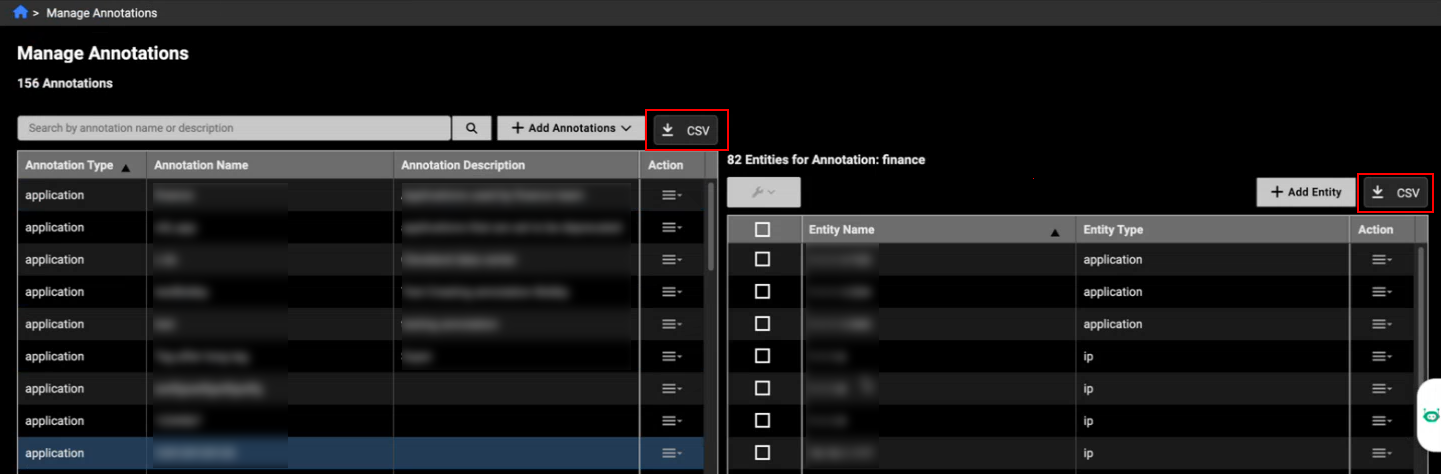
A new CSV download option has been added to the Manage Annotations page, providing download buttons for both the Annotations and Entities table. The downloaded file uses the same structure required for uploads, allowing users to make changes directly in the CSV and then re‑upload it without needing to adjust the format. This enhancement streamlines the edit‑and‑upload workflow and ensures the exported data is immediately ready for reuse.
Entity panel
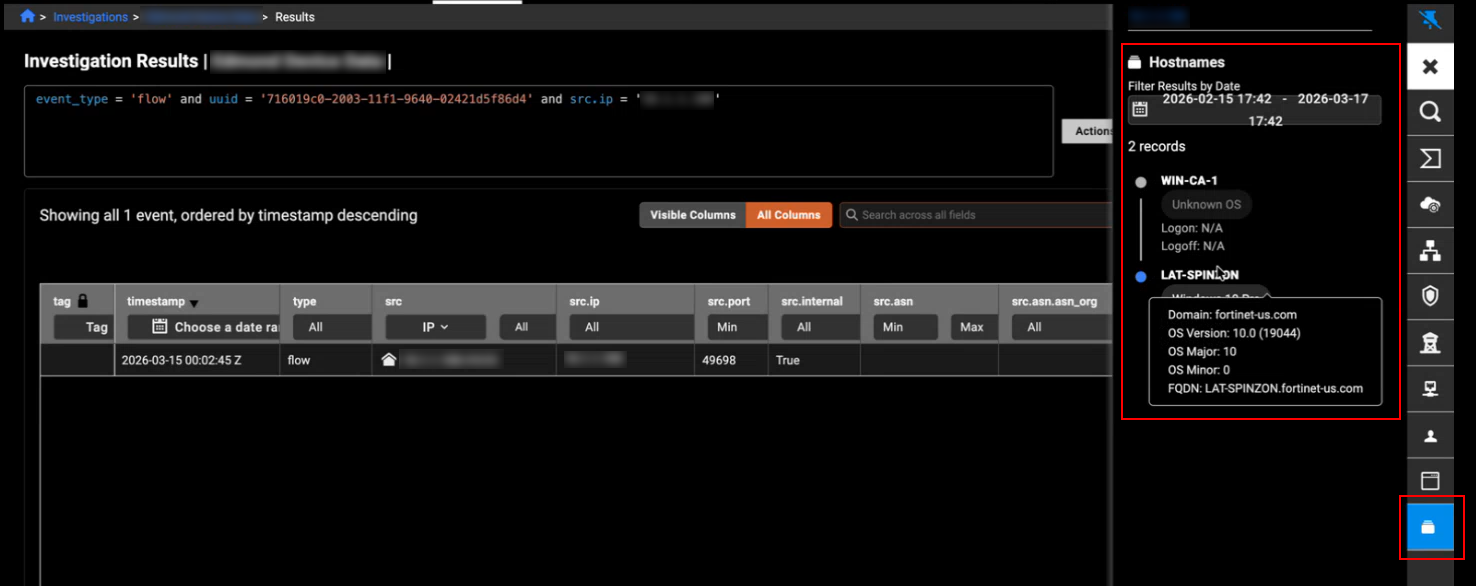
A new Hostnames tab has been added to the Entity Panel to display device enrichment data. This tab shows enrichment fields received from event records, including details such as OS name, OS major and minor versions, and any available login or logout timestamps. Where applicable, the data is presented in chronological order, providing clearer visibility into host-level enrichment information directly within the entity view.
Detections
We have introduced a new gallery view and a table view to the Detections Triage page. The updated view includes additional fields to provide more information at a glance. All standard table operations remain available, and selecting a detector still takes you to the detector details page.
Gallery View is the default layout for displaying detections. It presents each detection as a card in a grid, showing key information such as the detection name, severity, category, last‑seen time, and impacted devices. This view makes it easy to scan multiple detections quickly and identify the most important items at a glance.
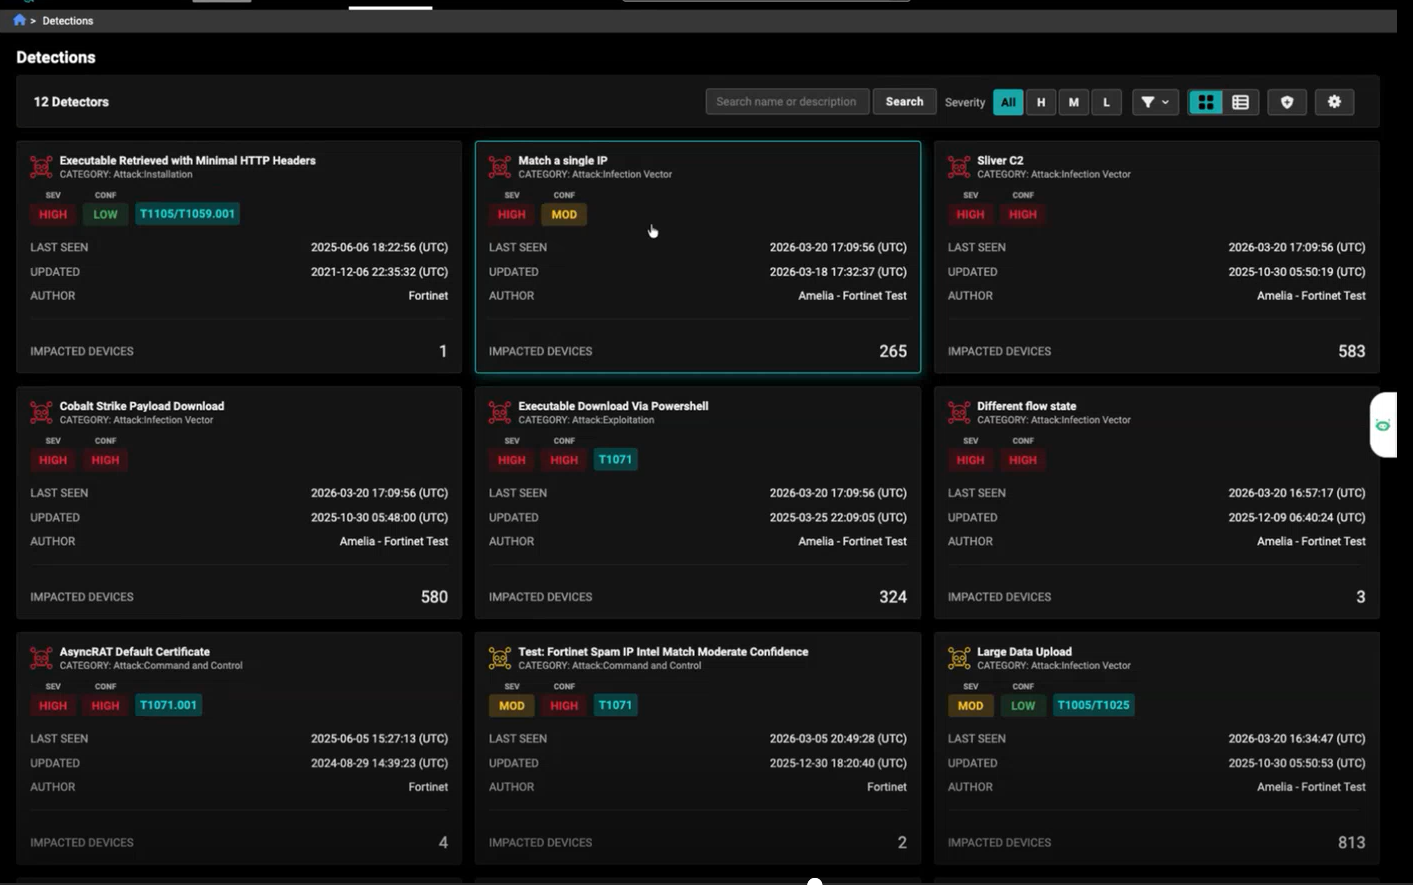
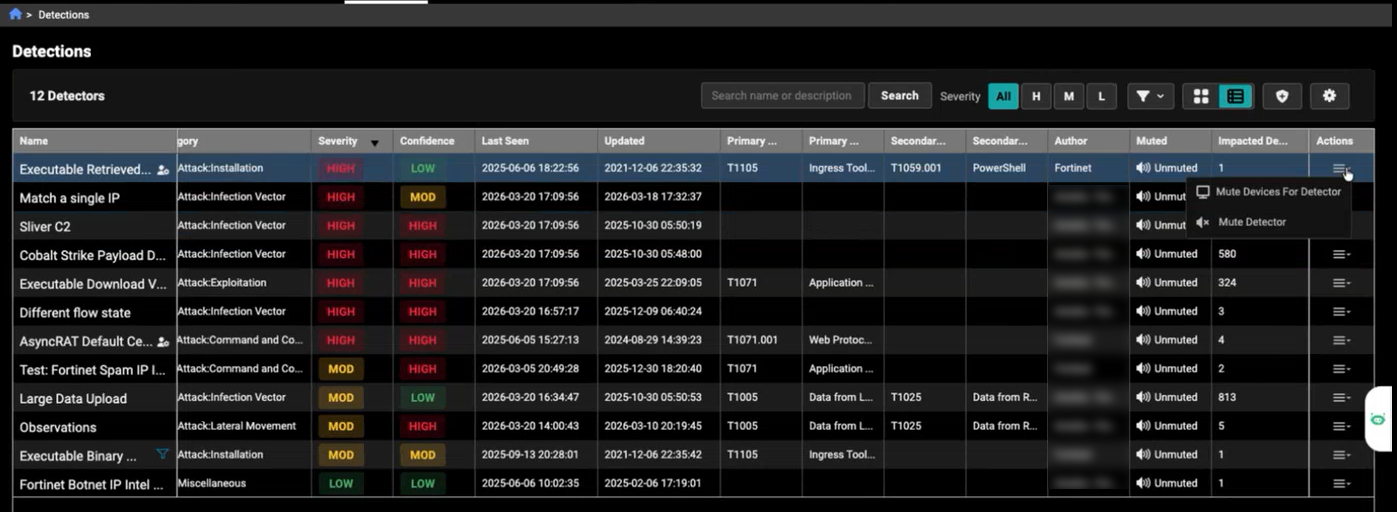
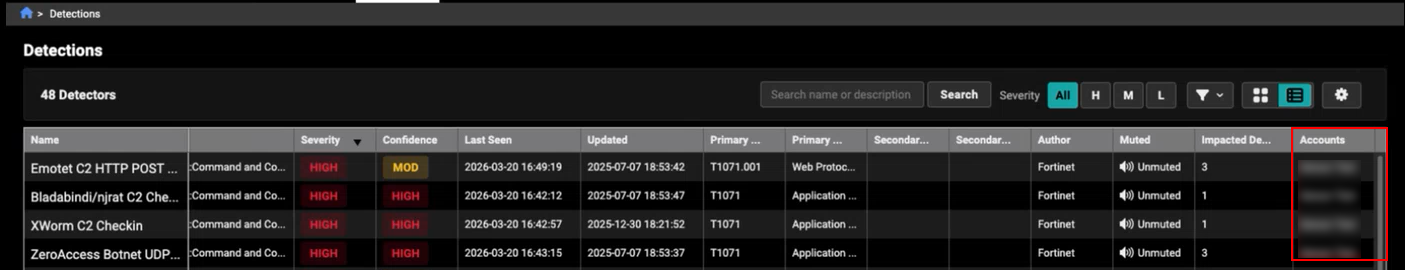
Table View presents detections in a compact, row‑and‑column format for easier sorting and comparison. Each detection appears as a single row with detailed fields such as name, category, severity, confidence, timestamps, author, mute status, and impacted devices. This view is useful when you need to quickly scan large amounts of data, sort by specific columns, or perform detailed analysis across multiple detections.
The new Accounts column displays all the accounts a detector is running on whenever you are viewing detectors in the All Accounts view. For detectors that run on a single account, the column shows that account name. When a detector runs across multiple accounts, hovering over the value opens a tooltip listing all associated accounts. This provides quick visibility into detector coverage without leaving the table. A new Exclude Accounts filter has also been added.
Other improvements
-
Enhanced Critical Assets Identification by adding support for detecting internal proxy servers. The system now automatically identifies and groups internal proxy server assets for easier tracking and investigation. Priority levels are assigned based on activity, with High Priority given when a proxy server is contacted by many distinct source IPs and Moderate Priority otherwise.
- The Subnets tab in the Mutes and Excludes has been updated to include a sorting option on this field.
- The Detections, Detections Table, and Investigations pages now support the This Quarter and Last Quarter time range filters.
-
The Sensor Telemetry graph has been updated for clarity. Days with no data now appear in the legend and are plotted as zero, resulting in the graph line dropping before continuing to the next data point.
-
The aggregation table in the query results now supports CSV download regardless of the number of columns included in an NL-based query.
-
NL query results now display the correct count of aggregation results. When an NL query returns only aggregated data, the GUI shows the total number of aggregated records instead of a generic placeholder. For example, if the query produces 16 aggregated entries, the interface now displays 16 results and lists all 16 records in the results table.
-
The Observation Context in the Events table has been redesigned from a list into a set of compact cards, making each key–value pair easier to read.
-
The license page now supports entries with Month/Day/Year start and end dates.
Deprecated features
- The Detections Graph has been removed from the Detection Details page.