
Version 25.1.e
New functionality
Custom dashboards
Traffic by Event Type widget
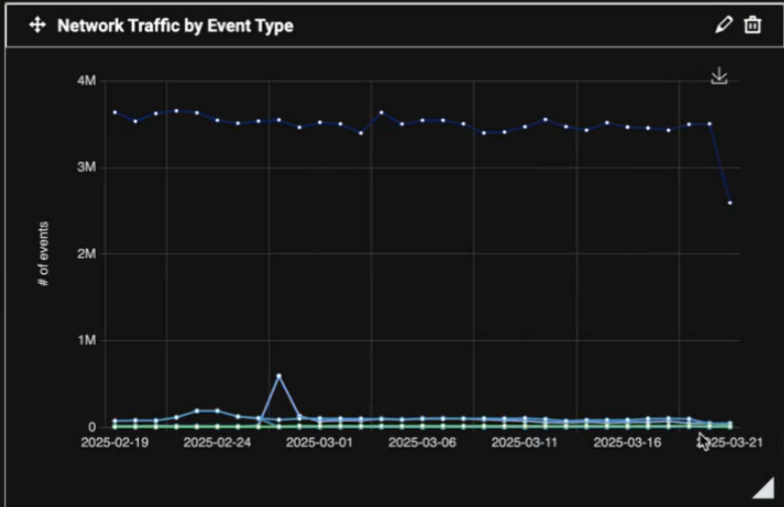
We have added a new Network traffic by Event Type widget to the custom dashboard menu. The data in the widget mirrors the Events tab in the Sensor telemetry page.
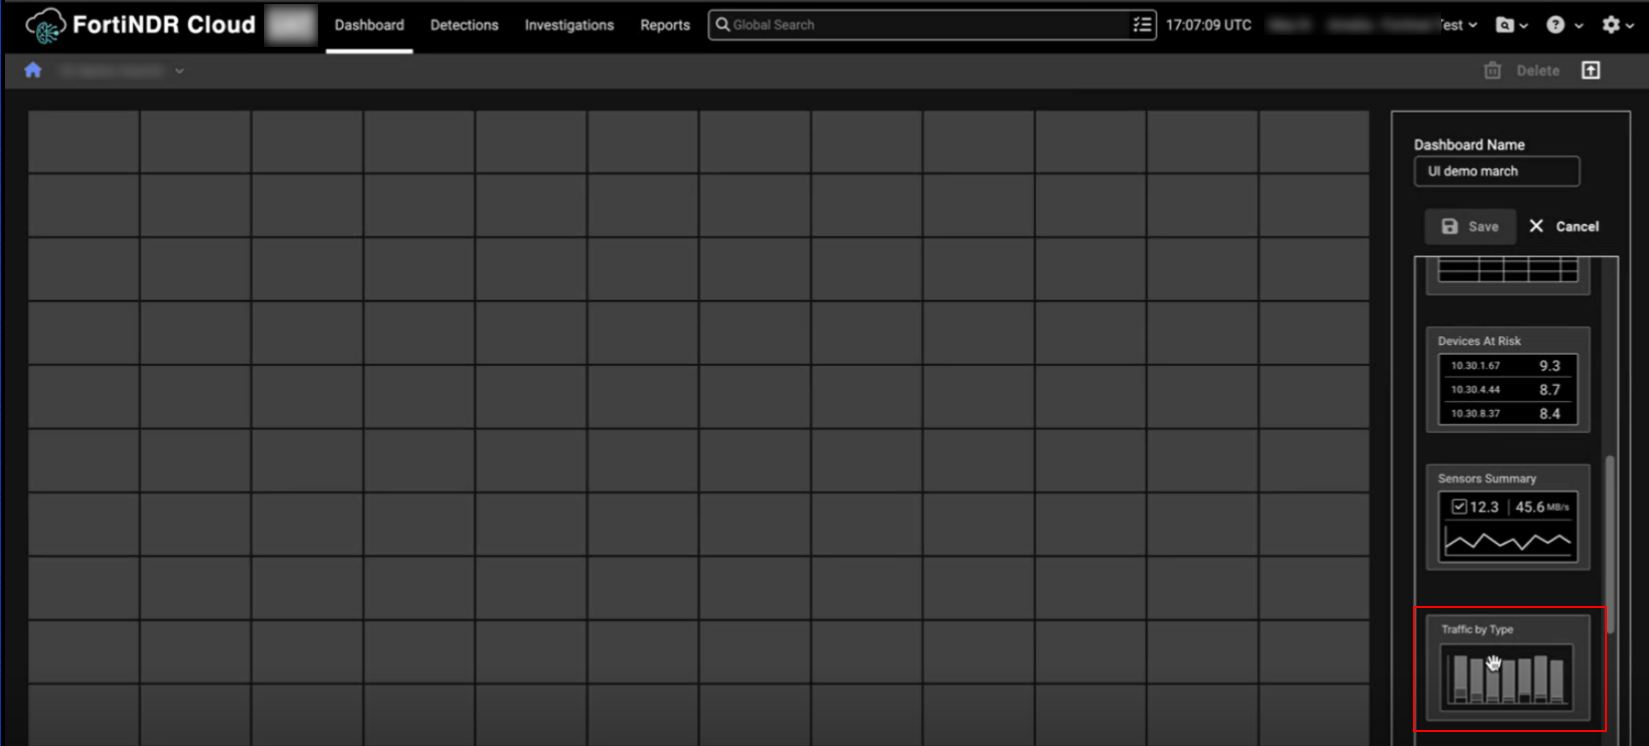
To add the widget, create a new dashboard, and select the Traffic by type widget in the menu.
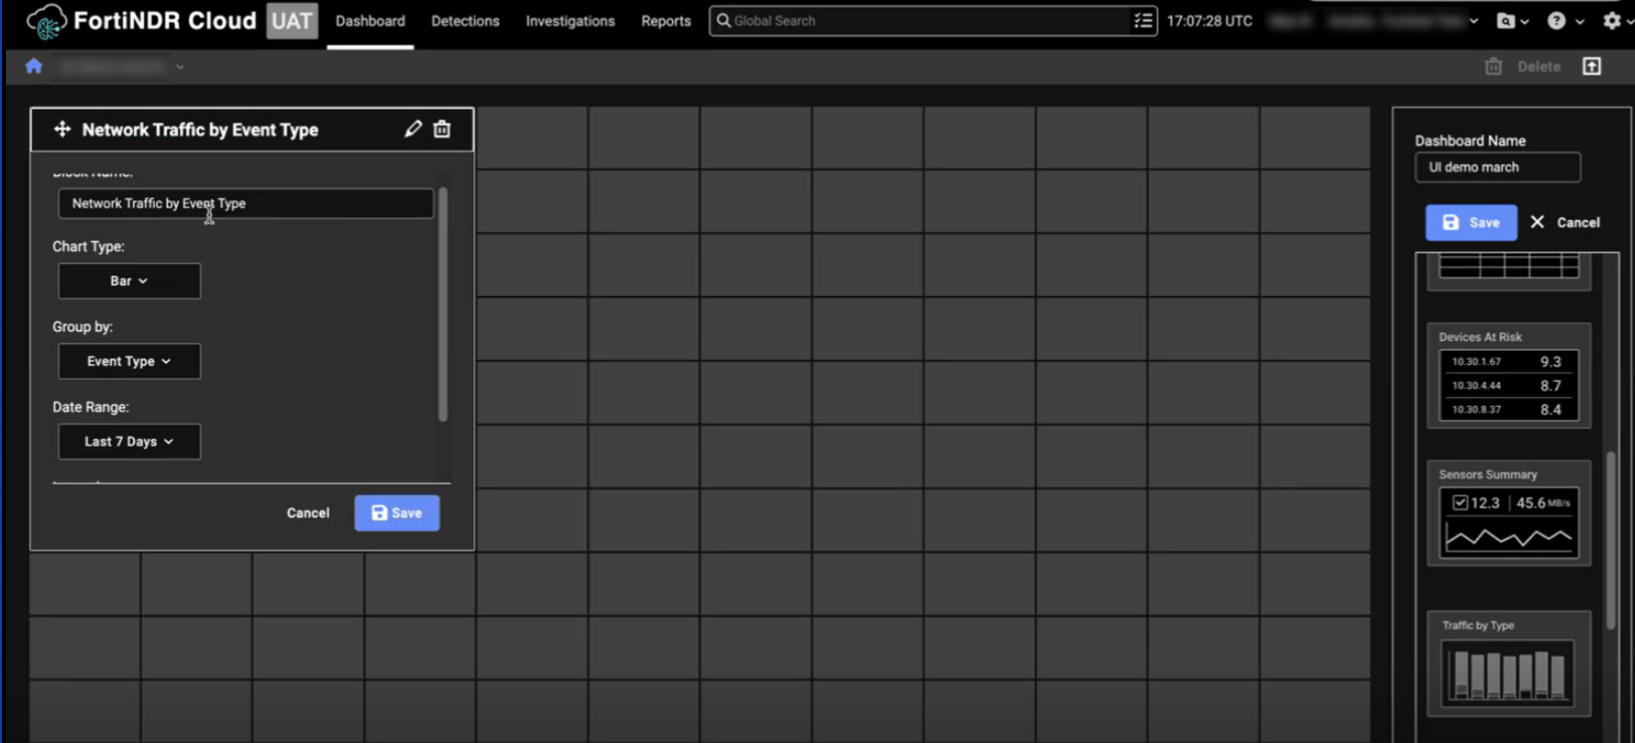
The widget's default name is Network Traffic by Event. You can change the name of the widget as well as the default chart type and data filters.
Detections
Automated response configuration
The new Response Configuration feature allows you to automatically ban an IP address when a high-severity and high-confidence detection occurs. This feature is only available for FortiGate via FortiManager integrations at this time.
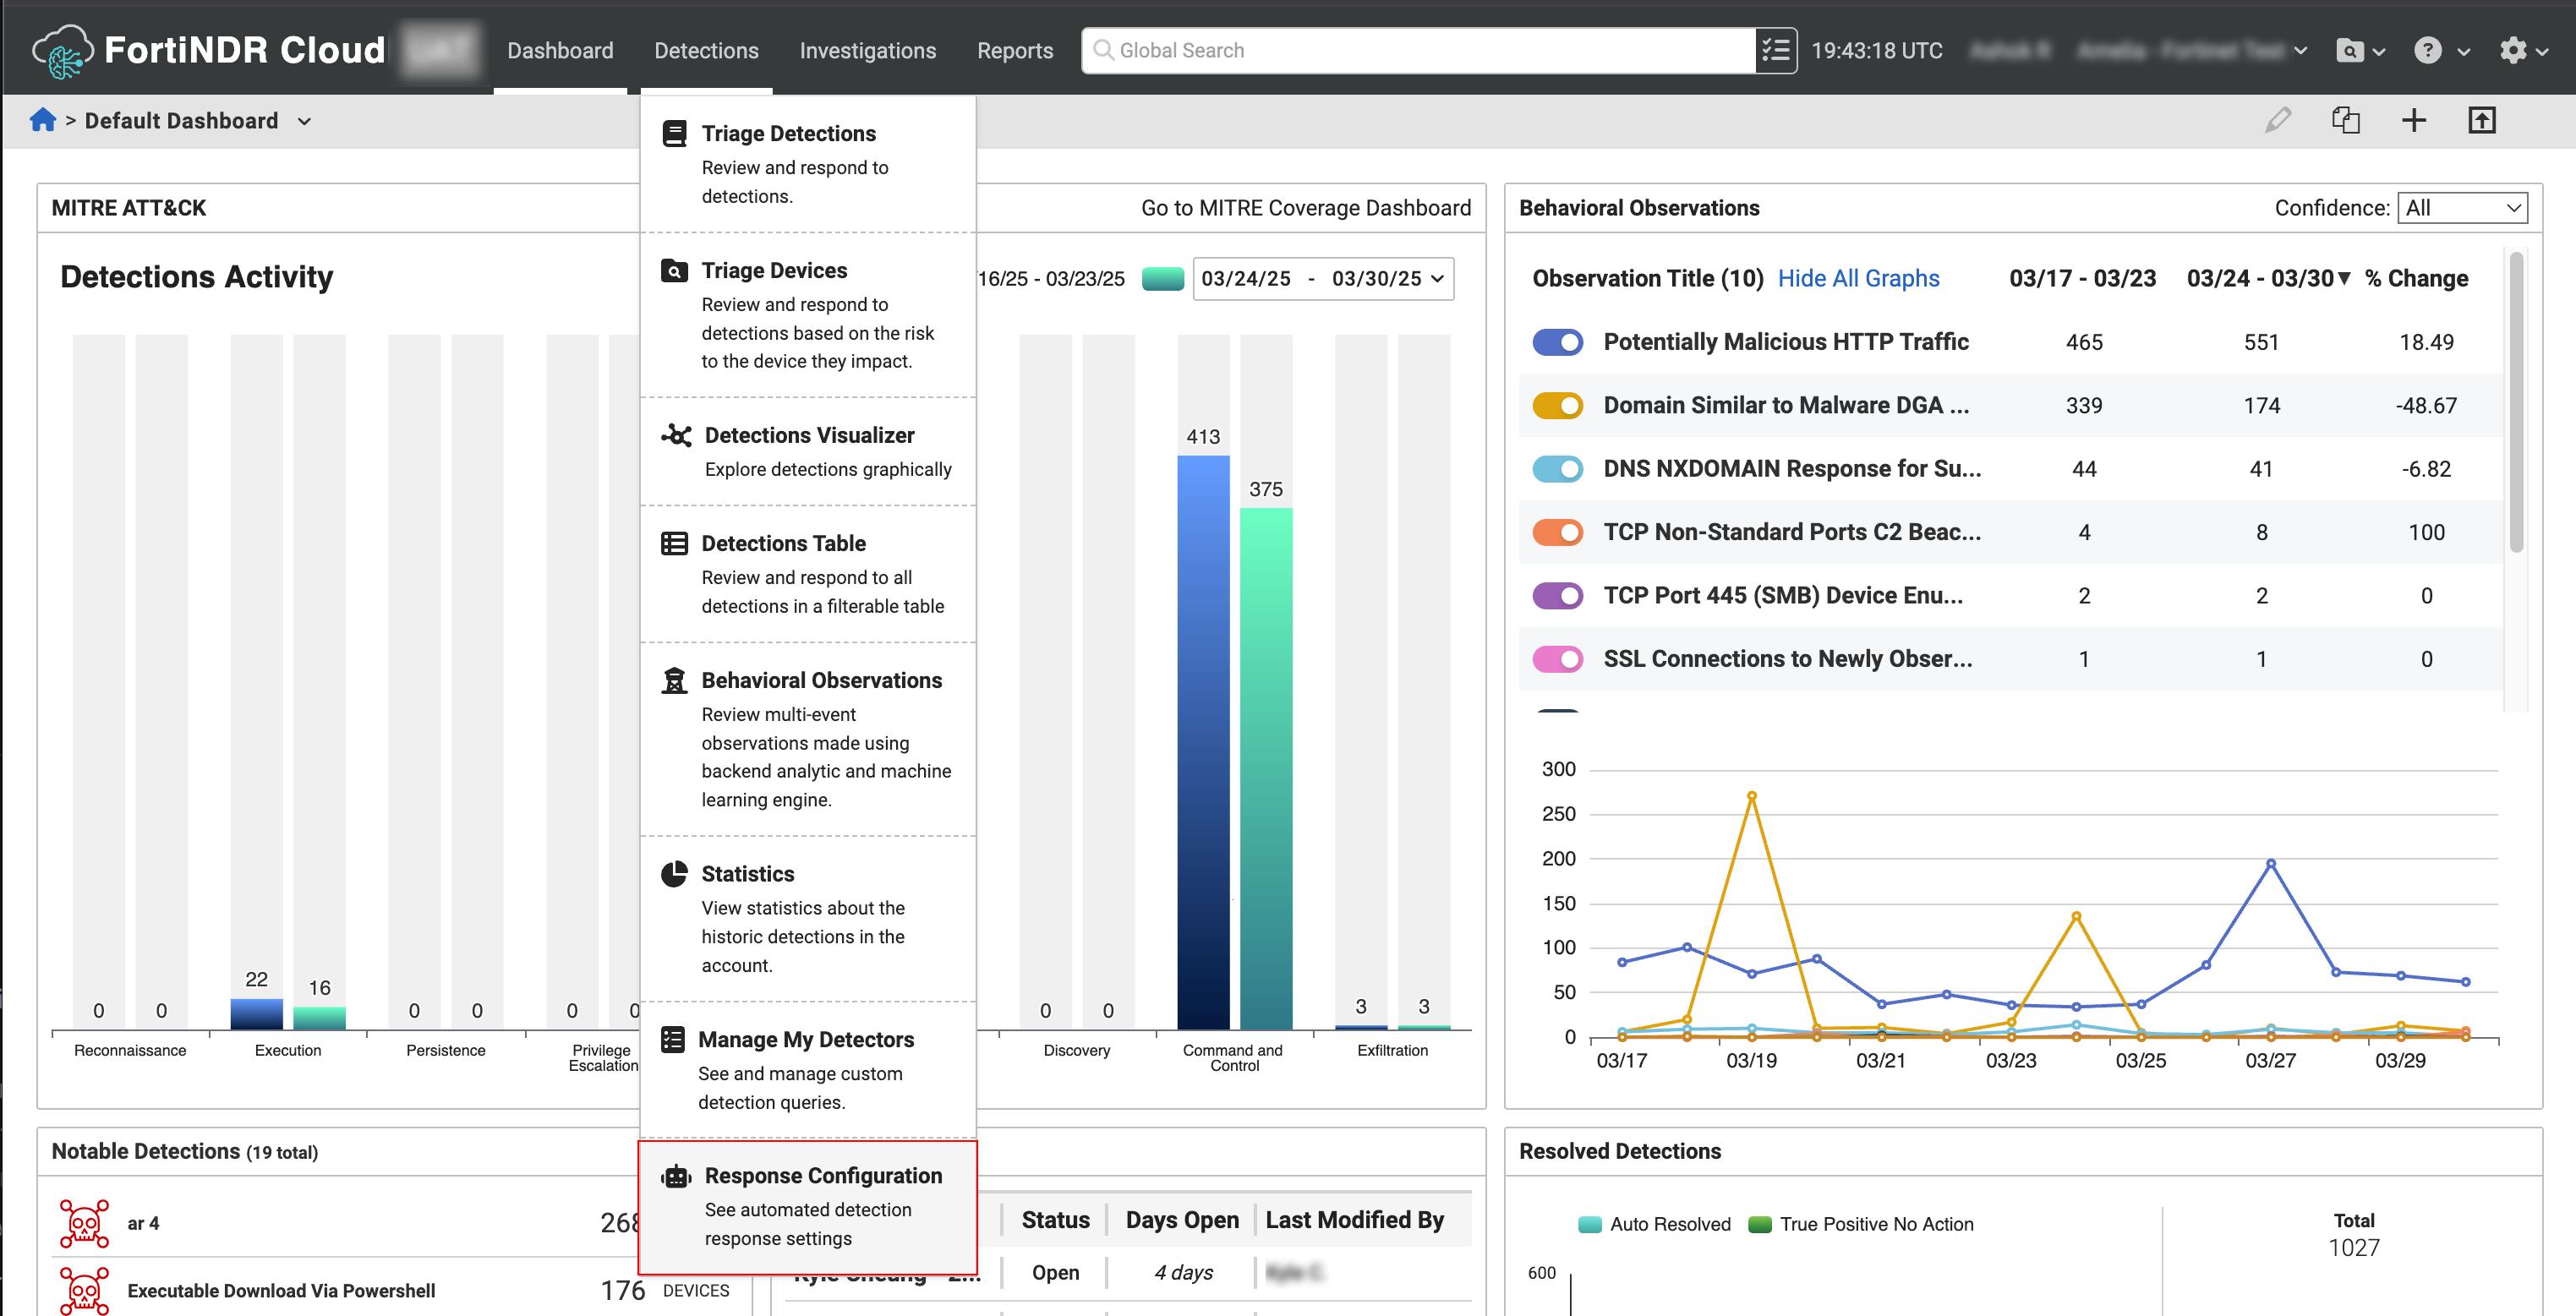
To enable and configure the Response Configuration, go to Detections > Response Configuration. In the Configure dialog, select Auto-remediate or Manual Response.
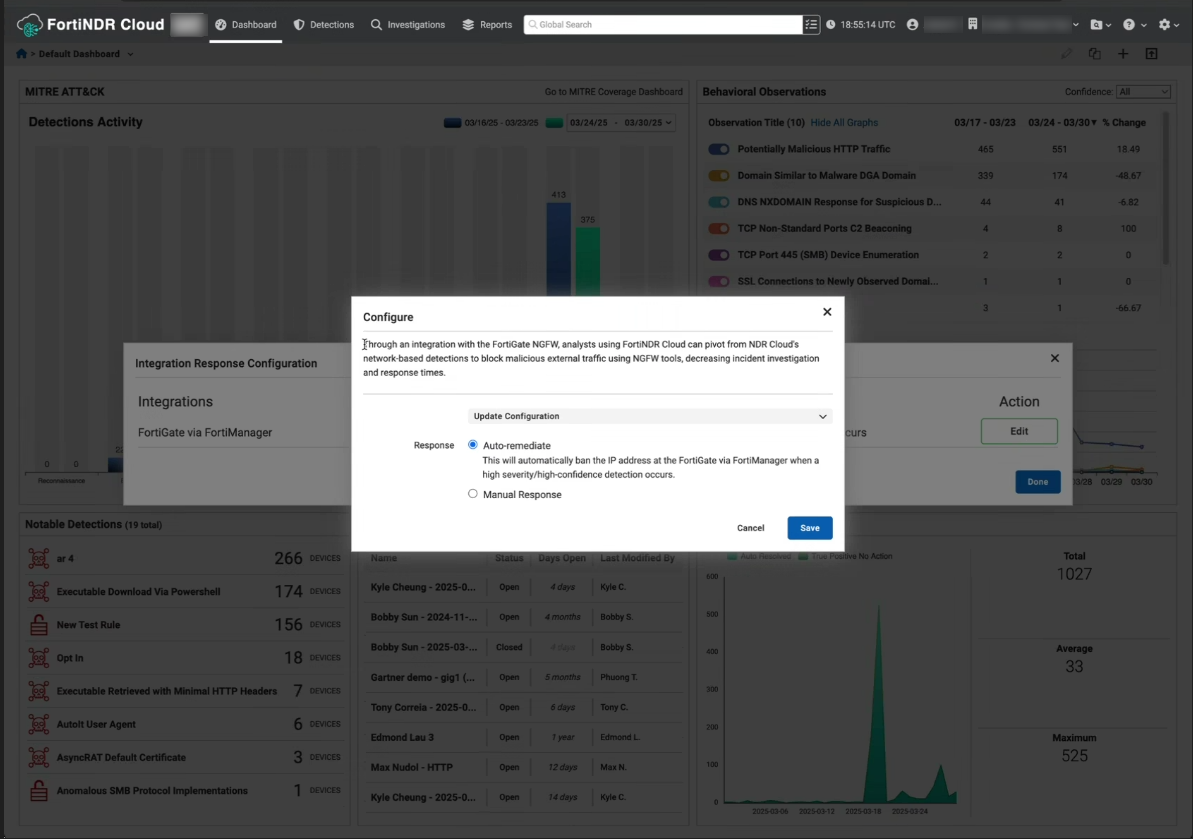
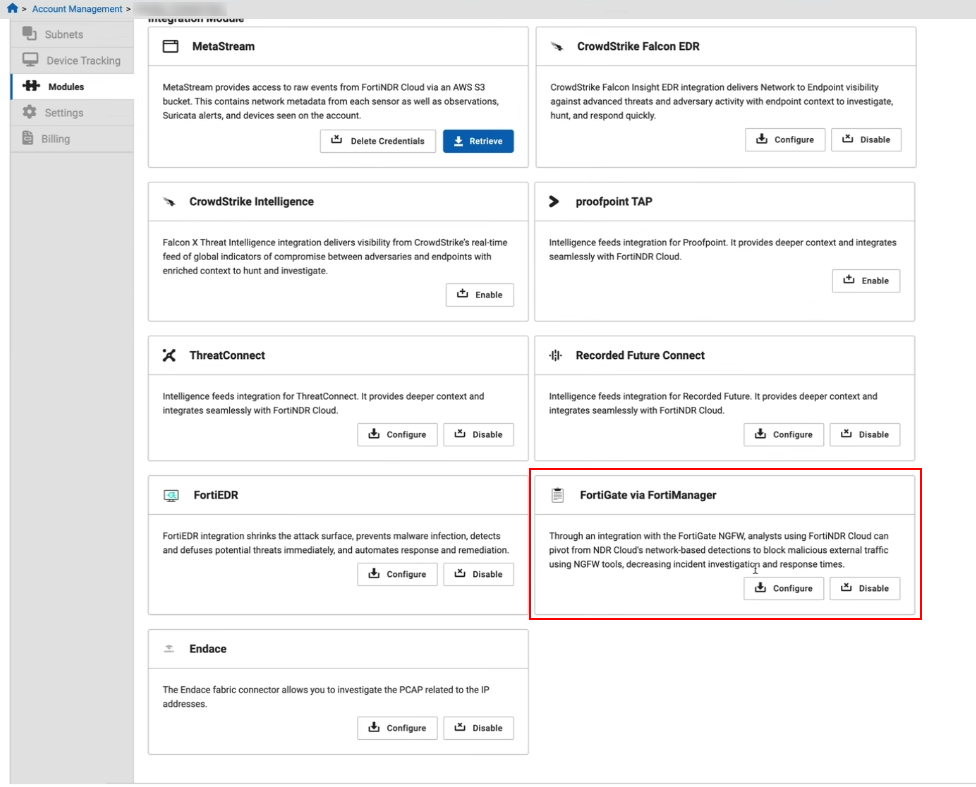
You can also enable Response Configuration in the Account Management > Modules page by clicking Configure in the FortiGate via FortiManager tile.
Improved functionality
Investigations
Column profiles
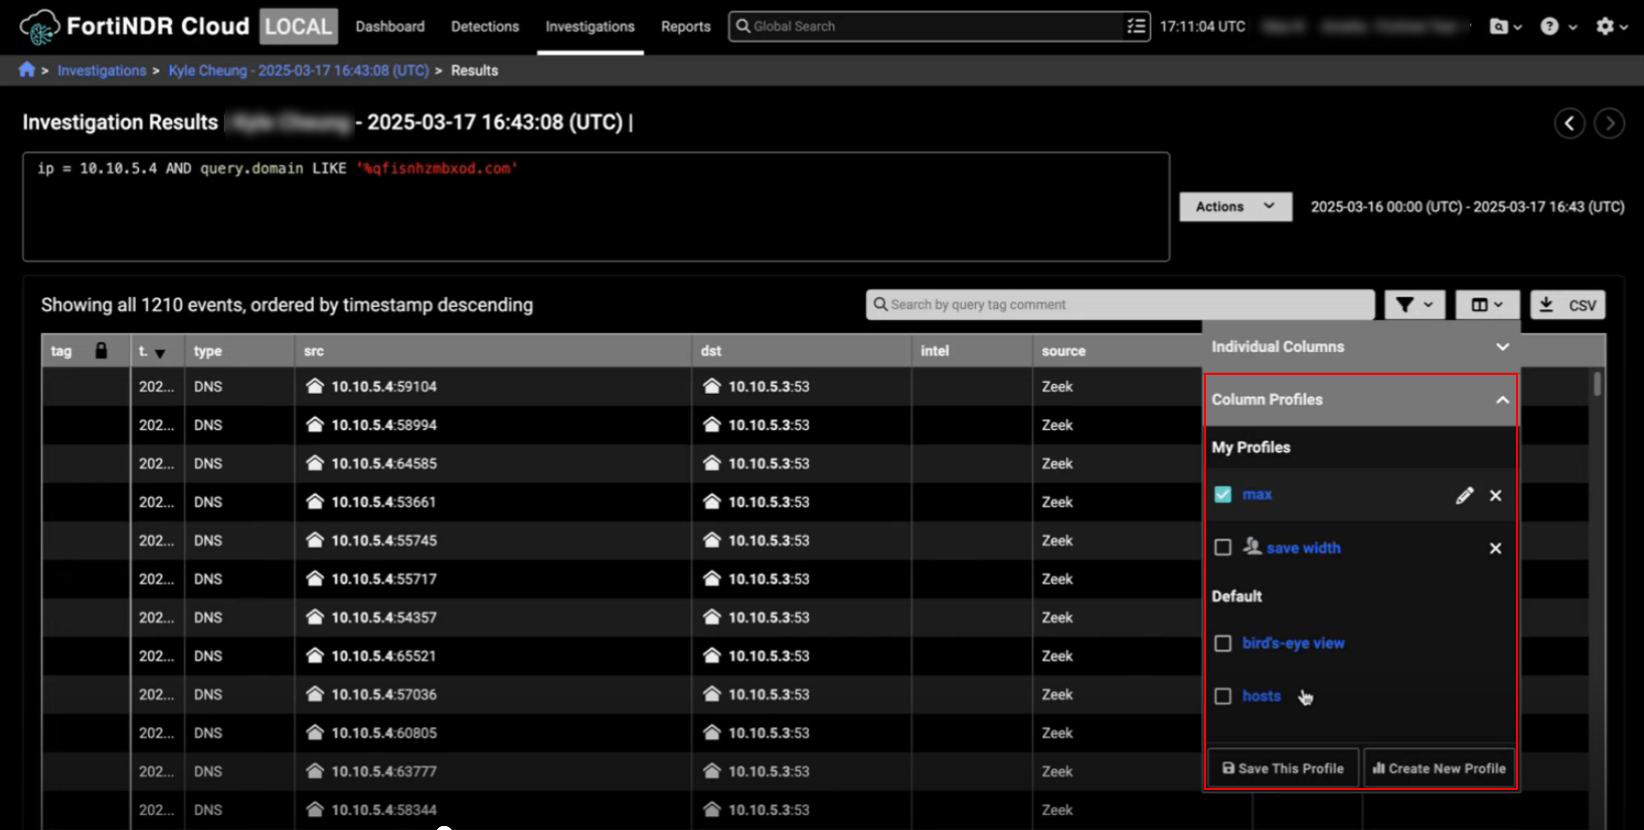
We have improved the usability of the Column Profiles feature. For example, you no longer need to refresh the page when you create a new profile for it to appear in the profile list. We have also added a radio button to select the profile you want to edit or delete.
To create a new profile, simply add or remove columns to the current view and adjust the column width, then click Create New Profile. Everything in the table will be saved to the profile including the column width. To update changes to an existing profile. simply click Save this Profile. After you have finished creating or editing a profile, the page refreshes automatically and applies your changes.
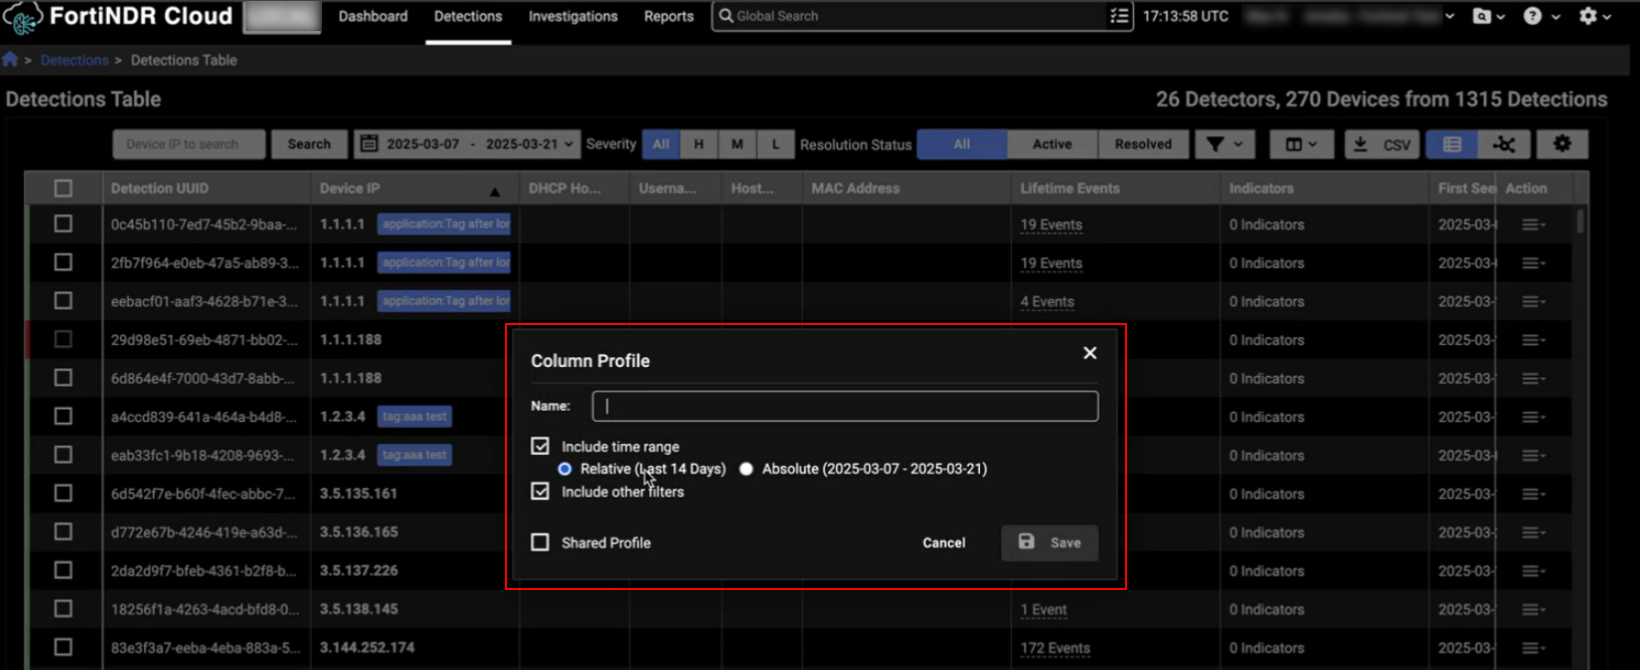
You can also create a new column profile from the Individual Columns menu in the Detections Table that will include the filters you applied to the page.
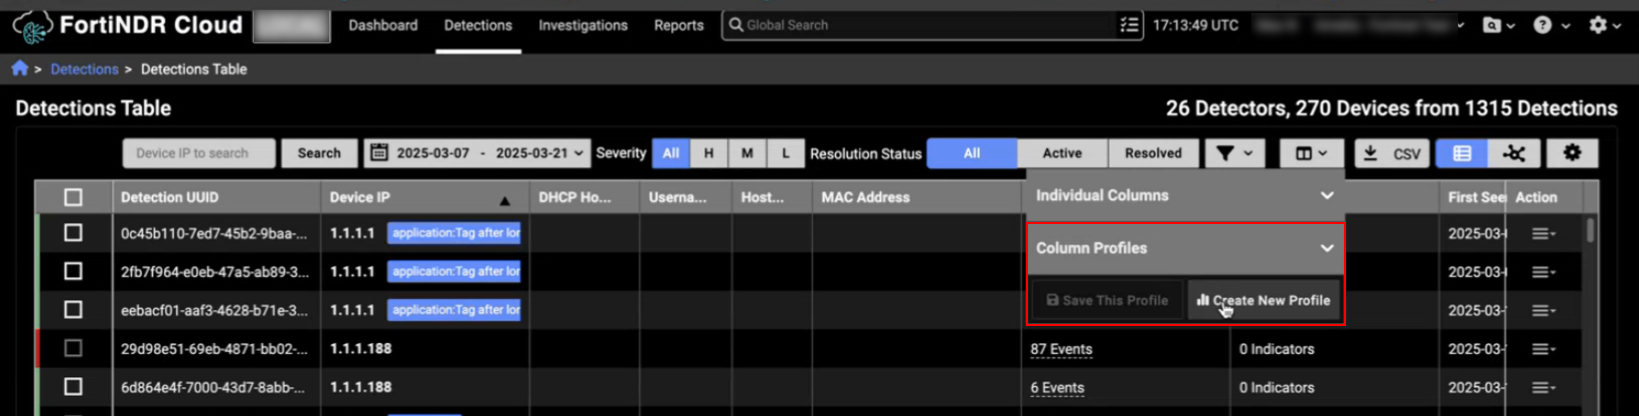
You can configure the profile to include a date range as well as the filters you have applied to the current view of the table.
IQL queries
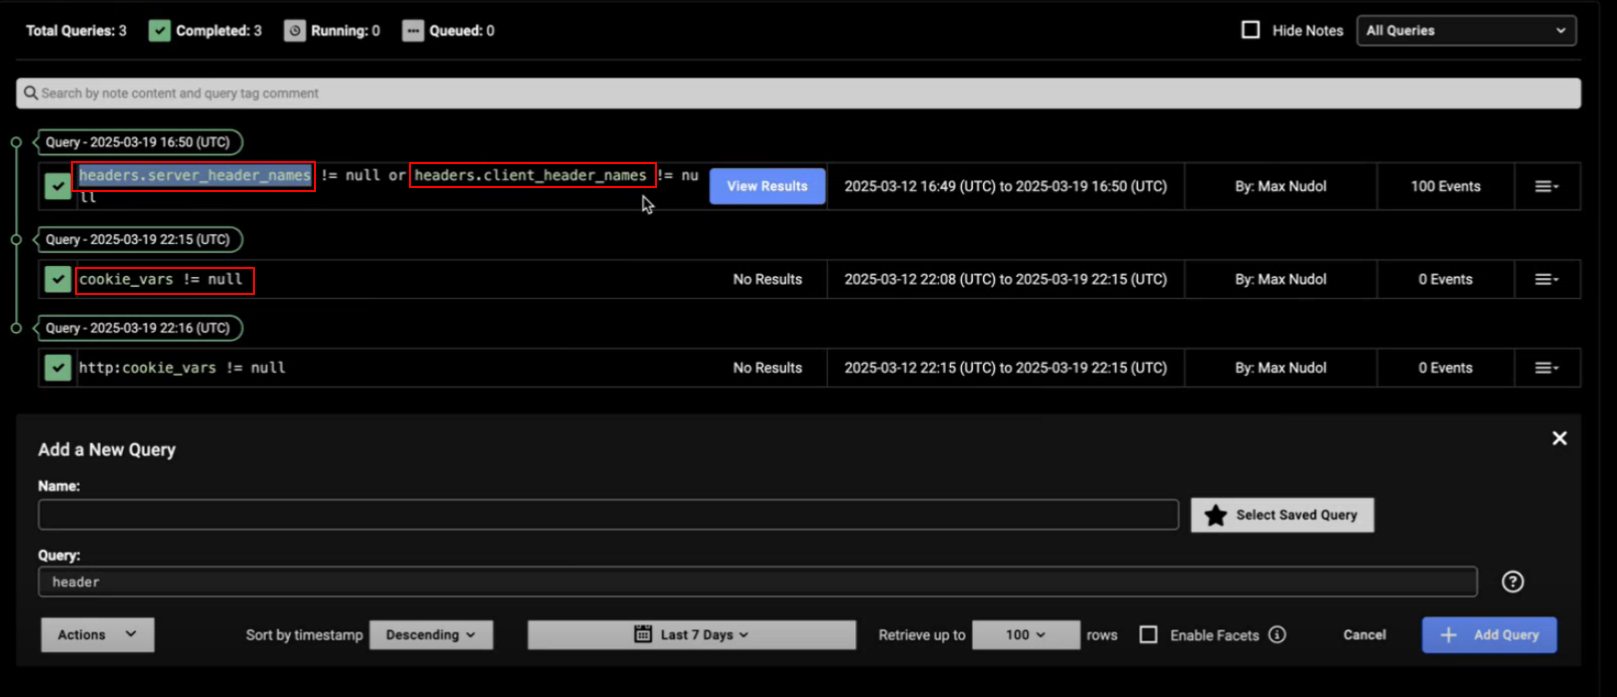
IQL queries now support HTTP server header names, client server names, and cookie variables.
Detections
Create new detectors
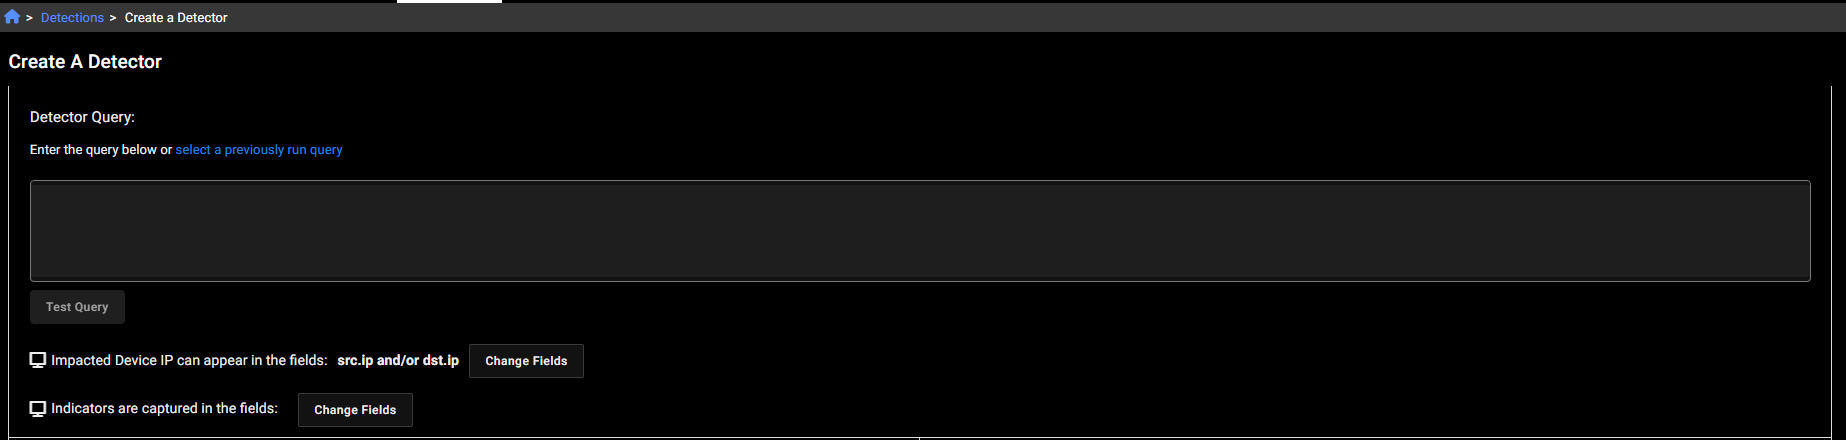
You can now create a new detector with a new query. In the Create Detector page, either enter a new query in the text field or click select a previously run query, to use a saved or existing query. If you enter a new query or edit an existing one, you are required to click Test Query and resolve any errors before you can save it.
Other improvements
Sensors
- We have improved the tooltip in the Events tab of the Sensors telemetry page.
- We have added the Serial Number column to the Sensor list page.
Encryption keys
- We have added the Uploaded by and Uploaded date values to the Account management > Settings page. Going forward the Settings page will display the full name and UUID of the user who uploaded the key, as well as the date. If the user does not belong to the account, Unknown User is displayed.