Fortinet white logo
Fortinet white logo

Administration Guide

Logging Topology

Logging Topology

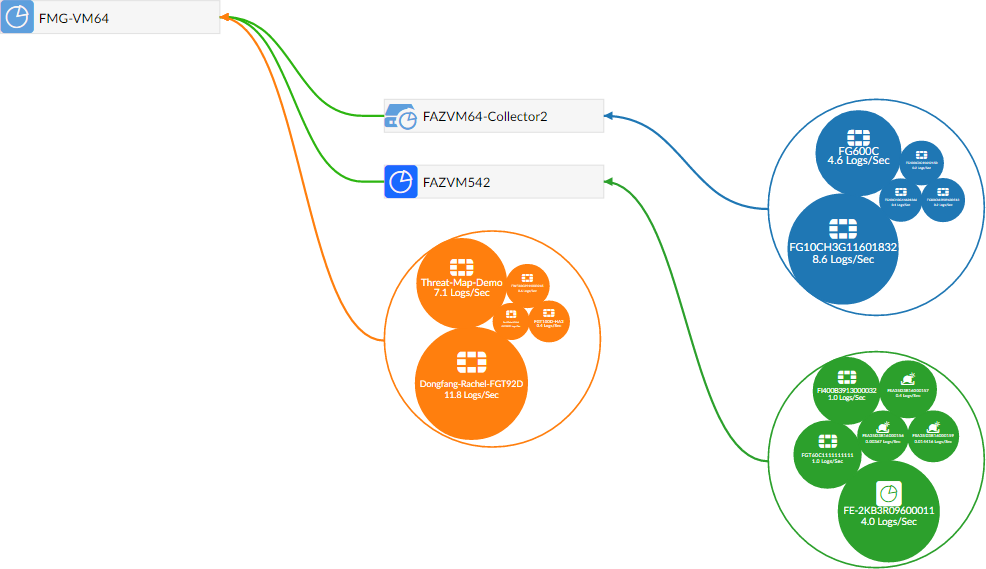
The Logging Topology pane shows the physical topology of devices in the Security Fabric. Click, hold, and drag to adjust the view in the content pane, and double-click or use the scroll wheel to change the zoom.

The visualization can be filtered to show only FortiAnalyzer devices or all devices by device count or traffic.

Hovering the cursor over a device in the visualization will show information about the device, such as the IP address and device name. Right-click on a device and select View Related Logs to go to the Log View pane, filtered for that device.
This pane is only available when the FortiAnalyzer features are manually enabled. For more information, see FortiAnalyzer Features.

Logging Topology

Logging Topology

The Logging Topology pane shows the physical topology of devices in the Security Fabric. Click, hold, and drag to adjust the view in the content pane, and double-click or use the scroll wheel to change the zoom.

The visualization can be filtered to show only FortiAnalyzer devices or all devices by device count or traffic.

Hovering the cursor over a device in the visualization will show information about the device, such as the IP address and device name. Right-click on a device and select View Related Logs to go to the Log View pane, filtered for that device.

This pane is only available when the FortiAnalyzer features are manually enabled. For more information, see FortiAnalyzer Features.