
QTM traffic shaping example
This example shows how to set up NP7 or NP7Lite QTM traffic shaping on a physical interface and then use the diagnose netlink interface list command to display QTM shaping statistics for the physical interface.
QTM traffic shaping supports using the diagnose netlink interface list command to display current traffic statistics, providing a more complete picture of how QTM is shaping the traffic. This command can be used on various interfaces, such as physical, VLAN, LAG, and VLAN over LAG interfaces on NP7 and NP7Lite FortiGate models.
Use Case
-
Create a shaping policy to add a
class-idto the traffic from PC1 to PC5. -
Create a shaping profile to set different bandwidth limits for traffic with different
class-ids. -
Apply the shaping profile to the physical interface.
-
Generate TCP traffic on PC1 to see whether the rate is limited as expected.
-
Check the session table on the FortiGate to see whether the corresponding session entry is associated with the correct
class-idand whether the traffic is correctly offloaded to the NP7 or NP7Lite processor. -
Use the
diagnose netlink interface listcommand to display shaping statistics for the physical interface.
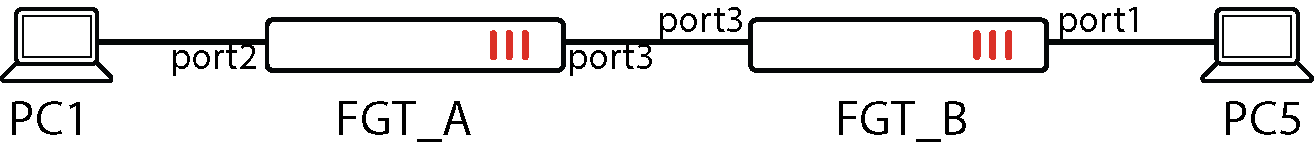
Topology
CLI steps
-
Create a shaping-policy to add a
class-idto the traffic from PC1 to PC5.config firewall shaping-policy
edit 2
set schedule "always"
set srcintf "port2"
set dstintf "port3"
set class-id 2
set srcaddr "pc1"
set dstaddr "pc5"
next
end
-
Create a shaping profile to set different bandwidth limits for traffic with different class-ids.
config firewall shaping-profile
edit "test"
set default-class-id 31
config shaping-entries
edit 2
set class-id 2
set guaranteed-bandwidth-percentage 20
set maximum-bandwidth-percentage 20
next
edit 31
set class-id 31
set guaranteed-bandwidth-percentage 31
set maximum-bandwidth-percentage 31
next
end
-
Apply the shaping profile to the physical interface.
config system interface
edit "port3"
set vdom "vdom1"
set ip 10.2.2.1 255.255.255.0
set allowaccess ping https ssh snmp http telnet
set type physical
set outbandwidth 100000
set egress-shaping-profile "test"
set device-identification enable
set snmp-index 5
config ipv6
set ip6-address 2000:10:2:2::1/64
set ip6-allowaccess ping https http telnet
end
next
-
Send a packet to hit the shaping policy and check the session.
The following command output shows the
class-idand shapingpolicy have been associated with the session table.offload=9/9indicates that bidirectional traffic has been offloaded to the NP7 or NP7Lite processor.diagnose sys session list session info: proto=6 proto_state=01 duration=12 expire=3587 timeout=3600 refresh_dir=both flags=00000000 socktype=0 sockport=0 av_idx=0 use=3 origin-shaper= reply-shaper= per_ip_shaper= class_id=2 shaping_policy_id=2 ha_id=0 policy_dir=0 tunnel=/ vlan_cos=0/255 state=may_dirty npu statistic(bytes/packets/allow_err): org=7612/7/1 reply=112/2/1 tuples=2 tx speed(Bps/kbps): 0/0 rx speed(Bps/kbps): 0/0 orgin->sink: org pre->post, reply pre->post dev=8->9/9->8 gwy=10.2.2.2/0.0.0.0 hook=post dir=org act=snat 10.1.100.11:40120->172.16.200.55:5001(10.2.2.1:40120) hook=pre dir=reply act=dnat 172.16.200.55:5001->10.2.2.1:40120(10.1.100.11:40120) pos/(before,after) 0/(0,0), 0/(0,0) src_mac=00:0c:29:3a:8e:8e dst_mac=94:f3:92:82:bc:52 misc=0 policy_id=1 pol_uuid_idx=2007 auth_info=0 chk_client_info=0 vd=3 serial=0000531d tos=ff/ff app_list=0 app=0 url_cat=0 route_policy_id=1 rpdb_link_id=00000001 ngfwid=n/a npu_state=0x000c00 ofld-O ofld-R npu info: flag=0x81/0x81, offload=9/9, ips_offload=0/0, epid=161/129, ipid=129/130, vlan=0x0000/0x0000 vlifid=129/130, vtag_in=0x0000/0x0000 in_npu=1/1, out_npu=1/1, fwd_en=0/0, qid=0/1, ha_divert=0/0 total session: 1
-
Use the
diagnose netlink interface listcommand to see thatcurrent-bw,dropped_packets, anddropped_bytesall have statistical data displayed.diagnose netlink interface list port3 if=port3 family=00 type=1 index=9 mtu=1500 link=0 master=0 ref=77 state=start present fw_flags=c00 flags=up broadcast run multicast Qdisc=mq hw_addr=94:f3:92:bc:25:72 broadcast_addr=ff:ff:ff:ff:ff:ff egress traffic control: bandwidth=100000(kbps) lock_hit=0 default_class=31 n_active_class=2 class-id=2 allocated-bandwidth=20000(kbps) guaranteed-bandwidth=20000(kbps) max-bandwidth=20000(kbps) current-bandwidth=19851(kbps) priority=high forwarded_bytes=82010K dropped_packets=924 dropped_bytes=1402K class-id=31 allocated-bandwidth=31000(kbps) guaranteed-bandwidth=31000(kbps) max-bandwidth=31000(kbps) current-bandwidth=0(kbps) priority=high forwarded_bytes=0 dropped_packets=0 dropped_bytes=0 stat: rxp=28334 txp=54319 rxb=2222235 txb=81634308 rxe=0 txe=0 rxd=0 txd=0 mc=0 collision=0 @ time=1741909958 re: rxl=0 rxo=0 rxc=0 rxf=0 rxfi=0 rxm=0 te: txa=0 txc=0 txfi=0 txh=0 txw=0 misc rxc=0 txc=0 input_type=0 state=3 arp_entry=0 refcnt=77 -
If PC1 is running Linux, you can use the following command to verify that the traffic rate is in line with expectations (100Mb/s * 20% = 20Mb/s).
root@pc1:~# iperf -c 172.16.200.55 -i 3 -t 60
------------------------------------------------------------
Client connecting to 172.16.200.55, TCP port 5001
TCP window size:  416 KByte (default)
------------------------------------------------------------
[  3] local 10.1.100.11 port 40120 connected with 172.16.200.55 port 5001
[ ID] Interval       Transfer     Bandwidth
[  3]  0.0- 3.0 sec  13.1 MBytes  36.7 Mbits/sec
[  3]  3.0- 6.0 sec  7.12 MBytes  19.9 Mbits/sec
[  3]  6.0- 9.0 sec  6.25 MBytes  17.5 Mbits/sec
[  3]  9.0-12.0 sec  6.75 MBytes  18.9 Mbits/sec
[  3] 12.0-15.0 sec  7.25 MBytes  20.3 Mbits/sec
[  3] 15.0-18.0 sec  6.88 MBytes  19.2 Mbits/sec
[  3] 18.0-21.0 sec  6.12 MBytes  17.1 Mbits/sec
[  3] 21.0-24.0 sec  7.12 MBytes  19.9 Mbits/sec
[  3] 24.0-27.0 sec  7.25 MBytes  20.3 Mbits/sec
[  3] 27.0-30.0 sec  6.12 MBytes  17.1 Mbits/sec
[  3] 30.0-33.0 sec  7.12 MBytes  19.9 Mbits/sec
[  3] 33.0-36.0 sec  7.00 MBytes  19.6 Mbits/sec
[  3] 36.0-39.0 sec  6.12 MBytes  17.1 Mbits/sec
[  3] 39.0-42.0 sec  7.38 MBytes  20.6 Mbits/sec
[  3] 42.0-45.0 sec  6.12 MBytes  17.1 Mbits/sec
[  3] 45.0-48.0 sec  7.12 MBytes  19.9 Mbits/sec
[  3] 48.0-51.0 sec  6.25 MBytes  17.5 Mbits/sec
[  3] 51.0-54.0 sec  7.12 MBytes  19.9 Mbits/sec
[  3] 54.0-57.0 sec  7.12 MBytes  19.9 Mbits/sec
[  3] 57.0-60.0 sec  6.88 MBytes  19.2 Mbits/sec
[  3]  0.0-60.4 sec   142 MBytes  19.8 Mbits/sec