Appendix D - Integration with Azure Monitor to capture health metrics
When configuring the FortiGate-VM as a Network Virtual Appliance (NVA) as part of the Azure vWAN solution, FortiGate can make API calls and send health metrics to Azure for integration with Azure Monitor.
Once Azure Virtual WAN is configured, you can add the FortiGate vWAN virtual hub to Azure Monitor within Azure.This allows Azure to receive metrics from the FortiGate and display them in the Monitor console.
|
|
FortiOS 7.4.2 or later is required. |
To add FortiGate vWAN virtual hub to Azure Monitor:
-
Go to the Azure Portal, and log in.
-
On the left navigation bar, click Monitor. The Monitor | Overview page is displayed.

-
On the Monitor | Overview page, click Metrics.
-
Click Select a scope, choose your Virtual WAN Virtual Hub object, and click Apply.
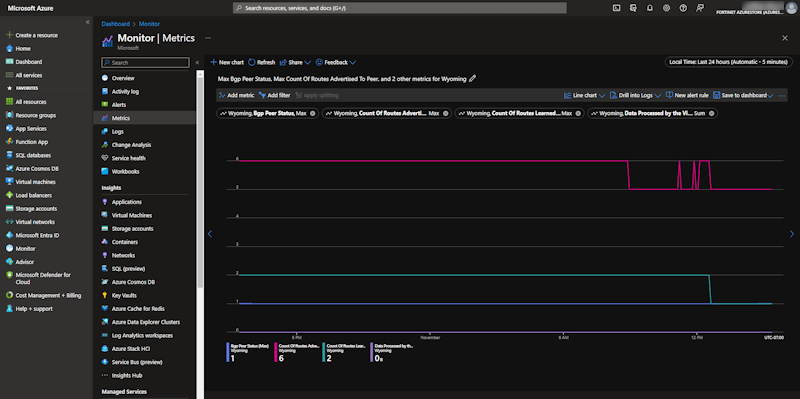
In this example the Virtual WAN Virtual Hub object named Wyoming is selected.
For more information about the fields, see Analyze metrics with Azure Monitor metrics explorer on the Microsoft site.

-
On the Monitor | Metrics page, a line chart displays the metrics for your settings.