Using the DDoS attack log table
The DDoS Attack Log table displays the attack event records for the selected SPP or All SPPs. The DDoS Attack Log table is updated every 1-5 minutes. It contains a maximum of 1 million events (default) to 2 million events depending on Log & Report > LOG CONFIGURATION: Log Purge Settings. If the number of events reaches the maximum allowed, the system deletes the 200,000 oldest events.
Before you begin:
- You must have an administrator account with the System Admin option enabled.
To view and filter the log:
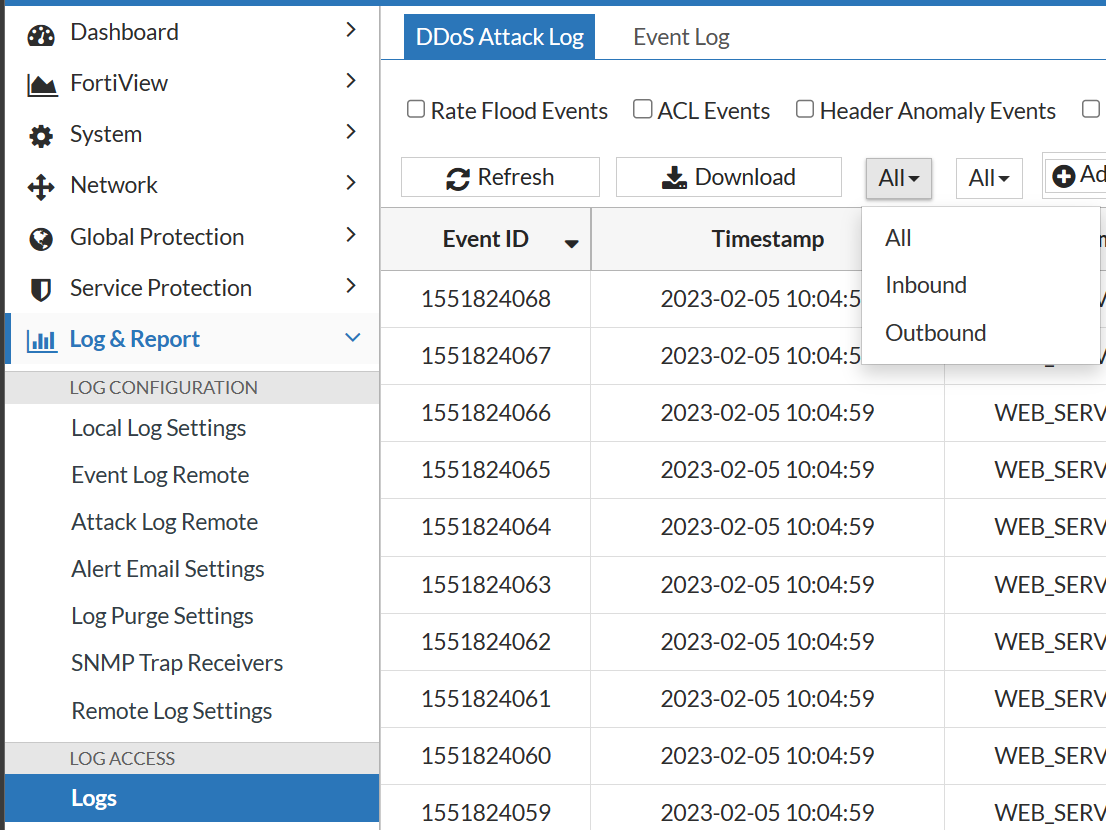
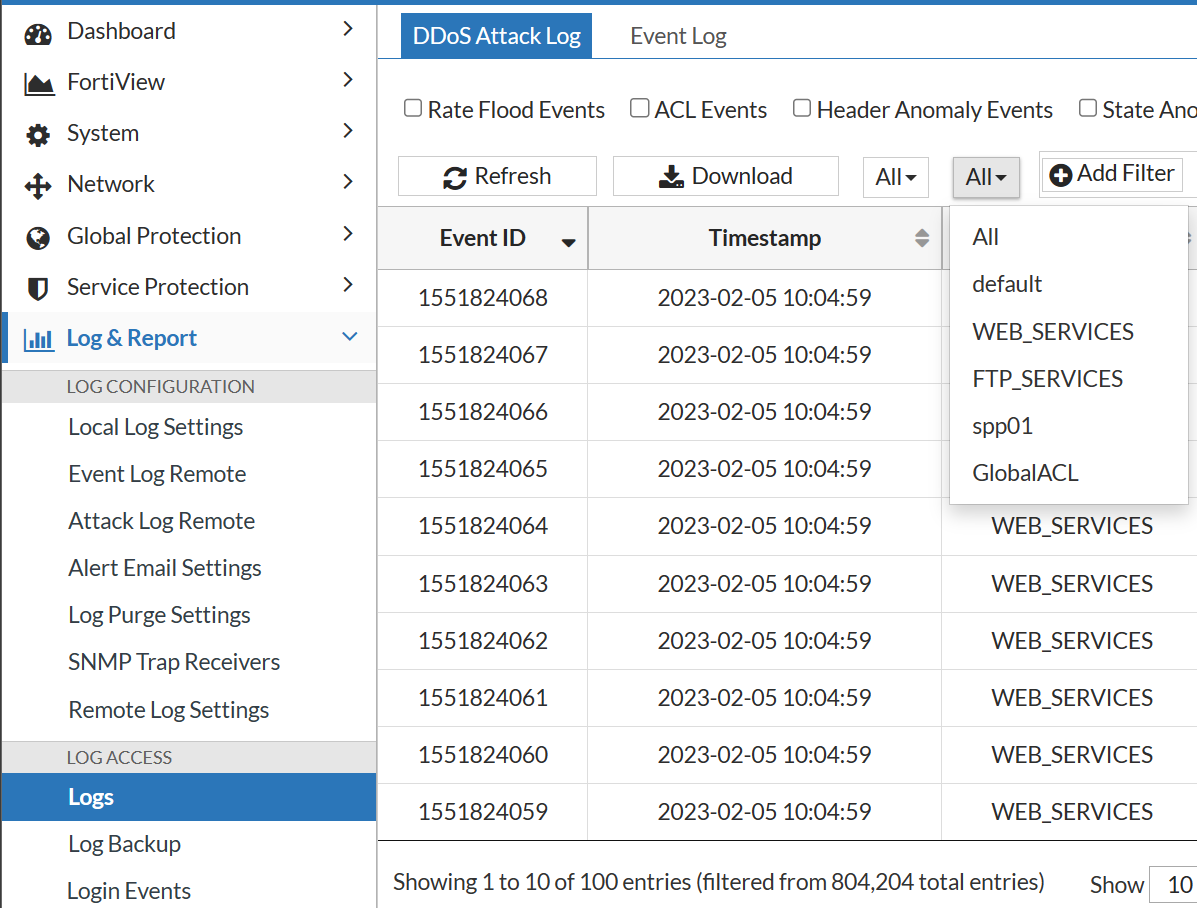
- Go to Log & Report > Log Access > Logs> DDoS Attack Log tab
- Use the check boxes to select the types of attack events to view. If all boxes are unchecked, logs from all events display.
- Select the directionality of the logs to display from the drop-down menu: All logs, Inbound or Outbound logs.

- Select the SPP log to display from the drop-down menu: All SPPs or any of the SPPs listed.

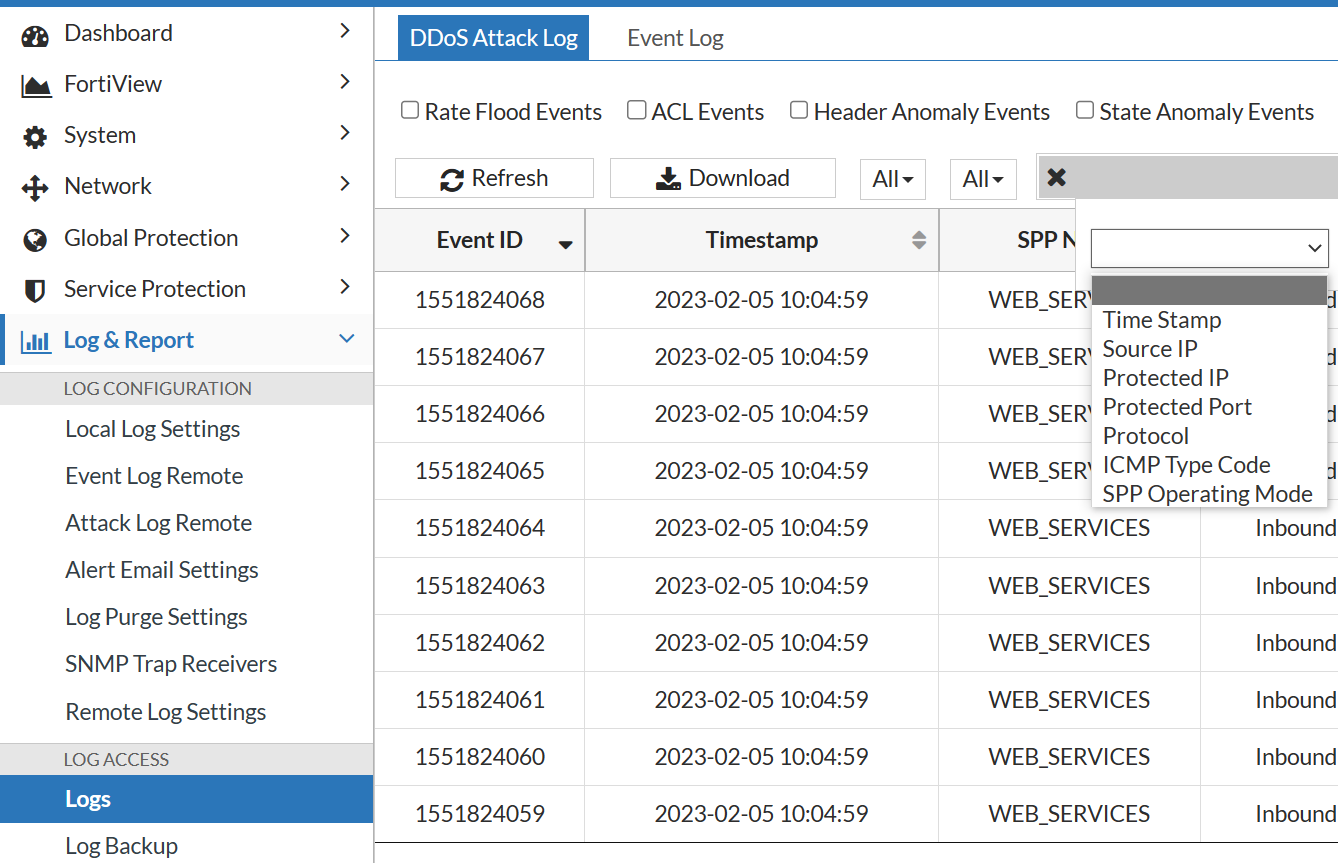
- Click Add Filter to display additional filter tools for Date and Time, Source IP, Protected IP, Layer 3 Protocol, ICMP Type Code, and SPP Operating Mode. Each filter will open additional fields to define the filter.

- Click OK to apply the additional filters.
You can apply multiple filters. Each filter will display in the filter area. You can clear any filter by clicking "x" in the filter description or all filters by clicking Clear All Filters.
- Click OK to apply the additional filters.
Note: These filters are not persistent. If you leave the DDoS Attack Log page, they will be cleared.
Downloading Attack Logs
The Download button will download up to 20,000 filtered or unfiltered Attack Logs in CSV format. To download more than 20,000 logs, use System > Debug. The Customer and Debug files created there provide 100,000 unfiltered Attack Logs.
DDoS Attack Log Fields
| Column | Example | Description |
|---|---|---|
| Event ID | 462380959 |
Log ID |
| Timestamp | 2015-05-05 16:31:00 |
Log timestamp |
| SPP ID | 0 |
SPP ID |
| Source IP | 28.0.0.40 |
Source IP address. Reported only for drops where a single source can be identified as non-spoofed (see Source tracking table). |
| Protected IP | 74.255.0.253 |
Protected IP address.
|
| Direction | Inbound |
Direction: Inbound, Outbound.
|
| Protocol | 6/tcp |
Protocol number/name if assigned. |
| ICMP type/code | 0/8 |
ICMP type/code number |
| Event Type | SYN flood |
Event type |
| Associated port | 69 | Associated port number.
|
| Drop Count | 14 |
Packets dropped per this event. |
| Operating Mode | Prevention |
Prevention or Detection Mode depending on the SPP Setting when the log was generated. Note: Since this indicator was not available prior to 5.2.0, any logs from dates prior to 5.2.0 installation will display “Prevention” no matter what the actual Mode was at that time. |
| Event Detail | '500' |
Reason string. This will be the hash index for HTTP. |
| Subnet ID | 0 |
Subnet ID |
Note: In the DDoS attack log, a table cell displays ”-” (hyphen or a blank) if data is not collected or invalid or multiple values for the same field occur in the same event.
The table displays most recent records first and the columns Event ID, Timestamp, SPP ID, Direction, Event Type and Drop Count. By default, the DDoS Attack Log table displays 10 years of events or the maximum allowed under Log Purge Settings (Default 1M, max 2M). To view the details of an Event, click the Preview icon at the right end of any line.
See Appendix A: DDoS Attack Log Reference for details on log categories and event types.

