Appendix G: Security Fabric Integration
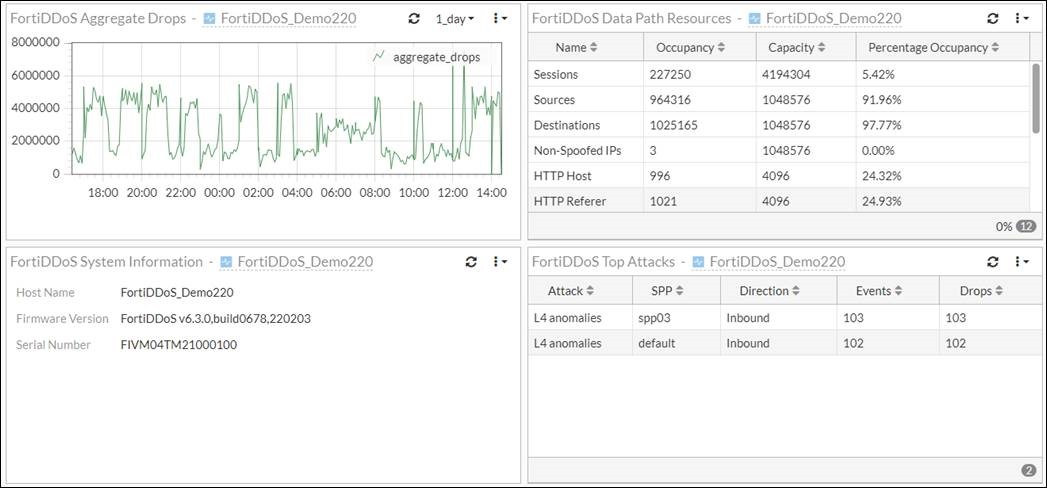
FortiDDoS integration with FortiOS Security Fabric allows the display of 4 different FortiDDoS graphs and tables on any FortiGate Dashboard for single-pane-of-glass review of FortiDDoS operation and performance.
These Security Fabric widgets include:
- Aggregate Drop Graphs with selectable periods from 1-hour to 1-year
- Top Attacks: Aggregate drops for all SPPs for the past 1-day (24 hour) period
- Data Path Resources: Real time view of important system table occupancy
- System Information with firmware release and Serial Number

There are 4 steps required to configure the Security Fabric integration on FortiDDoS and FortiOS:
Step 1 - Create a read-only login for FortiDDoS
Step 2 - Use the FortiGate CLI to create the Fabric Device
Step 3 - Use the FortiGate GUI to create the API token to communicate with FortiDDoS
Step 1 - Create a read-only login for FortiDDoS
- In FortiDDoS, go to System > Admin.
- Click the Access Profile tab.
- Create a new Read-only Profile.
Note: While you can use an existing Profile, for best security, create a read-only profile for this user.
- Click the Administrator tab.
- Create a new Administrator that uses the newly created Read-only access profile.
For added security, you can use the FortiGate Management IP address as the only Trusted Host.
Step 2 - Use the FortiGate CLI to create the Fabric Device
- Login to FortiGate and access the CLI console.
- Use the following commands in the FortiGate CLI to add the fabric device entry:
config system csf
   config fabric-device
      edit "<Name of Device>" //max 35 characters a-Z, “_” or “-“ only, name in double-quotes//
         set device-ip 1.2.3.4 //FortiDDoS Mgmt port IP Address, no subnet//
      next
    end
end
Step 3 - Use the FortiGate GUI to create the API token to communicate with FortiDDoS
- In FortiGate, go to Security Fabric > Fabric Connectors.
- Double-click the FortiDDoS icon to edit the Fabric Connector.
Note: If the FortiDDoS icon is not displayed, refresh the browser.
- In the Edit Fabric Connector configuration editor, click Generate to generate the Access token.

- Enter the FortiDDoS credentials created in Step 1 - Create a read-only login for FortiDDoS and click OK.

- On the Edit Fabric Connector page, click OK then click OK on the confirmation screen.
The FortiDDoS icon will display a green up-arrow to indicate it is online with the Security Fabric and the system name will display in the Topology list at the top-right.
Step 4 - Use the FortiGate GUI to add FortiDDoS Security Fabric widgets to any FortiOS Dashboard (or create a Dashboard specifically for FortiDDoS)
- In FortiGate, go to Dashboard.
- Select any existing Dashboard or create a new Dashboard.

- On the Dashboard, click Add Widget and select Fabric Device.
- Select the FortiDDoS Device and Widget name from the drop-down menu.

- Repeat steps 3 and 4 as needed to add more widgets.

The available widgets are:- Aggregate Drop Graphs with selectable periods from 1-hour to 1-year
- Top Attacks: Aggregate drops for all SPPs for the past 1-day (24-hour) period
- Data Path Resources: Real time view of important system table occupancy
- System Information with firmware release and Serial Number

