Viewing top ten vulnerabilities on endpoints
How to read the Top 10 Vulnerable Endpoints widget:

For example, the Top 10 Vulnerable Endpoints vulnerabilities displays. The Vulnerabilities are shown in a segmented bar graph and organized by severity:
WIN-POIC6JQ9U4U has the following:
- 15 Critical Vulnerabilities (red bar)
- 17 High Risk Vulnerabilities (orange bar)
- 17 Medium Risk Vulnerabilities (yellow bar)
- 6 Low Risk Vulnerabilities (green bar)
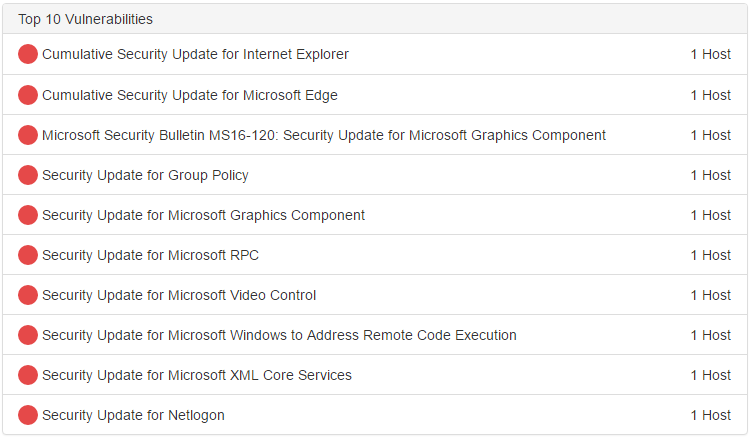
How to read the Top 10 Vulnerabilities widget:

The Top 10 Vulnerabilities widget displays the type of vulnerability and how many hosts have the vulnerability. For example, the Cumulative Security Update for Internet Explorer Vulnerability has one host affected.
When you click a vulnerability, you are redirected to the FortiGuard Labs Threat Encyclopedia where details about the vulnerability are available.


