
WAF Application Dashboard
This dashboard displays general security insights from the WAF service.
Please see the table below for a description on each of the widgets displayed on this page.
|
Widget |
Description |
|---|---|
|
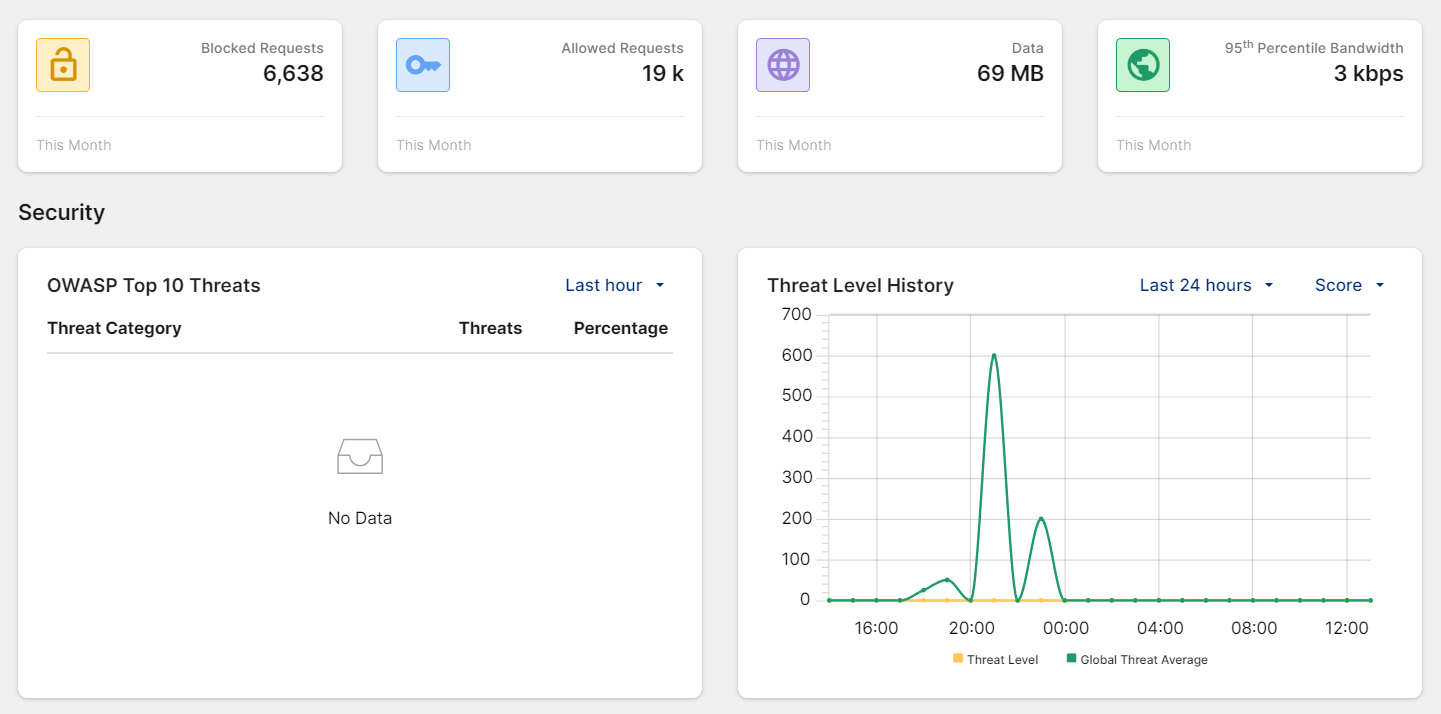
Monthly Counts |
Shows the total number of the following transactions for the current calendar month:
|
|
Security |
|
|
OWASP Top 10 Threats |
The OWASP Top 10 risk(s) observed in your application traffic. The OWASP Top 10 is a list of the most critical security risks to web applications, published by the Open Web Application Security Project (OWASP). |
|
Threat Level History |
This graph shows the Threat Level of your application traffic over the adjustable time frame (default = last 24 hours). You can adjust the time frame, and choose to view the Threat Level (y-axis) as either a score (0-700) or a percentage. Attacks are assigned a score based on its severity:
The system calculates a threat score every 5 minutes by aggregating attack scores based on their severity. For instance, if there are two critical attacks (score of 50 each) and one high-level attack (score of 30) within this timeframe, the total threat score is calculated as 50*2+30=130. Threat Scores and their corresponding severity levels:
|
|
Threat Level |
The threat level in the last hour on a scale from low to critical, followed by an ordered table with more information on the detected threats. |
|
Incidents |
A line graph displaying the number of incidents falling under low, moderate, and high threat levels over the adjustable time frame (default = last hour). |
|
Top Incidents by Severity |
A ranked list of incidents from the selected time frame (default: last hour), ordered by their threat level, starting with the highest. To view additional details, click on an incident in the list. |
|
Top Known Threats |
A ranked list of threats from the selected time frame (default: last hour), ordered by their threat level, starting with the highest. To view additional details, click on an incident in the list. |
|
Vulnerability Scan |
Insights from Vulnerability Scan. The Vulnerability Scan module integrates FortiDAST's web vulnerability scanner (WVS) to help identify OWASP Top 10 vulnerabilities in web applications and provides a detailed report with remediation recommendations to enhance security. The Vulnerability Scan report reflects your current WAF configuration, highlighting vulnerabilities that remain exposed to attackers. This helps you fine-tune WAF settings to improve security. |
|
Traffic |
|
|
Throughput |
A line chart displaying the level of throughput of HTTP, HTTPS, and Cached traffic. |
|
Incoming Requests |
A line chart displaying blocked, allowed, and cached incoming requests. |
|
Traffic Statistics by Country |
A world map that highlights the countries with the highest traffic. |
|
Other |
|
|
Server Status |
Displays the numbers of servers that are Healthy, Unhealthy, and Health Check Disabled with a condensed list of all servers. Click All Servers to navigate to Origin Servers. |
|
Subscription Services |
Lists the WAF services available to you based on your license tier, along with their expiration date and status. |