
Bot Monitor
Track monthly bot activity or define special events to create reports on your application's activity during specific time frames.
Configure custom bot monitoring events:
-
Click Event.
-
Fill out the following fields:
Field Description Event Name Name the event you would like to monitor (eg., product release day, New Year's Eve). Start Time Set the start time of the event End Time Optional; event is ongoing when empty. URL Optional; the URL(s) you would like to monitor. When empty, all of the URLs on your application's domain are monitored. Description Optional; enter a description that will help you keep track of the different events.
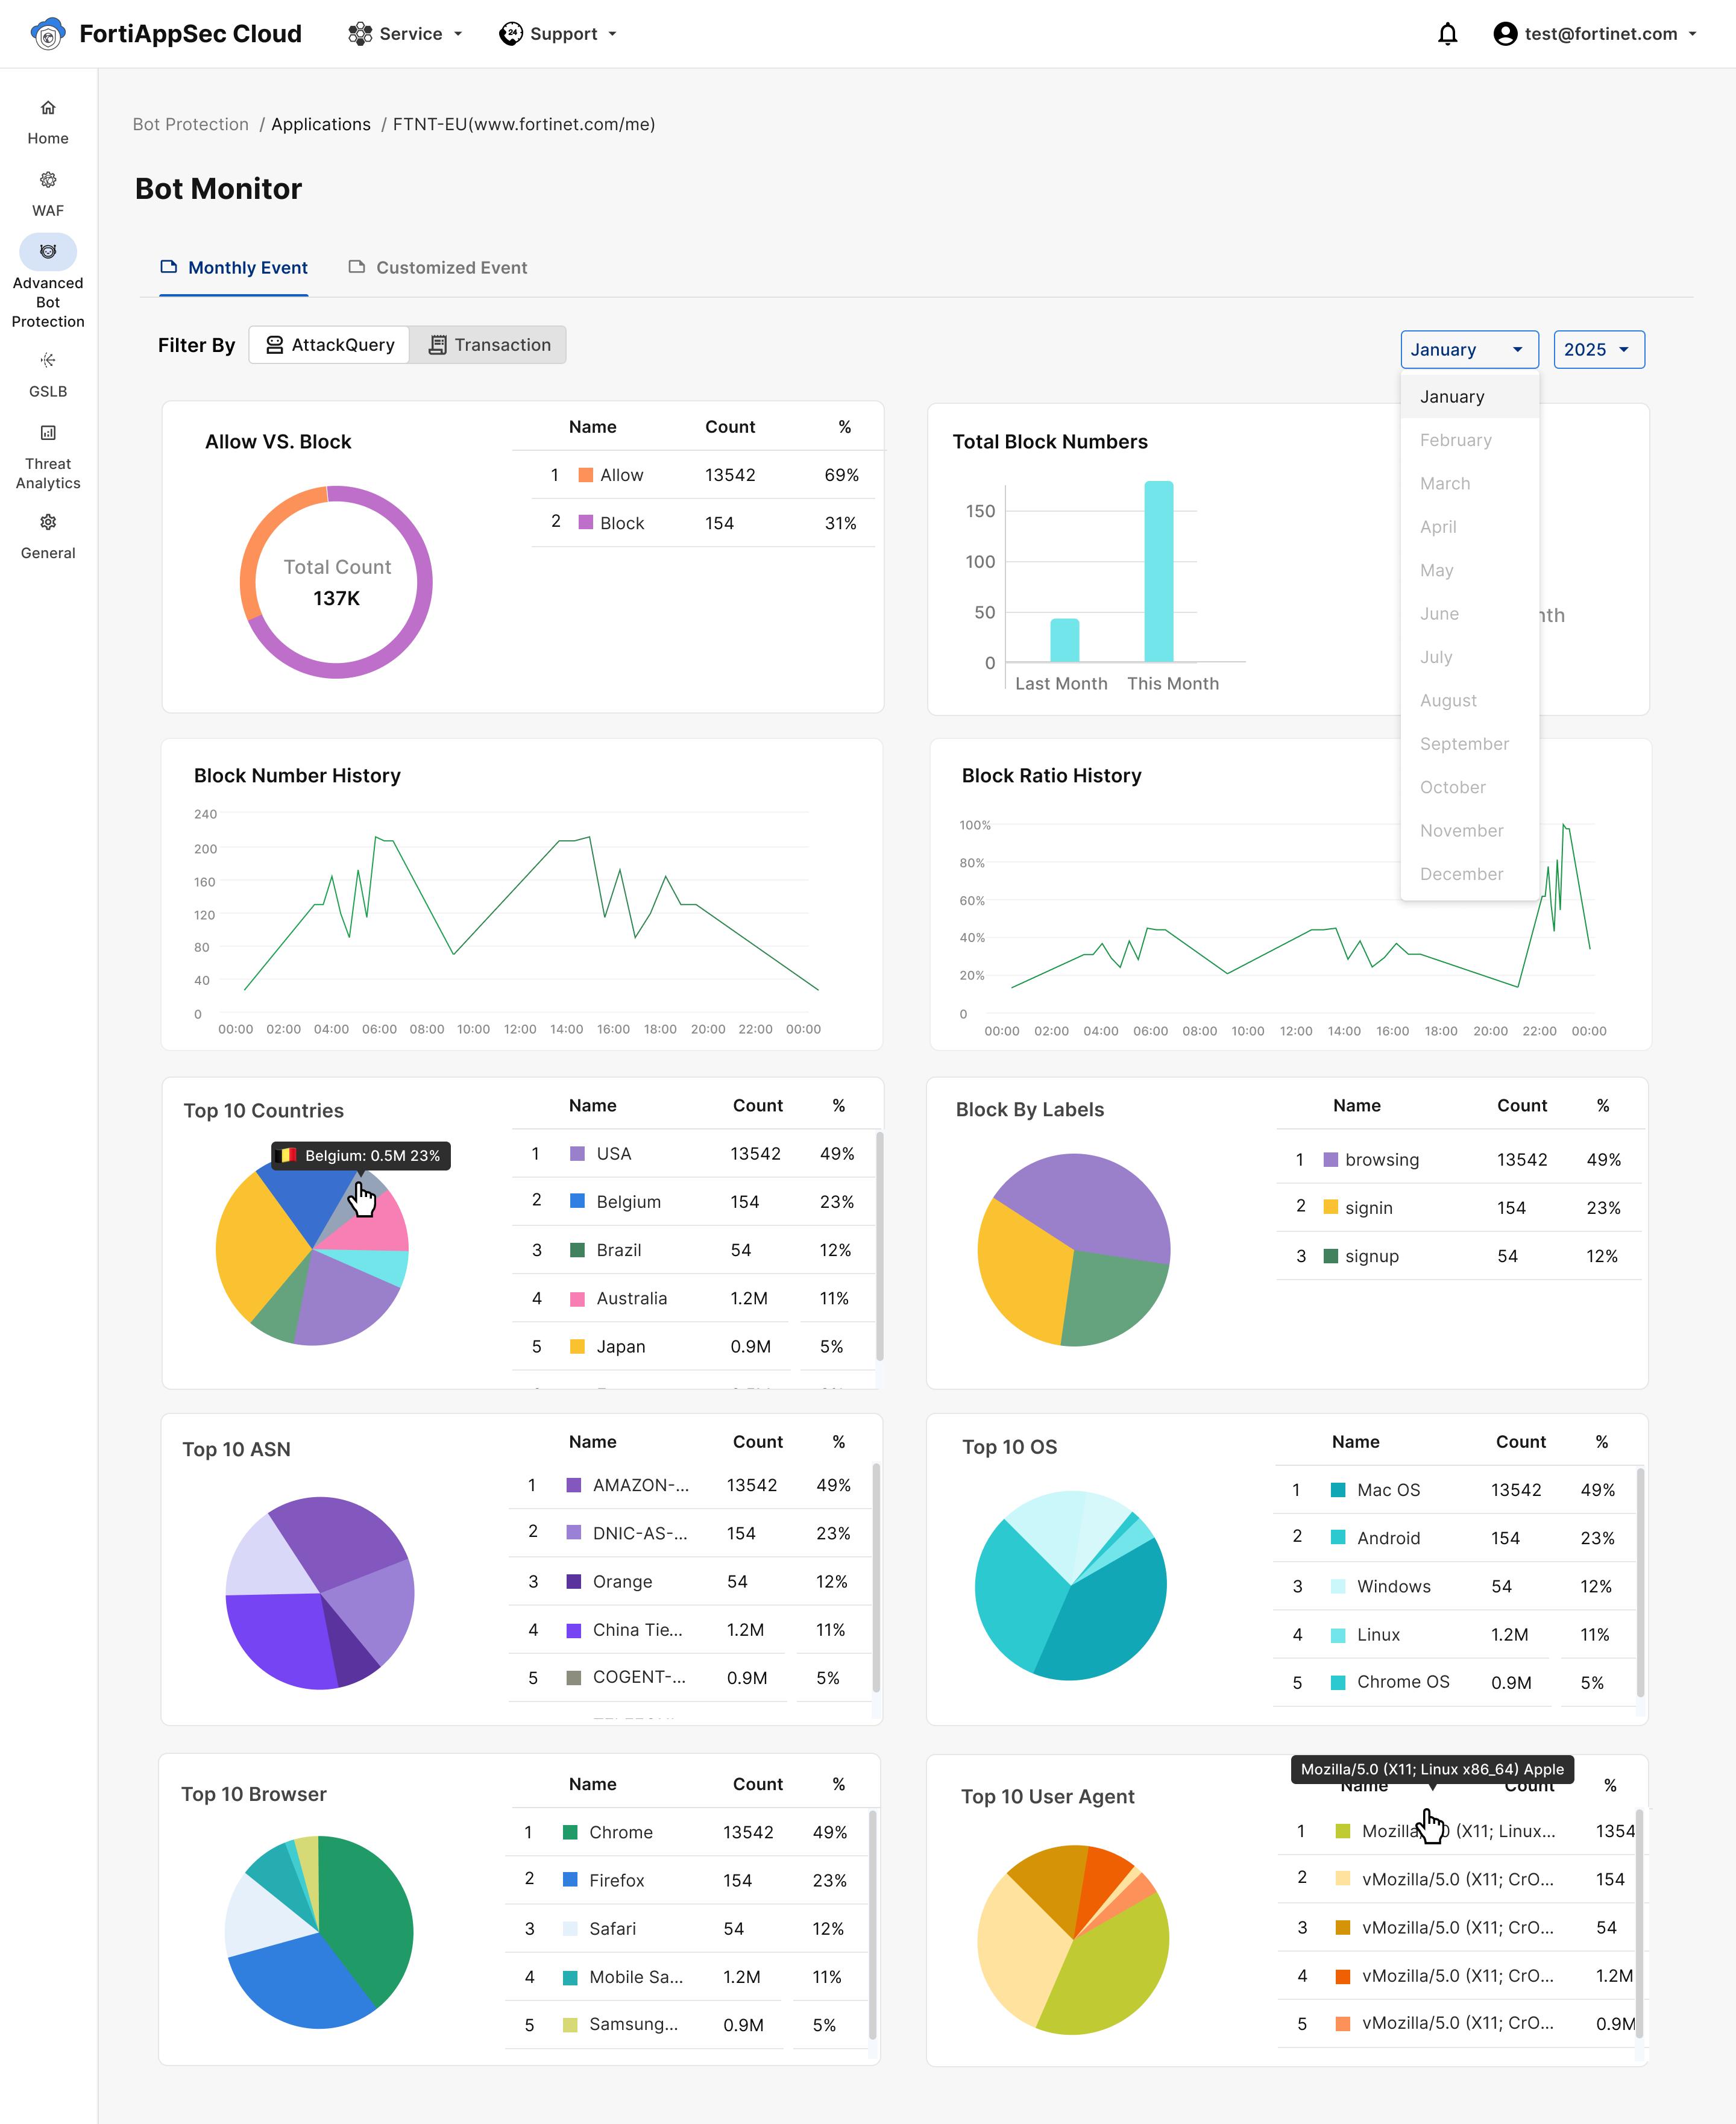
Bot Monitor
The Bot Monitor charts illustrate the following:
|
Static Component |
Description |
|---|---|
|
Allow VS Block |
Displays the proportion of suggested action = Allow versus suggested action = block, within all AttackQueries or Transactions. Choose whether you want to see this display for attack queries or transactions. Use this pie chart to gain insight on the proportion of malicious bot traffic to benign human or bot traffic. |
| Total Block Numbers |
Displays the block count for selected month and compares it to the previous month, highlighting the change. |
|
Block Number History |
Line charts show the number of blocks over 24 hours, allowing trend analysis throughout the day. |
|
Block Ratio History |
Line charts show the block ratio over 24 hours, allowing trend analysis throughout the day. |
| Category pie charts |
Pie charts display the distribution of bot traffic across key categories:
Hover your cursor over the charts to view the count associated with each bar or pie slice. |