
Predefined basic event handlers
FortiAnalyzer includes many predefined event handlers that you can use to generate events. You can easily create a custom event handler by cloning a predefined event handler and customizing its settings. See Cloning event handlers.
If you wish to recieve notifications from a pedefined event handler, configure a notification profile and assign it to the event handler. See Creating notification profiles.
|
|
In 6.2.0 and up, predefined event handlers have been consolidated and have multiple rules that can be enabled or disabled individually. |
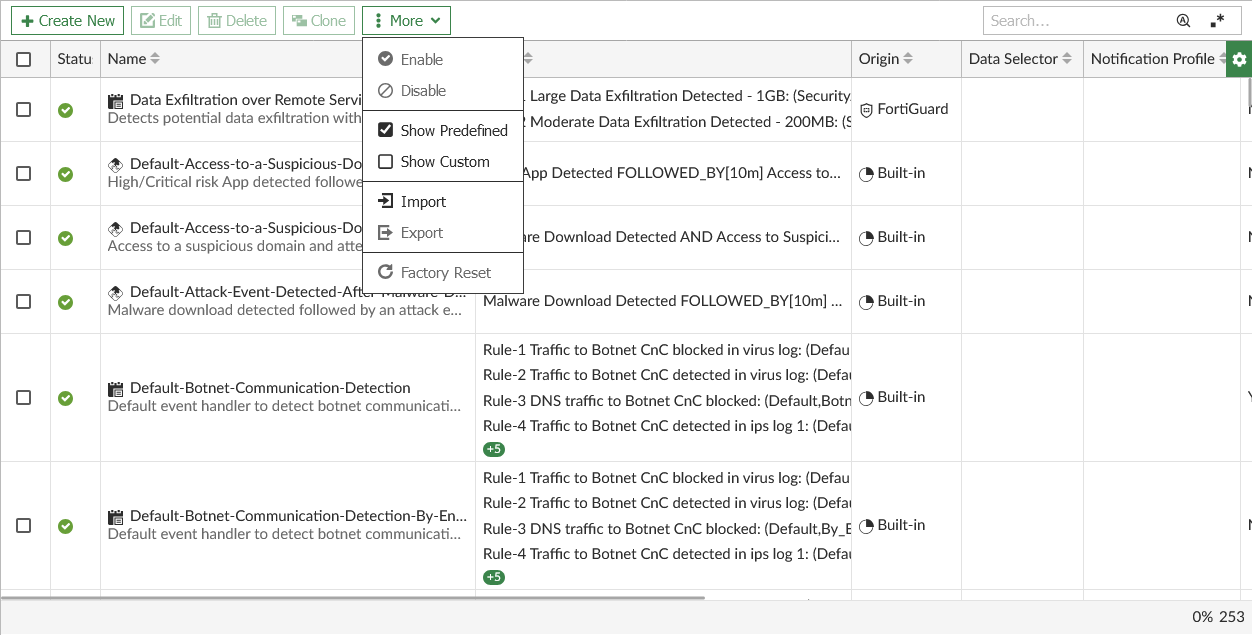
To view predefined event handlers in the FortiAnalyzer GUI, go to Incidents & Events > Event Handlers > Event Handlers. From the More dropdown, select Show Predefined. The predefined event handlers display with Origin = Built-in. An icon in the Name column indicates if the event handler is a basic event handler or a correlation event handler. For more information about correlation event handlers, see Predefined correlation event handlers.
The following are a small sample of FortiAnalyzer predefined basic event handlers.
|
Event Handler |
Description |
|---|---|
|
Default-Compromised-Host-Detection-IOC-By-Threat |
Default event handler to detect compromised hosts by FortiAnalyzer IOC feature grouped by threat. Enabled by default MITRE Tech IDs:
Rule 1: Traffic to CnC detected
Rule 2: Web traffic to CnC detected
Rule 3: DNS traffic to CnC detected
Rule 4: Traffic to CnC event detected by FortiGate
|
|
Default-Data-Leak-Detection-By-Threat |
Default data leak detection handler grouped by threat. Disabled by default MITRE Tech ID:
Rule 1: Data leak detected
Rule 2: Data leak blocked
|
|
Default-Sandbox-Detections-By-Endpoint |
Default handler to track file submission and malware detection by FortiSandbox grouped by endpoint. Disabled by default MITRE Tech IDs:
Rule 1: Malware detected
Rule 2: Malware blocked
Rule 3: Sandbox detected Malware
|
|
Default-Shadow-IT-Events |
Default event handler to detect unsanctioned user, application and file exfiltration for cloud access. This event handler requires a FortiCASB connector configured on FortiAnalyzer. See Configuring security fabric connectors. This automatically creates the Get Cloud Service Data (FortiCasb Connector) playbook, which must be enabled for this event handler to generate events. See Playbooks. Disabled by default MITRE Tech ID:
Rule 1: Unsanctioned Applications detected
Rule 2: File Exfiltration Attempts detected
Rule 3: Unsanctioned Users detected
|
|
Local Device Event |
Default local device event handler. Available only in the Root ADOM. Enabled by default Data Selector: Default Local Device Selector Rule 1: Critical or important events
|
|
Default-NOC-Interface-Events |
Event handler for FortiGate device type logs to generate events for vlan/interface status up or down, and DNS service on interface status. Disabled by default MITRE Tech ID:
Rule 1: Interface status changed to up
Rule 2: Interface status changed to down
Rule 3: DNS server config added
Rule 4: DNS server config deleted
|
|
Default-NOC-FortiExtender-Events |
Event handler for FortiGate device type logs to generate events for FortiExtender alerts, authorization and controller activity events. Disabled by default MITRE Tech ID:
Rule 1: FortiExtender Authorized
Rule 2: Warning event detected
Rule 3: Alert event detected
Rule 4: Critical event detected
Rule 5: Error event detected
Rule 6: Emergency event detected
Rule 7: FortiExtender controller activity detected
Rule 8: FortiExtender controller activity error detected
|
|
Default-NOC-Routing-Events |
Event handler for FortiGate device type logs to generate events for changes in routing information including BGP Neighbor Status, Routing information change, OSFP Neighbor Status, Neighbor Table Changed and VRRP State Changed. Disabled by default Rule 1: Routing information changed
Rule 2: BGP neighbor status changed
Rule 3: OSPF or OSPF6 neighbor status changed
Rule 4: Neighbor table changed
Rule 5: VRRP state changed
|
|
Default-NOC-Network-Events |
Event handler for FortiGate device type logs to generate network events including SNMP queries, routing information changes, DHCP server and status changes. Disabled by default Rule 1: Device SNMP query failed
Rule 2: Device routing information changed
Rule 3: DHCP client lease granted or usage high
Rule 4: SNMP enabled
Rule 5: SNMP disabled
Rule 6: DHCP server status changed
Rule 7: DHCP lease renewed
Rule 8: DHCP lease released
|
|
Default-NOC-Switch-Events |
Event handler for FortiGate device type logs to generate events for Switch-Controller added/deleted or authorized/deauthorized, Switch-Controller Status, Interface flapping, LAG/MCLAG and split-brain status, Cable test/diagnosis and physical port up/down. Disabled by default MITRE Tech ID:
Rule 1: Switch-Controller activity detected
Rule 2: Vlan interface change has occurred
Rule 3: Port switch detected
Rule 4: Device flap detected
Rule 5: Device LAG-MCLAG status change
Rule 6: Device MCLAG split-brain detected
Rule 7: Device cable diagnose detected
Rule 8: Device come up detected
Rule 9: Device gone down detected
|
|
Default-NOC-HA-Events |
Event handler for FortiGate device type logs to generate events for HA cluster updates and alerts including HA Device interface failure, Cluster Priority Changed, cluster member state moved, device interface down, HA device syncronization status, connection to FortiAnalyzer status, FortiManager tunnel connection status and connection with CSF member status. Disabled by default MITRE Tech ID:
Rule 1: HA device interface failed
Rule 2: Device set as HA primary
Rule 3: Cluster state moved or Heartbeat device interface down
Rule 4: Synchronization activity detected
Rule 5: FortiAnalyzer connection up
Rule 6: FortiAnalyzer connection failed
Rule 7: Upstream connection with CSF member established and authorized
Rule 8: Upstream connection with authorized CSF member terminated
Rule 9: FortiManager tunnel connection up
Rule 10: FortiManager tunnel connection down
|
|
Default-NOC-Wireless-Events |
Event handler for FortiGate device type logs to generate events for wireless wifi, AP updates and alerts including AP Status Change and Fake/Rogue AP detection, wireless client status change added/removed/allowed or denied status, signal to noise ratio (SNR) poor/fair/good, SSID status up/down. Disabled by default Rule 1: Fake AP detected
Rule 2: Rogue AP detected
Rule 3: Wireless event log id matched
Rule 4: Wireless client activity detected
Rule 5: Signal-to-noise ratio is poor
Rule 6: Signal-to-noise ratio is fair
Rule 7: Signal-to-noise ratio on is excellent
Rule 8: Physical AP radio ssid up
Rule 9: Physical AP radio ssid down
|
|
Default-NOC-Security-Events |
Event handler for FortiGate device type logs to generate events for security events including Admin Logins failed or disabled, Admin or Admin Monitor Disconnected, Admin password expired and UTM Profile changes. Disabled by default Rule 1: Admin login failed or desabled
Rule 2: Admin password expired
Rule 3: Admin disconnected
Rule 4: AV or IPS change detected
|
|
Default-NOC-Fabric-Events |
Event handler for FortiAnalyzer and FortiGate log device type to detect Fabric events, including device offline, CSF member connection status down or terminated, CSF member configuration changes, automation stitch triggered , licenses that are expiring or failed updates. Disabled by default MITRE Tech ID:
Rule 1: Device offline detected
Rule 2: FortiAnalyzer connection down detected
Rule 3: Connection with authorized CSF member terminated
Rule 4: Automation stitch triggered
Rule 5: Device license failed or expiring detected
Rule 6: System update or failure detected
Rule 7: Security fabric settings change detected
|
|
Default-NOC-System-Events |
Event handler for FortiGate device type logs to generate events for system events including Power failure and device shutdown, High Resource usage (CPU, Mem, Storage), log device full status warnings and disk rolled, and devices entering/exiting conserve mode. Disabled by default MITRE Tech IDs:
Rule 1: Device shutdown detected
Rule 2: Device conserve mode detected
Rule 3: Disk or memory is full
Rule 4: Device high CPU consumption detected
Rule 5: Device high memory consumption detected
|
|
Default-NOC-VPN-Events |
Event handler for FortiGate device type logs to generate events for VPN status changes including IPsec Phase1 error or failure, and Phase2 Up/Down and errors, Ipsec Tunnel Up/Down, VPN SSL login failures, IPSec ESP Error, IPsec DPD failures. Disabled by default MITRE Tech IDs:
Rule 1: User SSL VPN login failed
Rule 2: IPsec phase 1 error or status fail detected
Rule 3: IPsec ESP error detected
Rule 4: IPsec DPD failed
Rule 5: Device tunnel-up or tunnel-down detected
Rule 6: IPsec phase 2 error detected
Rule 7: Device phase2-up or phase2-down detected
|
|
Default-NOC-SD-WAN-Events |
Event handler for FortiGate device type logs to generate events for SD-WAN status, alerts, and health check events including SLA targets/SLA met or not met for jitter, latency, packetloss, Health-check server status (alive or dead), status (up or down), and member status change. Disabled by default MITRE Tech IDs:
Rule 1: SLA failed for jitter
Rule 2: SLA failed for latency
Rule 3: SLA failed for packetloss
Rule 4: Device status changed to die
Rule 5: Device status changed to alive.
Rule 6: Device status is up
Rule 7: Device status is down
Rule 8: Number of pass member changed
Rule 9: Member status changed
|
|
Default-NOC-Docker-Events |
Event handler for FortiGate device type logs to generate events for Docker including inlcuding container enabled/disabled, CPU value set/max reached and MEM value set/max reached. Disabled by default Rule 1: Memory report detected
Rule 2: CPU report detected
Rule 3: Status changed to disable
Rule 4: Status changed to enable
|
|
ZTNA Brute Force Login |
Detects various brute force login attempts in ZTNA environments. Enabled by default Rule 1: High Volume of Failed Authentications from Multiple Non-Existing Users Triggers an event when 100 or more non-existing users have failed authentications to a host name within 10 minutes.
Rule 2: Authentication Failed from Multiple Geo Locations Triggers an event when an existing account fails to authenticate from three or more different geo locations within five minutes.
Rule 3: Brute Force Login Attack Triggers an event when and existing user has 10 or more failed authentications with an event profile containing AUTH_FAIL_LOCK within 10 minutes.
Rule 4: High Volume of Failed Authentications to Same Non-Existing User Triggers an event when a non-existing user has at least 100 or more failed authentications within 1440 minutes (one day).
|
|
ZTNA Login Anomaly Detection |
Detects various suspicious login scenarios in ZTNA environments. Enabled by default Rule 1: Authentication to Multiple Services Failed Triggers an event when a user has failed authentications to three or more services within 10 minutes.
Rule 2: Successful Authentication from Multiple Geo Locations Triggers an event when a user has successful authentication from three or more unique geo locations within 10 minutes.
Rule 3: Successful Authentication from Multiple Endpoints Triggers an event when a user has successful authentication from five or more different host_IPs within 10 minutes.
Rule 4: Successful Authentication from Sanctioned Countries Triggers an event when a user has at least one successful authentication from sanctioned countries within 10 minutes.
|
Below are examples of raw logs that would trigger the associated default event handler.
|
Default Event Handler |
Example Log |
|---|---|
|
Local Device Event |
id=6872390755323740160 itime=2020-09-14 10:06:03 euid=1 epid=1 dsteuid=1 dstepid=1 log_id=0034043006 subtype=logdb type=event level=warning time=10:06:03 date=2020-09-14 user=system action=delete msg=Requested to trim database tables older than 60 days to enforce the retention policy of Adom root. userfrom=system desc=Trim local db devid=FAZ-VMTM20001572 devname=FAZ-VMTM20001572 dtime=2020-09-14 10:06:03 itime_t=1600103163 |
|
Default-Compromised Host-Detection-by IOC-By-Threat |
date=2020-09-20 time=07:41:20 id=6874471739997290516 itime=2020-09-20 00:41:20 euid=3 epid=1161 dsteuid=3 dstepid=101 type=utm subtype=ips level=warning sessionid=917509475 policyid=2 srcip=172.16.93.164 dstip=5.79.68.109 srcport=51392 dstport=80 proto=6 logid=0421016399 service=HTTP eventtime=1537181449 crscore=30 crlevel=high srcintfrole=lan dstintfrole=wan direction=outgoing url=/ hostname=survey-smiles.com profile=default eventtype=malicious-url srcintf=95-FortiCloud dstintf=OSPF msg=URL blocked by malicious-url-list devid=FG100D3G02000011 vd=root dtime=2020-09-20 07:41:20 itime_t=1600587680 devname=FG100D3G02000011 |
| Default-Risky-App-Detection-By-Threat | date=2020-09-20 time=07:41:23 id=6874471752882192399 itime=2020-09-20 00:41:23 euid=3 epid=1201 dsteuid=3 dstepid=101 type=utm subtype=app-ctrl level=information action=pass sessionid=3003333495 policyid=79 srcip=172.16.80.218 dstip=122.195.166.40 srcport=38625 dstport=26881 proto=6 logid=1059028704 service=tcp/26881 eventtime=1537399002 incidentserialno=603516169 crscore=5 crlevel=low direction=outgoing apprisk=high appid=6 srcintfrole=lan dstintfrole=wan applist=scan appcat=P2P app=BitTorrent eventtype=app-ctrl-all srcintf=80-software-r dstintf=port7 msg=P2P: BitTorrent_HTTP.Track, devid=FG100D3G02000011 vd=root dtime=2020-09-20 07:41:23 itime_t=1600587683 devname=FG100D3G02000011 |
|
Default_NOC_Routing_Events |
date=2021-02-08 time=10:36:09 eventtime=1612809370040652208 tz="-0800" logid="0103027001" type="event" subtype="router" level="information" vd="root" logdesc="VRRP state changed" interface="port1" msg="VRRP vrid 200 vrip 172.17.200.200 changes state from Master to Backup due to ADVERTISEMENT with higherer priority received" |
FortiOS system events
FortiOS predefined system event handlers are consolidated into a single event handler with multiple rules called Default-FOS-System-Events.
Events are organized by device in the Incidents & Events dashboards, which can be expanded to view all related events.
Default-FOS-System-Events rules apply tags to each event, allowing you to identify which Default-FOS-System-Events rule triggered the event.
|
|
If you are upgrading from a version before FortiAnalyzer 6.2.0, the existing legacy predefined handlers which are enabled or have been modified will be available as custom handlers. In the Event Handler List, select the More dropdown and choose Show Custom. |