About the connector
Splunk is a SIEM software that allows searching, monitoring, and analyzing machine-generated big data, using a web-style interface. For more information, see the Splunk website.
This document provides information about the Splunk connector, which facilitates automated interactions, with a Splunk server using FortiSOAR™ playbooks. Add the Splunk connector as a step in FortiSOAR™ playbooks and perform automated operations, such as retrieving details and events for a Splunk alert, and running a search query on the Splunk server.
FortiSOAR provides powerful bi-directional integration with Splunk. While the Splunk connector provides out-of-the-box support for scheduled data ingestion from Splunk using FortiSOAR™'s Data Ingestion Wizard, the FortiSOAR Splunk add-on can be optionally installed on the Splunk Search Head for some additional capabilities such as automatically creating FortiSOAR Alerts and Incidents from events and alerts forwarded from Splunk, triggering FortiSOAR playbooks directly from the Splunk User Interface, etc. For more information on the Fortinet FortiSOAR Splunk Add-on, see Splunk Add-on documentation. For more information on using FortiSOAR™'s Data Ingestion Wizard to easily ingest data into FortiSOAR™ by pulling events from Splunk, see the Data Ingestion Support section.
Version information
Connector Version: 2.0.0
FortiSOAR™ Version Tested on: 7.4.3-3294
Splunk Version Tested on: Splunk Enterprise 9.0.0.1
Authored By: Fortinet
Certified: Yes
Release Notes for version 2.0.0
The following enhancements have been made to the Splunk Connector in version 2.0.0:
- Added a new configuration parameter named Authentication Type to support authentication using tokens created on Splunk.
- Updated the output schema of the following actions:
- Get Results for a Search
- Fetch Records from Collection
- Get Events for a Search
Splunk 8.1 support
Users need to consider the following key points for the Splunk upgrade:
- Python 3 and above is supported on Splunk 8.1. There is no support for Python 2.
- Users on Splunk 8.1.x and installing the connector and/or the add-on for the first time must use version 1.6.3 or later of the Splunk connector, and the Splunk add-on version 3.0.1 or later.
- Users who have already configured ingesting Splunk data into FortiSOAR and are upgrading to Splunk 8, must do the following:
- Users who are using the CyberSponse add-on on Splunk to forward data, need to install the new FortiSOAR Add-on and remove/deactivate the CyberSponse add-on.
- Users who are upgrading from Splunk connector 1.6.0 or older must update the data ingestion playbooks to remove the use of
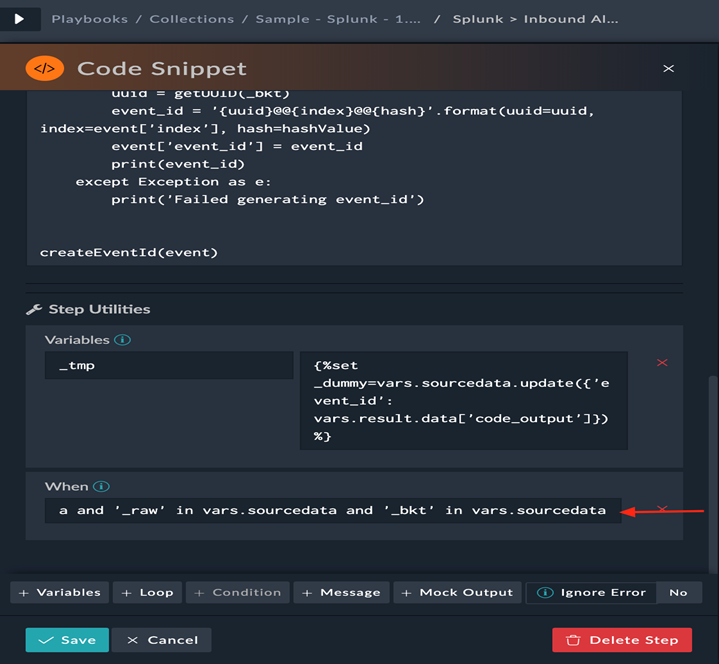
_bkt key as this key is now not present, by default, in Splunk events. Users need to update the following playbook steps in version 1.6.0 of the connector (Refer to the sample playbook collection that is included with the Splunk connector version 1.6.3 or later for the playbook update):
- In the Splunk > Inbound Alert playbook, update the “Calculate Event ID” step with the following 'when' condition:
'_time' in vars.sourcedata and '_raw' in vars.sourcedata and '_bkt' in vars.sourcedata
See the following image:
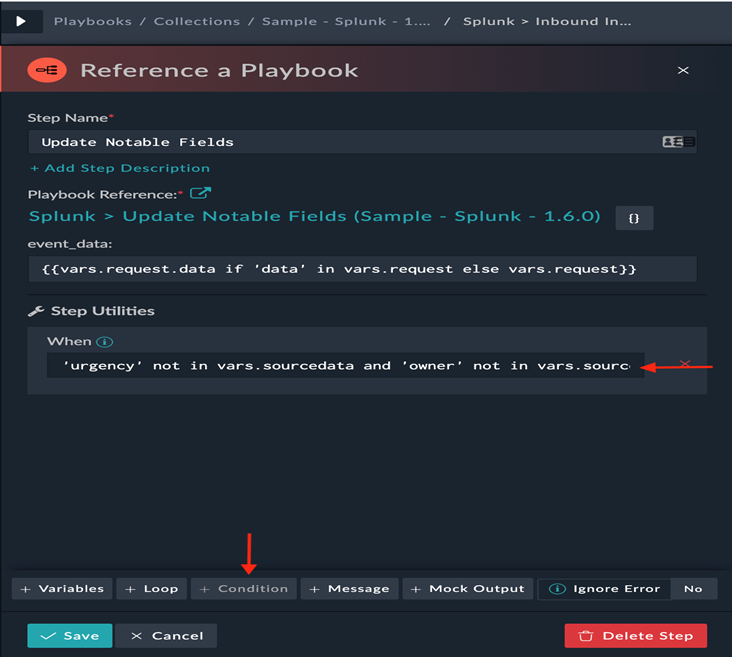
- Update In Splunk > Inbound Incident playbook as follows:
- Update the “Update Notable Fields” step, and add the following '
when' condition:
'urgency' not in vars.sourcedata and 'owner' not in vars.sourcedata and 'event_id' in vars.sourcedata and 'notable' in vars.sourcedata.event_id
See the following image:
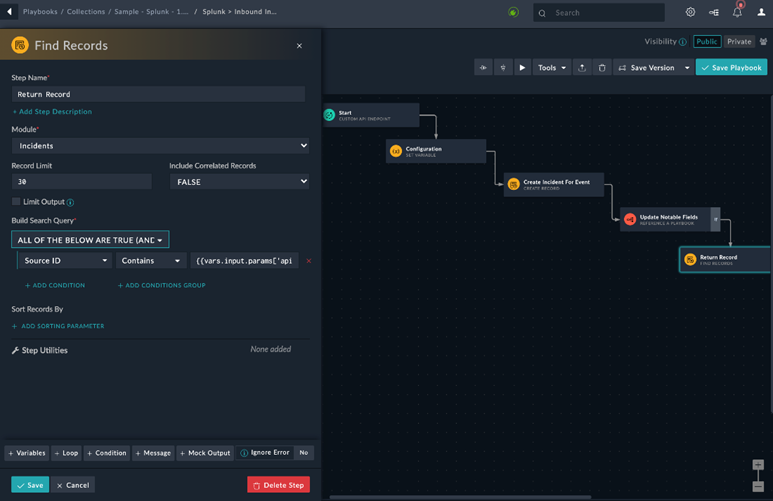
- Add a Find Record step named “Return Record” after the “Update Notable Fields“ step.
In the "Return Record" step, select Incident as the Module, and in filters specify:
Source ID Contains {{vars.input.params['api_body']['event_id']}
See the following image:
Installing the connector
Use the Content Hub to install the connector. For the detailed procedure to install a connector, click here.
You can also use the following yum command as a root user to install connectors from an SSH session:
yum install cyops-connector-splunk
Prerequisites to configuring the connector
- You must have the URL and credentials of the Splunk server on which you will perform the automated operations. You must also have the credentials of a user, who has a right to configure custom applications on the Splunk server.
- The FortiSOAR™ server should have outbound connectivity to port 443 on the Splunk server.
- You must enable the Splunk REST API.
- If you want to automatically forward events and alerts from Splunk to FortiSOAR™ and directly create FortiSOAR Alerts and Incidents from Splunk's events, or trigger playbooks from the Splunk User Interface itself, etc., you can install and configure the Fortinet FortiSOAR Splunk Add-on. For more information, see Splunk Add-on documentation.
Minimum Permissions Required
Configuring the connector
For the procedure to configure a connector, click here.
Configuration parameters
In FortiSOAR™, on the Content Hub (or Connector Store) page, click the Manage tab, and then click the Splunk connector card. On the connector popup, click the Configurations tab to enter the required configuration details.
| Parameter |
Description |
| Server Address |
IP or FQDN of the Splunk server to which you will connect and perform automated operations.
For example, mySplunkServer. |
| Username |
Username to access the Splunk endpoint. |
| Authentication Type |
Select the authentication type. You can choose from the following options:
- Using Password: Specify the password to access the Splunk endpoint in the Password field.
- Using Authentication Token: Specify the authentication token to access the Splunk endpoint in the Authentication Token field.
|
| Protocol |
The protocol to be used to communicate with the Splunk server. Choose either http or https. By default, this is set to https. |
| Splunk API Port |
REST API port of the Splunk server.
Defaults to 8089. |
| Application Namespace |
The namespace to be used for invoking all of the Splunk APIs.
For more information about namespaces, see Splunk Documentation. |
| Verify SSL |
Specifies whether the SSL certificate for the server is to be verified or not. |
Actions supported by the connector
The following automated operations can be included in playbooks, and you can also use the annotations to access operations:
| Function |
Description |
Annotation and Category |
| Invoke Search |
Invokes a search on the Splunk server. |
search_query
Investigation |
| Get Details for a Search |
Retrieves the details for a Splunk search. |
get_result
Investigation |
| Get Events for a Search |
Retrieves the event details for a Splunk search. |
get_events
Investigation |
| Get Results for a Search |
Retrieves the results for a Splunk search. |
get_result
Investigation |
| Get Splunk Action |
Retrieves details of the available Splunk alert actions or adaptive response actions. |
get_command
Investigation |
| Run Splunk Action |
Runs an alert action or an adaptive response action on a search result or a notable. |
run_command
Investigation |
| Update Splunk Notables |
Updates Splunk notables when FortiSOAR™ is updated. |
update_record
Investigation |
| Sync Splunk Users to FortiSOAR |
Synchronizes a Splunk Enterprise Security (ES) user to FortiSOAR™ for co-relation between FortiSOAR™ and Splunk.
Note: Synchronize only those users who are allowed to be assigned to notable events. |
sync_users
Miscellaneous |
| Get List Of Triggered Alerts |
Retrieves a list of alerts that are triggered on Splunk based on the parameters you have specified. |
get_alerts
Investigation |
| Get Details Of Triggered Alert |
Retrieves information of an alert triggered on Splunk based on the name of the alert you have specified. |
get_alert
Investigation |
| Add Comment to Splunk Notables |
Adds a comment to the Splunk notable event ID(s) that are specified by a comma-separated list in case of multiple events. |
update_record
Investigation |
| Get All Collections from Splunk App |
Retrieves a list containing all KVStore collections stored in the context of a specified Splunk App from Splunk, based on the application name and other input parameters you have specified. |
get_all_collections
Investigation |
| Add New Collection to Splunk App |
Adds a new KVStore collection to a specified Splunk App, based on the application name, collection name, and other input parameters you have specified. |
add_new_collection
Investigation |
| Fetch Records from Collection |
Retrieves a list of all records of a specified collection within the specified Splunk App, based on the application name, collection name, and other input parameters you have specified. |
get_records_in_collection
Investigation |
| Add Record to a Collection |
Adds a record to an existing KVStore collection within the specified Splunk App, based on the application name, collection name, record key and value, and other input parameters you have specified. |
add_record_to_collection
Investigation |
| Bulk Add Record to a Collection |
Adds one or more records to an existing KVStore collection within the specified Splunk App, based on the application name, collection name, record key value, and other input parameters you have specified. |
add_record_to_collection
Investigation |
| Delete Record From a Collection |
Removes a record from an existing KVStore collection within the specified Splunk App, based on the application name, collection name, record ID, and other input parameters you have specified. |
delete_record_from_collection
Investigation |
operation: Invoke Search
Input parameters
| Parameter |
Description |
| Search Query |
Query for the search that you want to run on the Splunk server.
Defaults to \"search host=\"{{vars.result.data.host}}\" |
| Application Namespace |
(Optional) Namespace to be used for invoking all of the Splunk APIs.
For more information about namespaces, see Splunk Documentation.
Note: The application namespace that you specify here overrides the configuration application namespace that you have specified on the Connector Configuration page. |
| Earliest Time |
(Optional) Start time for the search. The input type is a string. If this parameter is left empty, it is set to the current time.
For example, -30m or -14d@d. 'm' stands for minutes, 'd' stands for days. Therefore, when you say -30m it means last 30 minutes and -14 days means last 14 days.
For time format see, http://docs.splunk.com/Documentation/Splunk/8.0.7/SearchReference/SearchTimeModifiers. |
| Latest Time |
(Optional) The end time for the search. The input type is a string. If this parameter is left empty, it is set to the current time.
For time format see, http://docs.splunk.com/Documentation/Splunk/8.0.7/SearchReference/SearchTimeModifiers. |
| Execution Mode |
Mode of execution for this operation.
You can choose one of the following options:
Normal: To run an asynchronous search.
Blocking: To return the sid when the job is complete.
One Shot: To return results in the same call.
In this case, you can specify the format for the output (for example, JSON output) using the output_mode parameter as described in GET search/jobs/export. The default format for output is XML. |
| Adhoc Search Level |
Select the search mode that you want to use for this operation. By default, it is set to 'fast'. At present, we exclusively offer support for the smart mode. So, if you want to change the default from 'fast' to 'smart', you can choose the smart option. |
| Timeout |
(Optional) Time, in seconds, of inactivity, after which the search job automatically cancels (0 = Never auto-cancel). |
| Additional Search Arguments |
Additional parameters for the search. You can specify additional parameters, such as time windows, to your search query to get specific search results. For more information, see the Splunk REST API Reference Manual.
Note: To run a search in the verbose mode, add the following parameter: {“adhoc_search_level”:“verbose”}. |
Output
The JSON output contains the data retrieved based on the search query. The search results depend on the additional parameters specified in the search. If the search is run in a blocking or normal mode, the sid is returned. For example, {“sid”: “1496222688.33”}.
The output contains the following populated JSON schema when "Blocking" or "Normal" is chosen as the execution mode:
{
    "sid": ""
}
The output contains the following populated JSON schema when "One Shot" is chosen as the execution mode:
{
    "init_offset": "",
    "messages": [],
    "preview": false,
    "highlighted": {},
    "fields": [],
    "results": []
}
operation: Get Details for a Search
Input parameters
| Parameter |
Description |
| Search ID |
The ID of the Splunk search for which you want to retrieve details.
Defaults to {"value": "{{vars.request.data.sid}}"}". |
| Application Namespace |
(Optional) The namespace to be used for invoking all of the Splunk APIs.
For more information about namespaces, see Splunk Documentation.
Note: The application namespace that you specify here overrides the configuration application namespace that you have specified on the Connector Configuration page. |
Output
The JSON output contains all the details based on the specified search ID.
The output contains the following populated JSON schema:
{
    "links": {},
    "origin": "",
    "updated": "",
    "generator": {},
    "entry": [
        {
            "name": "",
            "id": "",
            "links": {},
            "author": "",
            "content": {},
            "acl": {},
            "updated": "",
            "published": ""
        }
    ],
    "paging": {}
}
operation: Get Events for a Search
Input parameters
| Parameter |
Description |
| Search ID |
The ID of the Splunk search for which you want to retrieve events.
Defaults to {"value": "{{vars.request.data.sid}}"}". |
| Application Namespace |
(Optional) Namespace to be used for invoking all of the Splunk APIs.
For more information about namespaces, see Splunk Documentation.
Note: The application namespace that you specify here overrides the configuration application namespace that you have specified on the Connector Configuration page. |
| Additional Request Parameters |
Optional parameter. You can add other request parameters in the JSON format.
For example, {\"output_mode\": \"json\", \"count\": 10} |
Note: If your search query has additional commands, such as stats, run on the events from the search, the Get Events API returns an empty result if the search is not run in verbose mode. To set the verbose mode, add the following parameter to the Additional Search Arguments parameter in the Invoke Searchoperation: {“adhoc_search_level”:“verbose”}.
Output
The output contains the following populated JSON schema:
{
    "tags": {},
    "fields": [],
    "results": [],
    "init_offset": "",
    "preview": "",
    "messages": [],
    "highlighted": {}
}
operation: Get Results for a Search
Input parameters
| Parameter |
Description |
| Search Id |
The ID of the Splunk search as a JSON. For example, {'value': {{vars.sid}}}.
Note: You must add the Search ID as a JSON with the key value as specified in the example; otherwise, the operation might fail. |
| Application Namespace |
(Optional) The namespace to be used for invoking all of the Splunk APIs.
For more information about namespaces, see Splunk Documentation
Note: The application namespace that you specify here overrides the configuration application namespace that you have specified on the Connector Configuration page. |
| Additional Request Parameters |
(Optional) You can add other request parameters in the JSON format.
For example, {\"output_mode\": \"json\", \"count\": 10} |
Output
The JSON output contains the transformed results for the specified Splunk search in a search result.
The output contains the following populated JSON schema:
{
    "preview": "",
    "init_offset": "",
    "messages": [],
    "fields": [],
    "results": [],
    "tags": {},
    "highlighted": {}
}
operation: Get Splunk Action
Input parameters
| Parameter |
Description |
| Action Name |
Name of the action for which the details are to be fetched. A match for this name is looked for in the action name, description, and label in a Splunk action. This is an optional parameter, and if you do not specify the same, then this operation fetches a list of all Splunk actions. |
Output
The JSON output contains input parameters and other details for all alert actions that match the action name you have specified.
The output contains the following populated JSON schema:
[
    {
        "id": "",
        "acl": {},
        "name": "",
        "links": {},
        "author": "",
        "content": {},
        "updated": ""
    }
]
operation: Run Splunk Action
Input parameters
| Parameter |
Description |
| Notable Event Id |
The ID of the notable event on which you want to run the action. |
| Search Id |
The ID of the Splunk search on which you want to run the action.
You must specify either the Notable Event Id or the Search Id. |
| Action Name |
The name of the action to be run. |
| Action Parameters |
Parameters of the action that you want to run. For example, a parameter in the JSON format would be {\"max_results\":\"1\"}
Note: You can use the Get Splunk Action operation to get parameter names for a specific action. |
| Frequency |
If you are running the operation on search results, this parameter specifies if the action should be run only once for the entire resultset or for each result. |
Output
This operation executes the action with the help of the sendaction command from Splunk. The JSON output contains the events from the execution of the sendalert command and varies for each command. The following image displays the output of the execution of the SplunkES Risk Analysis AR action on a notable event:
The output contains a non-dictionary value.
operation: Update Splunk Notables
Input parameters
Note. Include this operation in a Splunk playbook and notables will get updated on Splunk when they are updated on FortiSOAR™.
| Parameter |
Description |
| Notable Event ID |
The ID of the notable event that you want to update on Splunk. |
| Status |
The status of the Splunk notable to be updated in Splunk.
You can specify any of the following values: Unassigned, New, In Progress, Pending, Resolved, or Closed. |
| Urgency |
The urgency of the Splunk notable to be updated in Splunk.
You can specify any of the following values: Info, Low, Medium, High, or Critical. |
| Owner |
Owner of the Splunk notable event. Use \"unassigned\" to remove an event owner. |
Output
The JSON output returns a status containing "success" if the Splunk notables are updated, or "failure" with the reason for failure if the Splunk notables are not updated.
The output contains the following populated JSON schema:
{
    "result": "",
    "status": ""
}
operation: Sync Splunk Users to FortiSOAR
Input parameters
None. Include this operation in a Splunk playbook and users will get updated on Splunk when they are updated in FortiSOAR™.
Output
The JSON output returns a Success message if the Splunk users are synchronized, or an Error message containing the reason for failure. The output also contains the names of the users.
The output contains a non-dictionary value.
operation: Get List Of Triggered Alerts
Input parameters
| Parameter |
Description |
| Max Number Of Entries To Return |
The maximum number of triggered alerts that you want the operation to return. Set the value to -1 if you want to retrieve all the triggered alerts. |
| Offset |
Index of the first item to return. |
| Response Filter |
Filter used to specify which triggered alerts must be returned. The values of the response fields are matched against this search expression.
Examples:
search=foo matches any field that has the string foo in its name.
search=field_name%3Dfield_value restricts the match to a single field. (Requires URI-encoding.) |
| Sort By |
Sorting order of the result, choose between asc (ascending) or desc (descending). |
| Field Name To Use For Sorting |
Name of the field on which you want to sort the result. |
| Sort Mode |
Logical sequencing (collate) of the results. Choose between the following:
auto: If all field values are numeric, collate numerically. Otherwise, collate alphabetically.
alpha = Collate field values alphabetically, not case-sensitive.
alpha_case = Collate field values alphabetically, case-sensitive.
num = Collate field values numerically. |
Output
The JSON output contains a list of alerts and other details for all alerts triggered on Splunk based on the parameters you have specified.
The output contains the following populated JSON schema:
{
    "messages": [],
    "entry": [
        {
            "name": "",
            "content": {
                "triggered_alert_count": "",
                "eai:acl": ""
            },
            "updated": "",
            "acl": {
                "can_write": "",
                "owner": "",
                "modifiable": "",
                "sharing": "",
                "can_list": "",
                "perms": {
                    "read": [],
                    "write": []
                },
                "removable": "",
                "app": ""
            },
            "id": "",
            "author": "",
            "links": {
                "alternate": "",
                "list": ""
            }
        }
    ],
    "generator": {
        "build": "",
        "version": ""
    },
    "updated": "",
    "paging": {
        "offset": "",
        "total": "",
        "perPage": ""
    },
    "origin": "",
    "links": {
        "_acl": ""
    }
}
operation: Get Details Of Triggered Alert
Input parameters
| Parameter |
Description |
| Alert Name |
Name of the triggered alert for which the details are to be fetched. |
Output
The JSON output contains details for the triggered alert that match the alert name you have specified.
The output contains the following populated JSON schema:
{
    "links": {
        "_acl": ""
    },
    "generator": {
        "version": "",
        "build": ""
    },
    "paging": {
        "total": "",
        "perPage": "",
        "offset": ""
    },
    "origin": "",
    "messages": [],
    "entry": [
        {
            "author": "",
            "links": {
                "remove": "",
                "list": "",
                "alternate": "",
                "savedsearch": "",
                "job": ""
            },
            "acl": {
                "can_write": "",
                "owner": "",
                "perms": {
                    "read": [],
                    "write": []
                },
                "app": "",
                "modifiable": "",
                "sharing": "",
                "removable": "",
                "can_list": ""
            },
            "id": "",
            "name": "",
            "published": "",
            "content": {
                "triggered_alerts": "",
                "severity": "",
                "expiration_time_rendered": "",
                "alert_type": "",
                "eai:acl": "",
                "trigger_time": "",
                "savedsearch_name": "",
                "sid": "",
                "digest_mode": "",
                "trigger_time_rendered": "",
                "actions": ""
            },
            "updated": ""
        }
    ],
    "updated": ""
}
operation: Add Comment to Splunk Notables
Input parameters
| Parameter |
Description |
| Notable Event Ids |
ID(s) of the notable event(s) in which you want to add comments.
Use a comma-separated list of IDs in case of multiple events. |
| Comment |
The comment that you want to add to the Splunk notable event(s). |
Output
The JSON output returns a Success message if the Splunk notable event(s) are updated, or an Errormessage containing the reason for failure.
The output contains the following populated JSON schema:
{
    "details": {},
    "message": "",
    "success": "",
    "warnings": [],
    "failure_count": "",
    "success_count": ""
}
operation: Get All Collections from Splunk App
Input parameters
| Parameter |
Description |
| Owner |
(Optional) Name of the user who owns the collection in the Splunk app that you have specified whose complete collection list you want to retrieve from Splunk. |
| App Name |
Name of the app that the collection is part of whose complete collection list you want to retrieve from Splunk. |
Output
The output contains the following populated JSON schema:
The output contains the following populated JSON schema:
{
    "entry": [
        {
            "id": "",
            "acl": {
                "app": "",
                "owner": "",
                "perms": {
                    "read": [],
                    "write": []
                },
                "sharing": "",
                "can_list": "",
                "can_write": "",
                "removable": "",
                "modifiable": "",
                "can_share_app": "",
                "can_share_user": "",
                "can_change_perms": "",
                "can_share_global": ""
            },
            "name": "",
            "links": {
                "edit": "",
                "list": "",
                "remove": "",
                "_reload": "",
                "disable": "",
                "alternate": ""
            },
            "author": "",
            "content": {
                "type": "",
                "eai:acl": "",
                "disabled": "",
                "replicate": "",
                "field.data": "",
                "field.user": "",
                "eai:appName": "",
                "field._time": "",
                "eai:userName": "",
                "profilingEnabled": "",
                "field.splunk_server": "",
                "profilingThresholdMs": "",
                "replication_dump_strategy": "",
                "accelerated_fields.default": "",
                "replication_dump_maximum_file_size": ""
            },
            "updated": ""
        }
    ],
    "links": {
        "_acl": "",
        "create": "",
        "_reload": ""
    },
    "origin": "",
    "paging": {
        "total": "",
        "offset": "",
        "perPage": ""
    },
    "updated": "",
    "messages": [],
    "generator": {
        "build": "",
        "version": ""
    }
}
operation: Add New Collection to Splunk App
Input parameters
| Parameter |
Description |
| Owner |
(Optional) Name of the user who owns the collection in the Splunk app in which you want to add a new collection. |
| App Name |
Name of the app to which you want to add the new collection. |
| Collection Name |
Name of the new collection that you want to add to the Splunk app. |
Output
The output contains the following populated JSON schema:
{
    "entry": [
        {
            "id": "",
            "acl": {
                "app": "",
                "owner": "",
                "perms": {
                    "read": [],
                    "write": []
                },
                "sharing": "",
                "can_list": "",
                "can_write": "",
                "removable": "",
                "modifiable": "",
                "can_share_app": "",
                "can_share_user": "",
                "can_change_perms": "",
                "can_share_global": ""
            },
            "name": "",
            "links": {
                "edit": "",
                "list": "",
                "remove": "",
                "_reload": "",
                "disable": "",
                "alternate": ""
            },
            "author": "",
            "content": {
                "type": "",
                "eai:acl": "",
                "disabled": "",
                "replicate": "",
                "eai:appName": "",
                "eai:userName": "",
                "profilingEnabled": "",
                "profilingThresholdMs": "",
                "replication_dump_strategy": "",
                "replication_dump_maximum_file_size": ""
            },
            "updated": ""
        }
    ],
    "links": {
        "_acl": "",
        "create": "",
        "_reload": ""
    },
    "origin": "",
    "paging": {
        "total": "",
        "offset": "",
        "perPage": ""
    },
    "updated": "",
    "messages": [],
    "generator": {
        "build": "",
        "version": ""
    }
}
operation: Fetch Records from Collection
Input parameters
| Parameter |
Description |
| Owner |
(Optional) Name of the user who owns the collection in the Splunk app whose records you want to retrieve from Splunk. |
| App Name |
Name of the app that the collection is part of whose records you want to retrieve from Splunk. |
| Collection Name |
Name of the collection whose records you want to retrieve from Splunk. |
Output
The output contains the following populated JSON schema:
{
    "name": "",
    "_key": "",
    "_user": ""
}
operation: Add Record to a Collection
Input parameters
| Parameter |
Description |
| Owner |
(Optional) Name of the user who owns the collection in the Splunk app in which you want to add records. |
| App Name |
Name of the Splunk app that the collection is part of in which you want to add records. |
| Collection Name |
Name of the collection to which you want to add records. |
| Record Key |
Key of the record that you want to add to the specified collection. |
| Record Value |
Value of the record that you want to add to the specified collection. |
Output
The output contains the following populated JSON schema:
{
    "_key": ""
}
operation: Bulk Add Record to a Collection
Input parameters
| Parameter |
Description |
| Owner |
(Optional) Name of the user who owns the collection in the Splunk app in which you want to add records. |
| App Name |
Name of the Splunk app that the collection is part of in which you want to add records. |
| Collection Name |
Name of the collection to which you want to add records. |
| Record Key Value |
List of keys and their associate values of the records that you want to add to the specified collection. For example, [{"name": "Splunk Sweden"}, {"name": "Splunk Singapore"}] |
Output
No output schema is available at this time.
operation: Delete Record From a Collection
Input parameters
| Parameter |
Description |
| Owner |
(Optional) Name of the user who owns the collection in the Splunk app from which you want to delete records. |
| App Name |
Name of the Splunk app that the collection is part of from which you want to delete records. |
| Collection Name |
Name of the collection from which you want to delete records. |
| Record ID |
The ID of the record that you want to delete from the specified collection. |
Output
The output contains the following populated JSON schema:
{
    "success": ""
}
Included playbooks
The Sample - Splunk - 2.0.0 playbook collection comes bundled with the Splunk connector. This playbook contains steps using which you can perform all supported actions. You can see the bundled playbooks in the Automation > Playbooks section in FortiSOAR™ after importing the Splunk connector.
- Splunk > Add New Collection to Splunk App
- Splunk > Add Record to a Collection
- Splunk > Alert Action
- Splunk > Alert Post-Update
- Splunk > Alert Update
- Splunk > Bulk Add Record to a Collection
- Splunk > Delete Record From a Collection
- > Splunk > Fetch
- > Splunk > Fetch Events
- Splunk > Fetch Records from Collection
- Splunk > Get All Collections from Splunk App
- Splunk > Get List of Triggered Alerts
- Splunk > Inbound Alert
- Splunk > Inbound Incident
- Splunk > Incident Post-Update
- Splunk > Incident Update
- Splunk > Ingest
- Splunk > Search Actions
- Splunk > Sync Splunk Users to FortiSOAR
- Splunk > Triggered Alerts Actions
- Splunk > Update Notable Fields
The Splunk > Get List of Triggered Alerts playbook is used for Adaptive Response FortiSOAR: Run Playbook action.
The sample playbooks from 2 to 8 work in conjunction with the TA-fortinet-fortisoar-x.x.x.tar.gz to invoke FortiSOAR actions from the Splunk UI and also to automatically forward Splunk alerts and notables as FortiSOAR Alerts and Incidents. For more information, see Splunk Add-on documentation.
Note: If you are planning to use any of the sample playbooks in your environment, ensure that you clone those playbooks and move them to a different collection since the sample playbook collection gets deleted during the connector upgrade and delete.
Data Ingestion Support
Use the Data Ingestion Wizard to easily ingest data into FortiSOAR™ by pulling events from Splunk. Currently, "events" in Splunk are mapped to "alerts" in FortiSOAR™. For more information on the Data Ingestion Wizard, see the "Connectors Guide" in the FortiSOAR™ product documentation. Before you begin ingesting data from Splunk, review the points listed in the Data Ingestion Notes section.
Configure Data Ingestion
You can configure data ingestion using the “Data Ingestion Wizard” to seamlessly map the incoming Splunk "Events" to FortiSOAR™ "Alerts".
The Data Ingestion Wizard enables you to configure the scheduled pulling of data from Splunk into FortiSOAR. It also lets you pull some sample data from Splunk using which you can define the mapping of data between Splunk and FortiSOAR. The mapping of common fields is generally already done by the Data Ingestion Wizard; users are mostly required to only map any custom fields that are added to the Splunk event
- To begin configuring data ingestion, click Configure Data Ingestion on the Splunk connector’s "Configurations" page.
Click Let’s Start by fetching some data, to open the “Fetch Sample Data” screen.
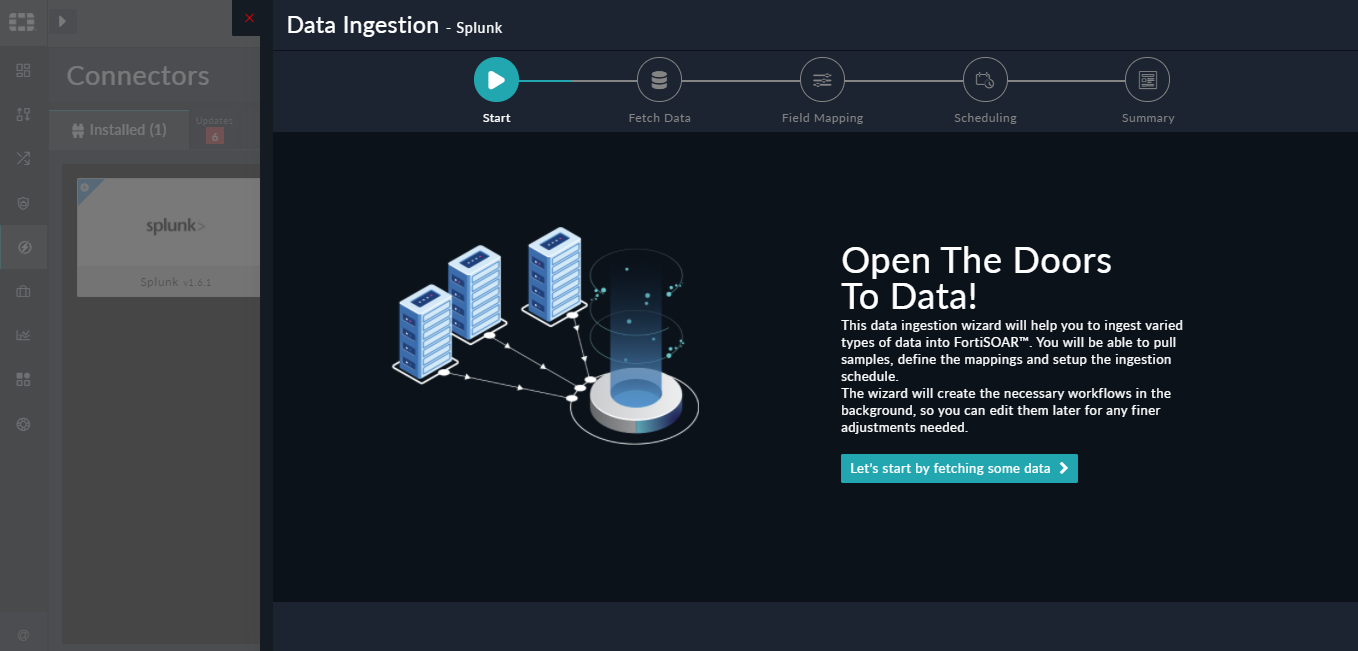
Sample data is required to create a field mapping between Splunk data and FortiSOAR™. The sample data is pulled from connector actions or ingestion playbooks.
- On the Fetch Data screen, provide the configurations required to fetch Splunk data.
Users can choose to pull data from Splunk by specifying a 'search query' based on which events should be pulled from Splunk. You can also specify additional parameters such as the time range or bound of the search by specifying the tart (earliest) time and the end (latest) time for the search and the mode of execution for the search; choices being One Shot, Blocking, or Normal, based on which you want to pull events from Splunk. You can also optionally define the maximum number of events you want to pull from Splunk in the 'Maximum Events To Pull' field; you can specify '0' to pull all events. If you choose 'Blocking' or 'Normal' from the 'Execution Mode' drop-down list, then you will see an additional field, the 'Events Per Page' field, where you can define the number of events that you want to include per page.
Also, if you choose the 'Blocking' mode, then you will see the 'Adhoc Search Level', which is by default set to 'smart' so that users can access all event keys.
The fetched data is used to create a mapping between the Splunk data and FortiSOAR™ alerts.
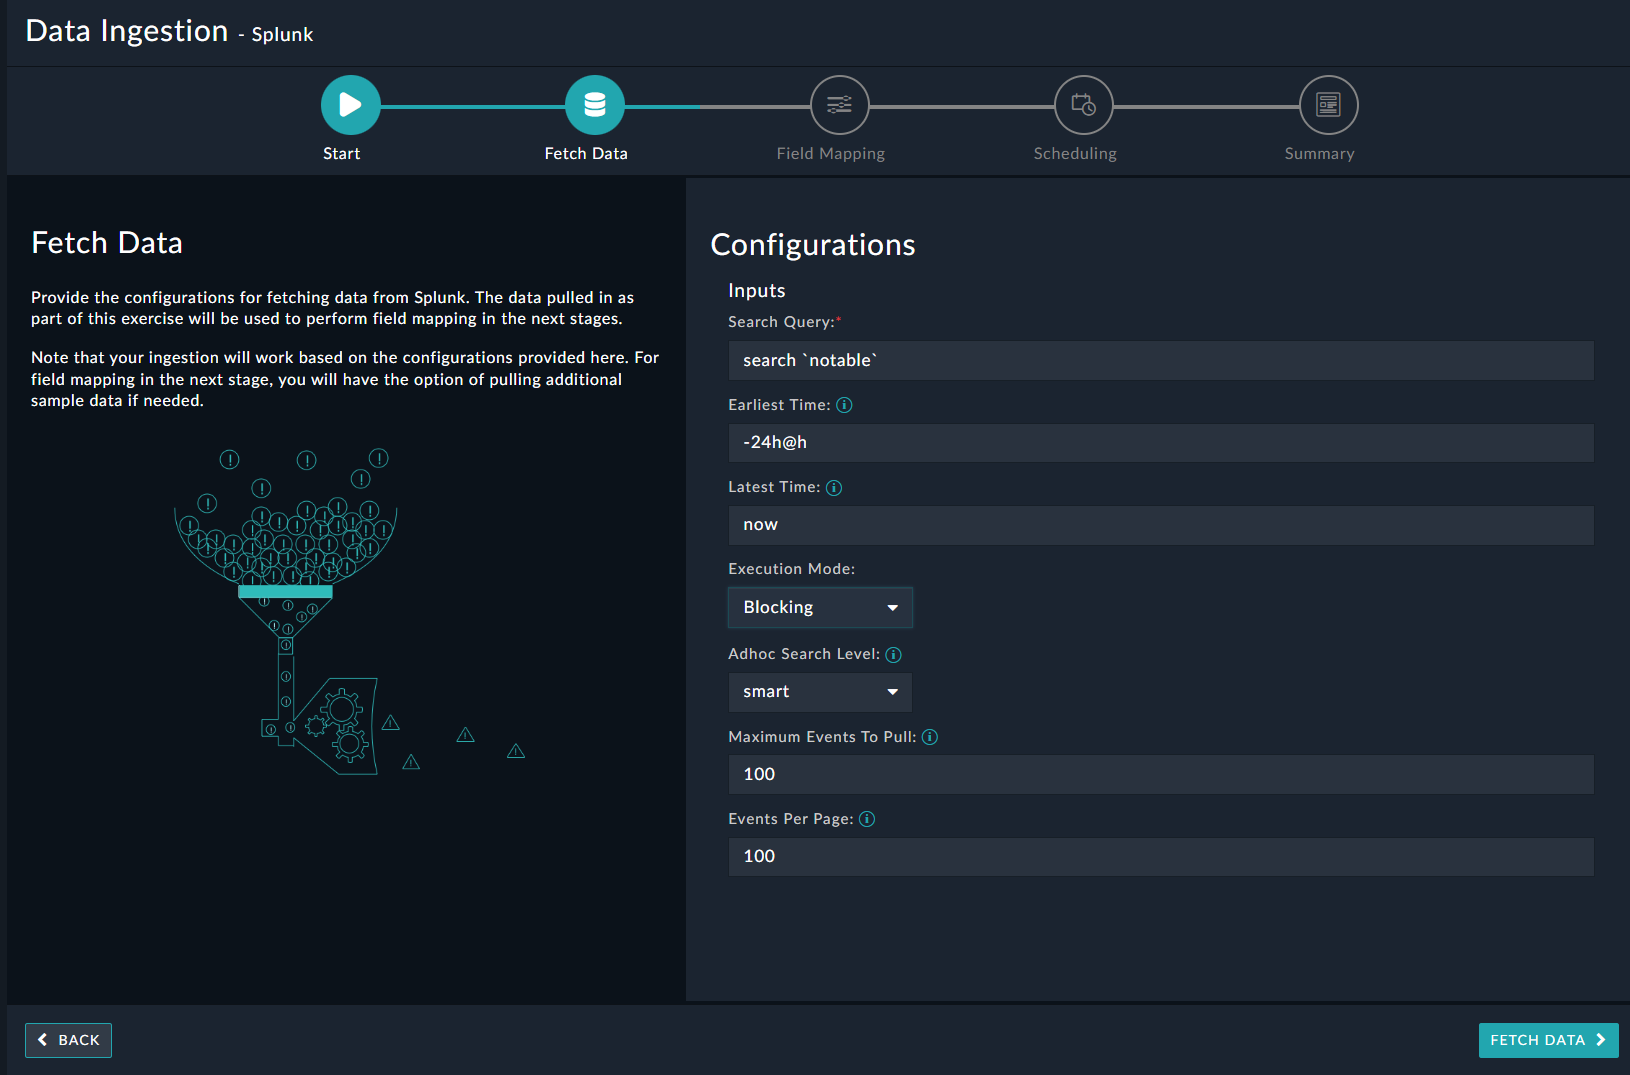
Once you have completed specifying the configurations, click Fetch Data.
-
On the Field Mapping screen, map the fields of a Splunk event to the fields of an alert present in FortiSOAR™.
To map a field, click the key in the sample data to add the “jinja” value of the field. For example, to map the _time parameter of a Splunk event to the Event Time parameter of a FortiSOAR™ alert, click the Event Time field and then click the _time field to populate its keys:
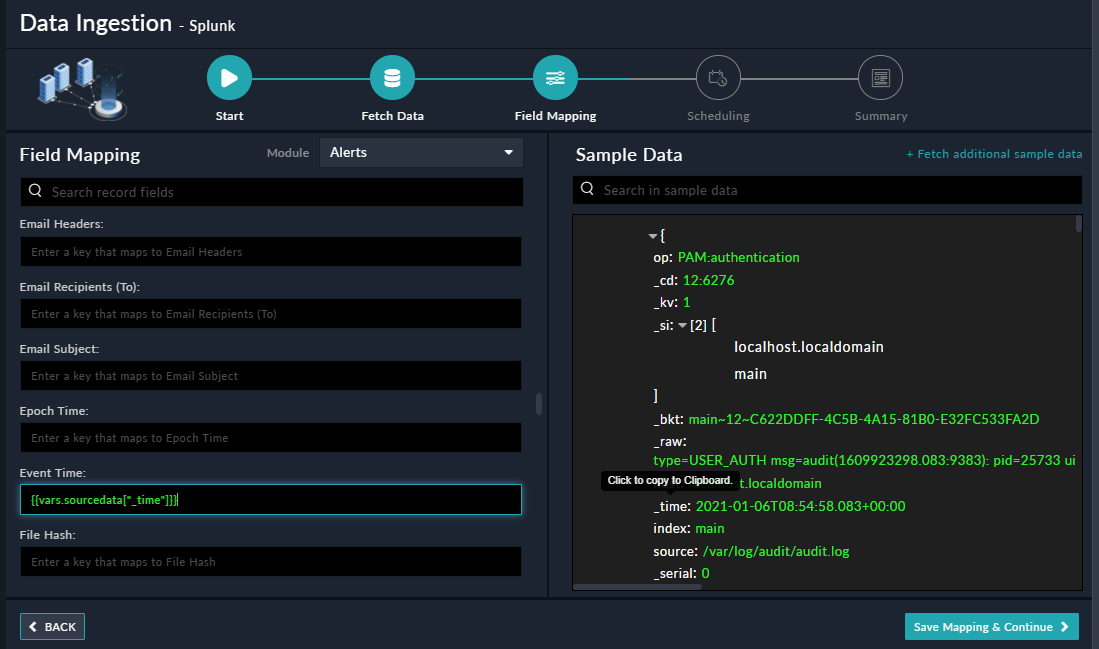
For more information on field mapping, see the Data Ingestionchapter in the "Connectors Guide" in the FortiSOAR™ product documentation. Once you have completed the mapping of fields, click Save Mapping & Continue.
-
(Optional) Use the Scheduling screen to configure schedule-based ingestion, i.e., specify the polling frequency to Splunk, so that the content gets pulled from the Splunk integration into FortiSOAR™.
On the Scheduling screen, from the Do you want to schedule the ingestion? drop-down list, select Yes.
In the “Configure Schedule Settings” section, specify the Cron expression for the schedule. For example, if you want to pull data from Splunk every morning at 5 am, click Daily, and in the hour box enter 5 , and in the minute box enter 0:
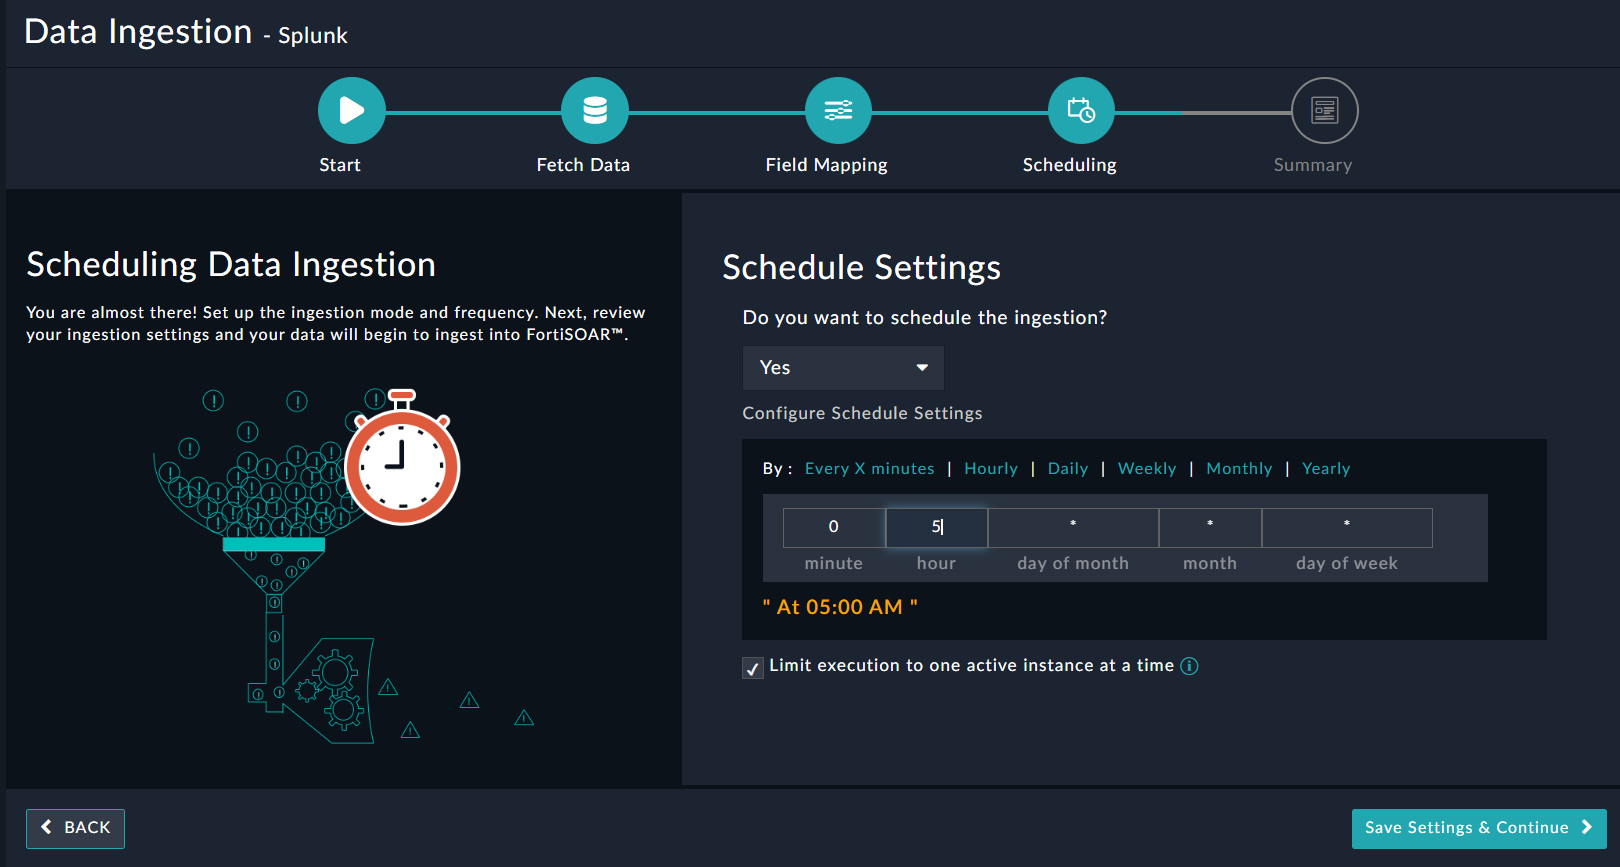
Once you have completed scheduling, click Save Settings & Continue.
-
The Summary screen displays a summary of the mapping done, and it also contains links to the Ingestion playbooks. Click Done to complete the data ingestion and exit the Data Ingestion Wizard.
Data Ingestion Notes
- In the Data Ingestion Wizard > Fetch Data screen, if you choose Blocking or Normal from the 'Execution Mode' drop-down list as the mode of execution for the search using which you want to pull events from Splunk, then you must ensure that the ratio of the number of events pulled specified in the 'Maximum Events To Pull' field and the number of events to be included per page specified in the 'Events Per Page' should be balanced otherwise the
search id expires.
- The 'Parallel async' mode is enabled for the record creation playbook (> Splunk > Fetch Events), leading to your other playbooks remaining in the queue until the completion of this playbook. This could cause a long queue in your FortiSOAR system, which will be cleared only after the completion of the > Splunk > Fetch Events playbook.
Known Issues and Workarounds
Following are some known issues and their workarounds for version 1.6.1 of the Splunk connector. These issues are also applicable to users who do not upgrade to version 1.6.3 or later of the Splunk connector but use the 2.7.0 Fortinet FortiSOAR Splunk Add-on. For more information, see Splunk Add-on documentation.
Error in the "Update Splunk Notable" action
An error such as "Error message : 'data' Connector :: splunkV1.6.1" while using the "Update Splunk Notable" action is due to a compatibility issue with FortiSOAR 7.0.0.
Resolution
To solve this issue, upgrade the Splunk connector to the latest version.
Error while running the "Incident Update" playbook
You see the following error while running the Splunk > Incident Update:
Error message : CS-WF-35: Record IRI is empty. Please check the input given for record iri or module field.
Resolution
In the "Splunk > Incident Update" playbook, update Condition 1 of the Is Incident Updated step with the following condition:
vars.event_owner == vars.incident_owner and vars.event_urgency == vars.incident_urgency and vars.event_status == vars.incident_status or vars.steps.Get_Splunk_Incidents | length < 1
Update Notable Fields reference playbook fails to get called for notable events.
The "Splunk > Inbound Incident" playbook fails to call the "Splunk > Update Notable Fields" reference playbook for notable events.
Resolution
Update the "Splunk > Inbound Incident" playbook as follows:
In the "Start" step add a new "sourcedata" variable with the following jinja value:
{%if 'data' in vars.request %}{%set _dummy = vars.request.data.update({'uri': vars.request.uri})%}{%if 'result' in vars.request.data %}{%for k,v in vars.request.data.result.items()%}{%set _dummy= vars.request.data.update({k:v})%}{%endfor%}

{%set _dummy= vars.request.data.pop('result') %}{%endif%}

{{vars.request.data}}{%else%}{%set _dummy = vars.request_data.update( { "route": vars.route})%}{{vars.request_data}{%endif%}
Pull all events when the alert action trigger mode is set as Once
The Splunk > Inbound Alert and Splunk > Inbound Incident playbooks fetch only the latest event when the alert action trigger mode is set as Once.
Resolution
Update the Splunk > Inbound Alert and Splunk > Inbound Incident playbooks as follows:
In the Configuration step, change the value of parameter pull_all_events to true.


