


MITRE ATT&CK®
MITRE (MIT Research Establishment) ATT&CK (Adversarial Tactics, Techniques, and Common Knowledge) is a framework for handling cyber threats. This framework consists of tactics and techniques organized into matrices. With the appropriate license, you can leverage these matrices in the FortiAnalyzer GUI:
-
Events & Incidents > MITRE ATT&CK®
-
Events & Incidents > MITRE ATT&CK® ICS
The column headers in the MITRE ATT&CK matrices are tactics, and the tiles within these columns are the relevant techniques.
FortiAnalyzer associates incident and event information with the relevant tactics and techniques. FortiAnalyzer also displays coverage in the MITRE ATT&CK matrices, so you can determine which event handlers help to cover specific tactics and techniques.
|
|
The MITRE Domain and MITRE Tech ID fields in event handlers are used to associate the handlers and their resulting events to the correct tactic and technique. For more information about configuring event handlers, see Creating a custom event handler and Creating a custom correlation handler. |
This topic explains the two tabs available in the MITRE ATT&CK® panes:
The examples displayed below are for the MITRE ATT&CK® pane, but the same functionality exists for the MITRE ATT&CK® ICS pane.
The OT Security Service is required for FortiAnalyzer to use all functionality in the MITRE ATT&CK® ICS pane. For more information about this service, see the FortiAnalyzer Datasheet.
Attack
You can review incident and event information organized within the MITRE ATT&CK matrices from the Attack tab. You can filter the matrices using the timeframe dropdown, and you can refresh the matrices as needed.
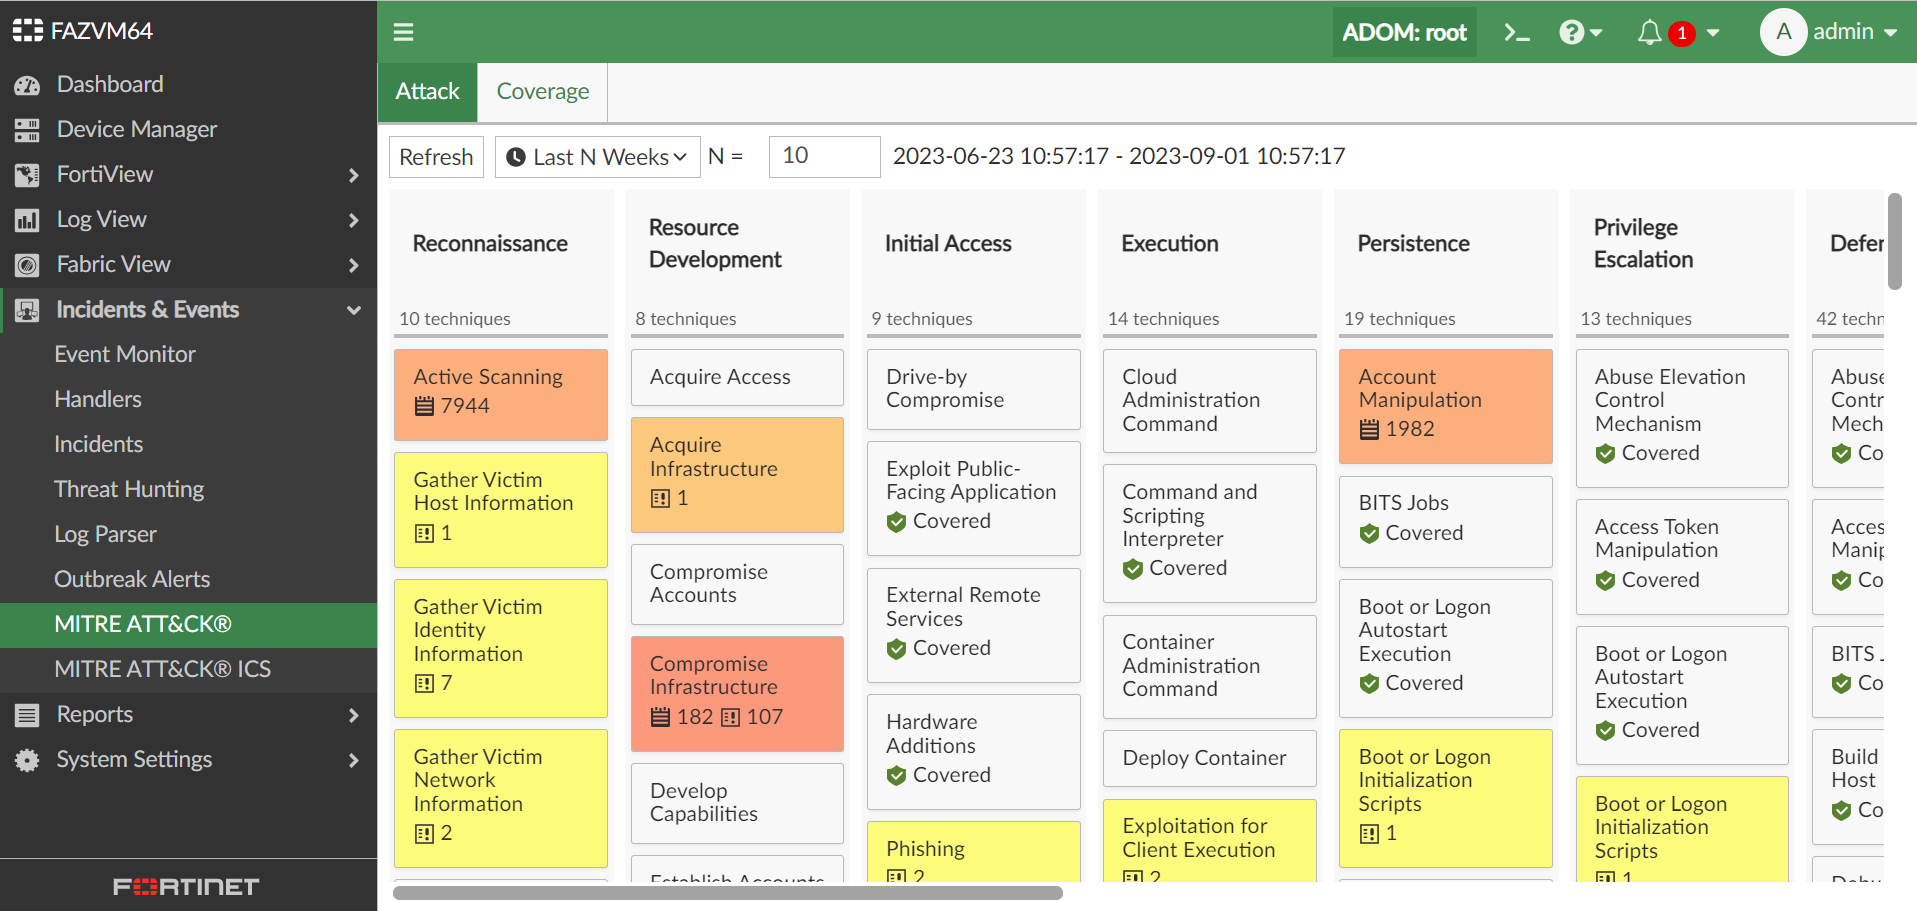
If there are events associated with the technique, an icon and count displays on the tile. A separate icon and count displays for the associated incidents as well. Mouse over the tile to display the information in a tooltip. If there are sub-techniques, the tooltip breaks down which sub-technique the events and incidents are associated with.
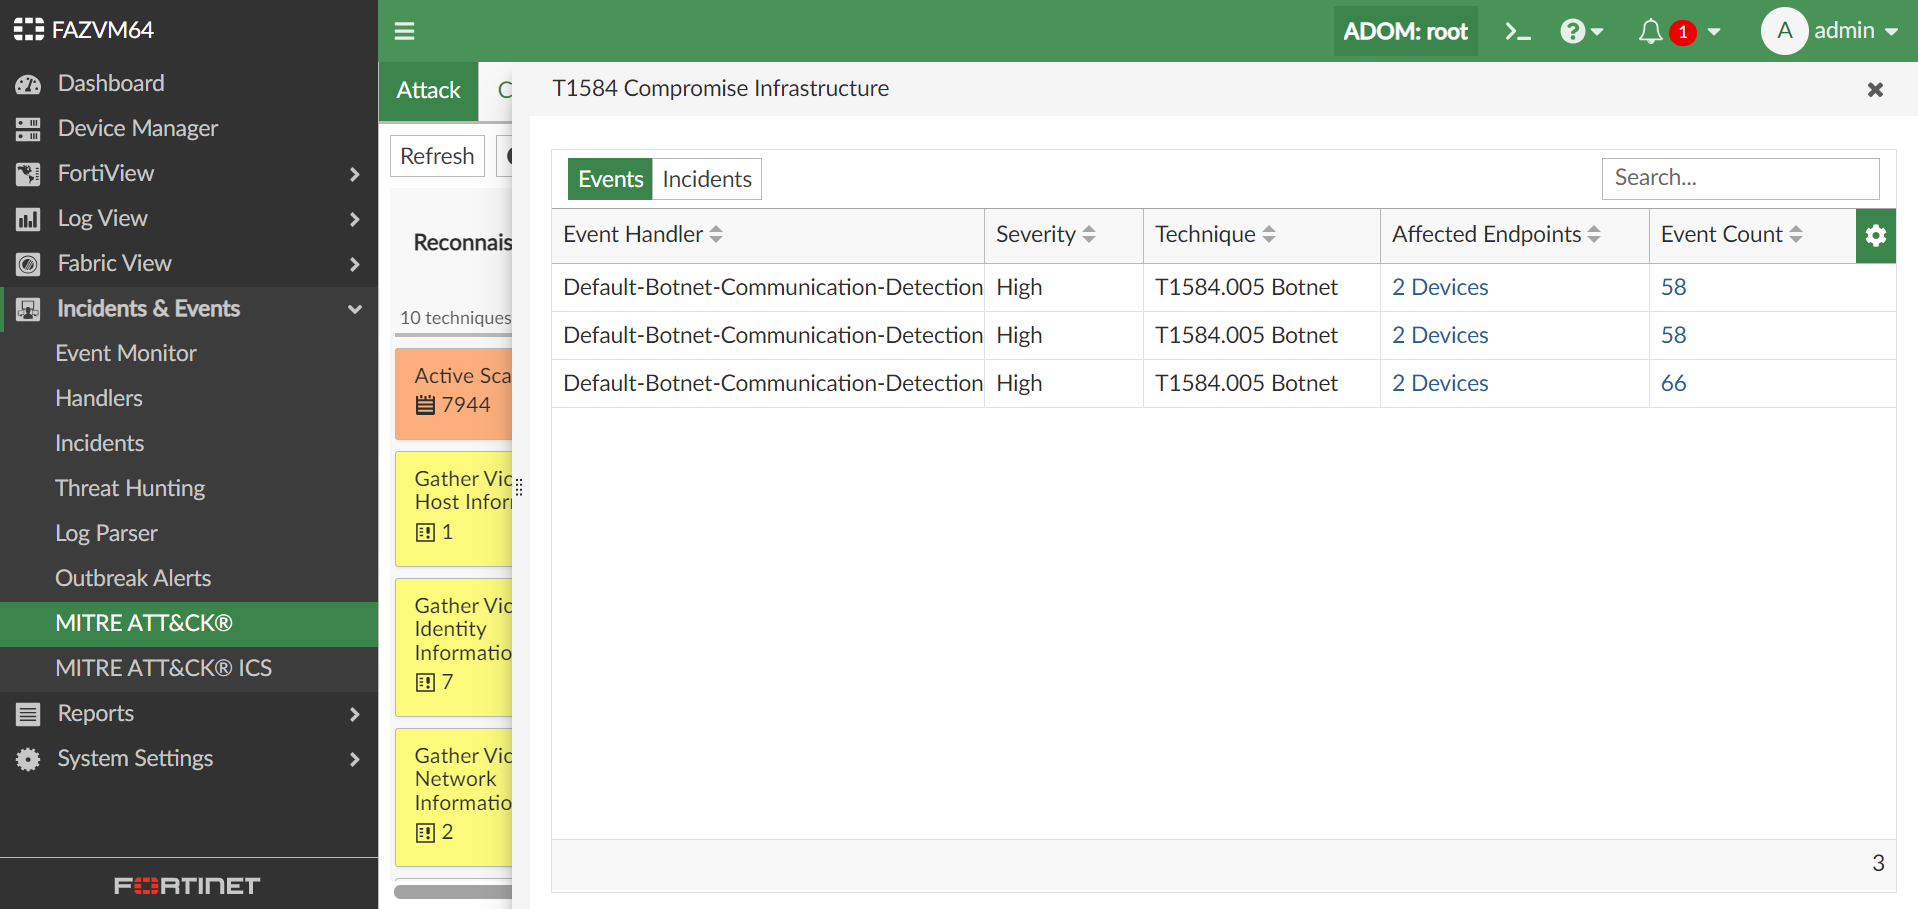
Click a tile with associated events or incidents to open a pane for that technique. In this pane, you can toggle between table views for Events and Incidents.
The table view for Events includes the following information:
|
Column |
Description |
|---|---|
| Event Handler | The event handler that generated the event(s). |
| Severity | The severity of the event(s). |
| Technique | The technique or sub-technique related to the event(s). |
|
Affected Endpoints |
The number of affected devices. Click the count for affected endpoints to open another pane with the list of endpoints found in the events. |
|
Event Count |
The event count related to that event handler and technique or sub-technique. Click the event count to open the Event Monitor in a new tab. It is filtered by the selected handler and time range from the matrix. For more information, see Event Monitor. |
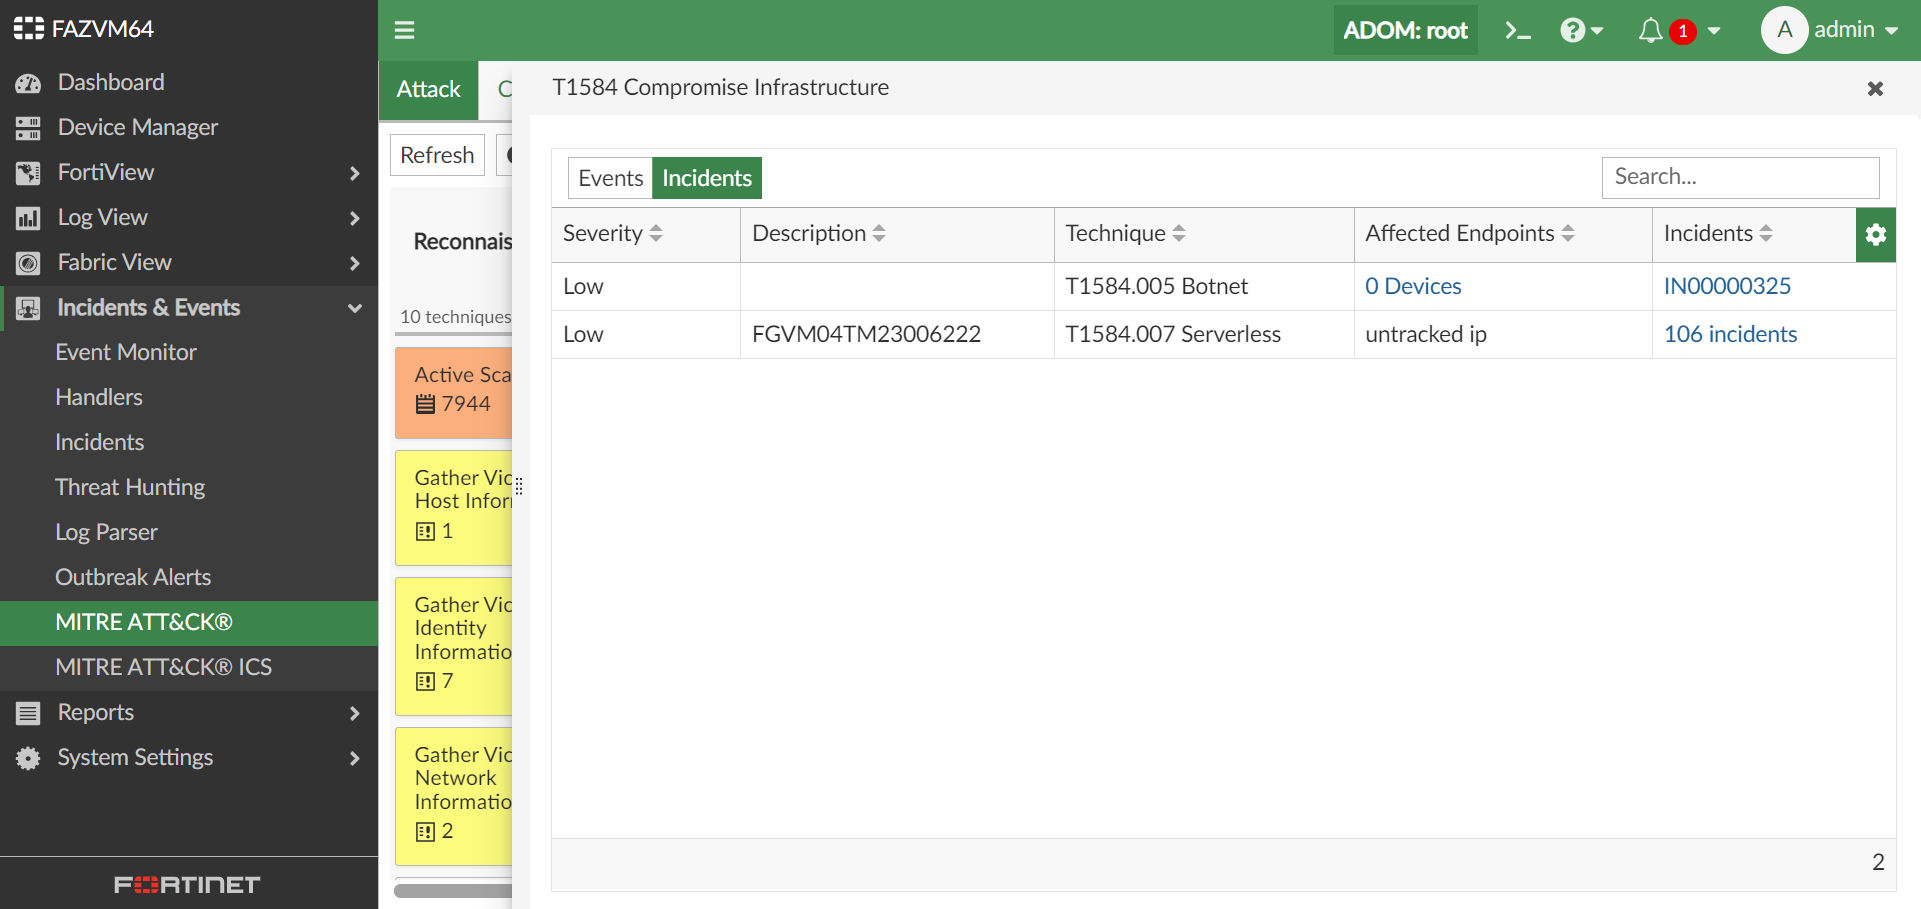
The table view for Incidents includes following information:
|
Column |
Description |
|---|---|
| Severity | The severity of the incident(s). |
| Description | The description for the incident. |
| Technique | The technique or sub-technique related to the incident(s). |
|
Affected Endpoints |
The number of affected endpoints. Click the count for affected endpoints to open another pane with the list of endpoints found in the incidents. |
|
Incidents |
The incident count related to that technique or sub-technique. Click the incident count to open the Incidents pane in a new tab. It is filtered by incidents of the selected technique. For more information, see Incidents. |
If there are no events or incidents associated with a technique but it has at least one event handler, a covered icon displays on the tile. Mouse over the tile to display the number of event handlers and the list of sub-techniques in a tooltip. To review the coverage in more detail, go to the Coverage tab. See Coverage.
If there are no events, incidents, or event handlers associated with a technique, the tile will not display any icons and the mouse-over tooltip will not be available.
Coverage
You can review event handler coverage according to the MITRE ATT&CK matrices from the Coverage tab. You can refresh the matrices as needed.

When a basic or correlation event handler is associated with a technique, it will be included as part of the coverage for that technique. The tile displays an icon and count for associated event handlers. Mouse over the tile to display the information in a tooltip. This includes the total event handler count and a breakdown of the count for each sub-technique, if they are available.
|
|
One event handler can be associated to multiple techniques and sub-techniques. |
Click a tile with coverage to open a table view of event handlers for that technique. The table includes the following information:
|
Column |
Description |
|---|---|
| State |
The state of the event handler: Enabled or Disabled. |
| Event Handlers |
The name of the event handler. Click the name to view the event handler configuration. You can edit the Status, MITRE Domain, and MITRE Tech ID from this pane, if needed. After updating the coverage for an event handler, refresh the MITRE ATT&CK® matrix to display the changes. |
| Description | The description of the event handler. |
|
Technique |
The technique or sub-technique(s) associated with the event handler. If there are multiple sub-techniques associated with the event handler, the count will be provided in this column. Click the count to display which sub-techniques are associated with the event handler. |

If there are no event handlers associated with a technique, Enabled or Disabled, the tile will not display any icons and the mouse-over tooltip will not be available.