
Overview
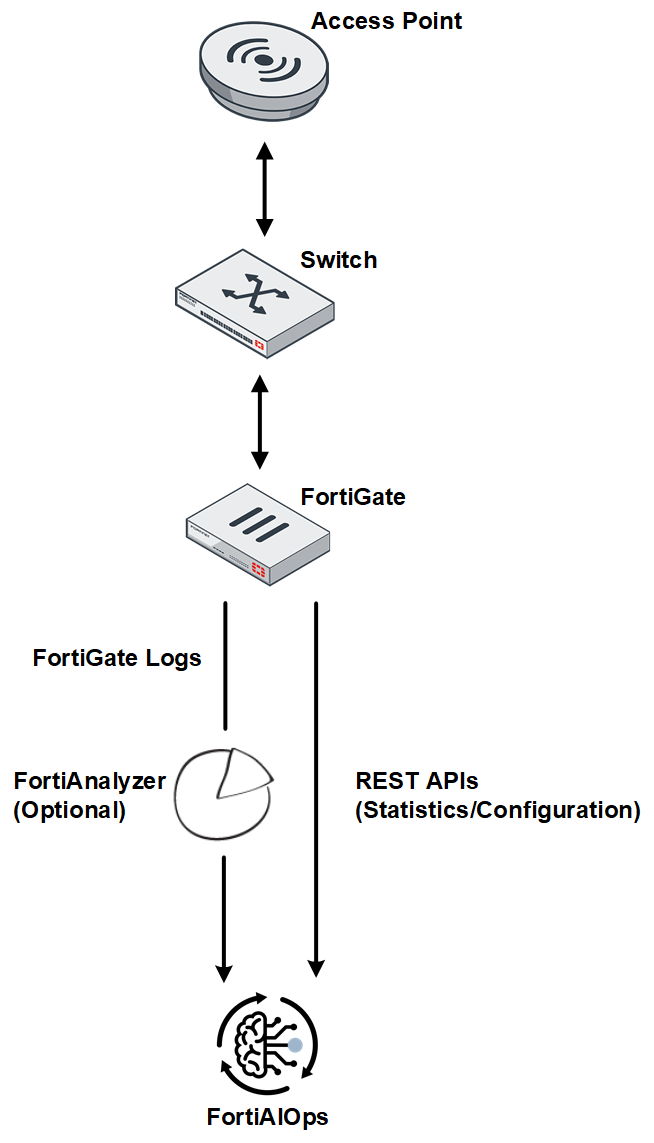
FortiAIOps enables you to proactively monitor the health of your entire wireless, wired, and SD-WAN network, and provides insights into key health statistics, based on the Artificial Intelligence (AI) and Machine Learning (ML) architecture that it is built upon. FortiAIOps ingests data for analysis and automated event correlation to precisely detect anomalies that impact the clients’ network experience. It learns from numerous sources such as FortiGates, FortiAPs, FortiSwitches, and FortiExtenders to report statistics on a series of comprehensive and simple dashboards, providing visibility and deep insight into your network. This predictable network infrastructure enables you to swiftly identify the root cause with the highest probability of association to actual issues, and its resolution.
FortiAIOps is based upon a deployment-specific and adaptive learning AI/ML model, that automatically adjusts whenever there are changes in the Radio Frequency (RF) environment. This is an enhancement from the static AI/ML model of the previous releases. The system runs a weekly (on each Saturday) analysis, to detect any RF changes based on the past week's collected data, and assess if accuracy improvements are possible. If improvements are identified, the AI/ML model is updated to better align with your RF environment. All AI/ML model changes are notified via a local log event message.
FortiAIOps monitors integrated wireless, wired, and SD-WAN networks by supporting the monitoring of FortiGate controllers. You can monitor and manage FortiGate controllers concurrently associated with FortiAPs and stations in a large deployments. The centralized real-time data and event logs offered by FortiAIOps, aim at diagnosing and troubleshooting network issues by analyzing potential problems and suggesting remedial steps.
The FortiAIOps application provides the following advantages.
- Maximizes the uptime of your organization's network infrastructure.
- Reduces the time taken to diagnose network issues, thereby the mean response time.
- Increases the productivity of network users and that of your organization.
FortiAIOps calculates the SLA thresholds/baselines dynamically using the AI-ML architecture, to enable you to diagnose network issues based on accurate and latest data trends. The algorithms identify the values for each environment by clustering clients based on the connection quality using specific parameters. The thresholds are then derived based on the calculated average of the client connection data, to report variations in your network. These AI driven algorithms are designed to learn new data regularly for changes in client activity, calculate thresholds, and report statistics. You can also provide static threshold values for some SLAs, to report network issues. You can view the impacted SLA data in the dashboards.
Wireless
The following SLAs are monitored for wireless clients.
Throughput
This SLA monitors your wireless network at the system and client level, to identify potential low throughput conditions and categorize them based on the underlying issue type, into different classifiers and sub-classifiers. Low throughput is determined based on specific network health parameters, such as, noise, retries, discards, channel utilization etc. and client health parameters, such as, MCS index, data rate.
Coverage
Network coverage issues are monitored by detecting the coverage holes and overlapping FortiAPs (crowded FortiAPs). These conditions in a network are determined by evaluating client’s RSSI (low signal strength) and presence of multiple neighbouring FortiAPs.
Roaming
Wireless clients roam from one AP to another in a multi-AP deployment area swiftly and frequently. Associating with different AP requires a process of re-authentication that can take some time to complete, impeding data connectivity especially for time sensitive applications. The Roaming SLA identifies such slow roaming connections, determines the causes for it and suggests suitable remedy for facilitating faster client roaming.
Time to Connect
This SLA computes the time taken by clients to connect to the network. FortiAIOps reports those clients that take longer than certain thresholds to connect to the network. These thresholds are statically configured or FortiAIOps computes them dynamically using machine learning algorithms. The algorithms compute specific thresholds for the AP-client environment and for different connectivity phases such as association, authentication (4-way handshake) and DHCP.
Connection Failure
This SLA determines the failed/unsuccessful client connections based on different stages of connection to a network. For example, association failures due to low RSSI, authentication failures due to unreachable RADIUS server, DHCP failure due to a DHCP server process crash, or DNS failure due to an invalid DNS domain.
AP Health and Uptime
This SLA determines the health of the FortiAPs based on the configured CPU, memory, temperature thresholds, and events such as FortiAP reboot, FortiSwitch port down, FortiGate, and so on. FortiAIOps displays relevant SLAs under different sections on the monitor dashboard.
Switching
The switching SLAs monitor the switch health and connection status.
Throughput
The Throughput SLA monitors your wired network at the system and client level, to identify potential low throughput conditions and categorizes them based on the underlying issue type, into different classifiers and sub-classifiers. Low throughput is reported based on traffic congestion due to high inbound/outbound traffic, storm conditions, low wired bandwidth conditions leading to network slowdowns, packet drops, and increased latency.
Network
The Network SLA monitors the deployed FortiSwitches to predict any potential network disruptions that may lead to poor connectivity. FortiAIOps detects such issues based on monitoring broadcast and multicast storms, possible IP address exhaustion in the DHCP server, or MCLAG issues such as hardware mismatch or peer communication glitches.
Switch Health and Uptime
The Switch Health and Uptime SLA determines the health of the switches based on the configured thresholds (CPU, memory, temperature) and events such as uplink and power budget issues, port flapping, port down, switch down, and so on. FortiAIOps displays relevant SLAs under different sections on the AI Insight dashboard and the Impacted SLA and Impacted Devices pages.
Switch Connection Failure
The Switch Connection Failure SLA determines the failed/unsuccessful client connections based on authentication events such as MAC authentication and 802.1x authentication, MAC learning limit, and blocked DHCP clients.
WAN
WAN is a software-defined approach for managing Wide-Area Networks (WAN). It allows you to offload internet bound traffic, that is, private WAN services remain available for real-time and mission critical applications. This added flexibility improves traffic flow and reduces pressure on the network. WAN has member interfaces and ports that are used to run traffic.
Performance
You can configure Performance SLAs to monitor member interface link quality and to detect link failures. The link quality is measured based on latency, jitter, and packet loss. FortiAIOps WAN SLA can follow the performance SLAs defined on FortiGate and report the SLA breaches.
FortiExtender
FortiExtender integrates with FortiGate and WAN to become a part of Fortinet's security fabric. This integration enables FortiGate’s WAN to have an extension using FortiExtender, providing continuous connectivity in case FortiGate's primary WAN link fails. Also, FortiExtender enables network access for remote sites and branches located beyond fixed broadband.
FortiExtender also facilitates load balancing for network traffic along with the primary WAN link. When FortiExtender is a part of your network, FortiAIOps monitors and reports related issues/failures.
Note: FortiAIOps monitors only the FortiExtender devices managed by FortiGate.