


FortiSOAR Performance Benchmarking for v7.4.1
This document details the performance benchmark tests conducted in Fortinet labs. The objective of this performance test is to measure the time taken to create alerts in FortiSOAR, and complete the execution of corresponding playbooks on the created alerts in the following cases:
-
Single-node FortiSOAR system
-
Cluster setup of FortiSOAR
The data from this benchmark test can help you in determining your scaling requirements for a FortiSOAR system to handle the expected workload in your environment.
Summary
The performance of a single-node FortiSOAR system and a two-node active-active FortiSOAR high-availability (HA) cluster was evaluated by conducting performance tests. The objective of the tests was to provide an analysis of how various FortiSOAR configurations perform for different types of workloads. The tests were performed on FortiSOAR images with their default OVA configurations; no performance tuning was done.
During the tests, both the single-node FortiSOAR system and the FortiSOAR HA cluster were subjected to real-world scenario simulations with identical workloads. Different test cases were performed that involved ingestion of varying numbers of records at different ingestion rates. The subsequent processing of the ingested data was also evaluated.
The results of the performance tests demonstrated that a FortiSOAR HA cluster was able to process workloads more effectively when compared to a the single-node system. The HA cluster showcased its ability to efficiently process workloads and deliver faster processing times. By distributing the workload among multiple nodes in an active-active configuration, the HA cluster enabled parallel processing, leading to a substantial performance improvement. Specifically, the tests revealed that a two-node HA cluster was approximately 35-40% faster than a single-node FortiSOAR system as summarized in the Summary of the Data Ingestion Test on sizable data: Performance comparison of a single FortiSOAR system and a FortiSOAR HA cluster topic. This significant speed advantage highlights the benefits of deploying an HA cluster, particularly when time-sensitive processing is crucial.
Summary of tests performed
The following tests are performed on both a single FortiSOAR system, and a HA cluster of two active-active FortiSOAR nodes:
- Ingestion of alerts into FortiSOAR.
- Ingestion of alerts followed by extraction of associated indicators.
- Ingestion of alerts, then extraction of associated indicators, followed by enrichment of the extracted indications using one source.
- Data ingest a large number of alerts. On alert creation the default SOAR Framework Solution Pack (SFSP) playbooks are automatically triggered to perform various processes such as extraction and enrichment of indicators, calculation of SLA, etc. For every ingested alert, 16 playbooks get triggered.
For more information on SFSP see its documentation on FortiSOAR Content Hub. - Sustain the processes of ingestion of alerts for approximately a 12-hour period. On alert creation the default SOAR Framework Solution Pack (SFSP) playbooks are automatically triggered to perform various processes such as extraction of indicators, enrichment of indicators, etc. For every ingested alert, 16 playbooks get triggered.
Note that this test is performed only on a single FortiSOAR system.
Environment
FortiSOAR Virtual System Specifications
| Component | Specifications |
|---|---|
| FortiSOAR Build Version | 7.4.1-3167 |
|
CPU |
8 CPUs |
| Memory | 32 GB |
| Storage | 445.98 GB virtual disk, HDD with IOPS 3000, attached to a VMware ESXI system |
Operating System Specifications
| Operating System | Kernel Version |
|---|---|
| Rocky Linux 8.8 | 4.18.0-477.13.1.el8_8.x86_64 |
External Tools Used
| Tool Name | Version |
|---|---|
| Zabbix server used to monitor system usage during the tests | 6.4.1 |
Pre-test conditions on both the standalone FortiSOAR system and the FortiSOAR High Availability (HA) cluster
At the start of each test run -
- The test environment contains zero alerts.
- The test environment contains only the FortiSOAR built-in SOAR Framework Solution Pack (SFSP). The performance tests were performed using version 2.2.0 of SFSP.
- The test environment must contain a configured enrichment connector such as VirusTotal, URL scan.in, etc., for test cases that require alerts to be enrichment.
- The test environments for Test1, 2, and 3 did not contain any playbooks in the 'Running' or 'Active' state.
|
|
In a production environment the network bandwidth, especially for outbound connections for enrichment connectors might vary that could affect the observations. |
Test setups
- For a single-node FortiSOAR system- Configure the standalone FortiSOAR system according to the specifications mentioned in the Environment topic.
- For the FortiSOAR HA cluster - Create an active-active HA cluster of two FortiSOAR systems. Configure both the FortiSOAR systems according to the specifications mentioned in the Environment topic.
Test 1: Ingest alerts into FortiSOAR using an ingestion playbook
This test is executed by manually triggering an ingestion playbook that creates alerts in FortiSOAR.
Steps followed
- Created the alerts using the ingestion playbook.
You can download and use the sample playbooks contained in "PerfBenchmarking_Test01_PB_Collection_7_4.zip" file if you want to run the tests in your environment. All the sample playbook collections are included in Appendix: Sample playbooks zip files. - Once the alerts are created, measure the total time taken to create all the alerts in FortiSOAR.
Observations
The data in the following table outlines the number of alerts ingested and the total time taken to ingest those alerts:
| Number of alerts created in FortiSOAR | Total number of playbooks executed in FortiSOAR | Total time (in minutes) taken to create all alerts in a standalone FortiSOAR system |
Total time (in minutes) taken to create all alerts in an active-active FortiSOAR HA cluster with two systems |
|---|---|---|---|
| 100 | 1 | 0.7 | 0.7 |
| 500 | 1 | 0.36 | 0.34 |
| 1000 | 1 | 1.11 | 1.11 |
| 1500 | 1 | 1.47 | 1.46 |
| 2000 | 1 | 2.24 | 2.23 |
| 2500 | 1 | 2.57 | 2.56 |
Note: Once this test is completed, refer to the pre-test conditions before starting a new test.
Test 2: Ingest alerts into FortiSOAR followed by automated indicator extraction
This test is executed by manually triggering an ingestion playbook that creates alerts in FortiSOAR. Once the alerts are created in FortiSOAR, an "Extraction" playbook is triggered and the total time taken for all the extraction playbooks to complete their execution is calculated.
Steps followed
- Created the alerts using an ingestion playbook.
- On alert creation, the "Extraction" playbooks are triggered. You can download and use the sample playbooks contained in the "PerfBenchmarking_Test02_PB_Collection_7_4.zip" file if you want to run the tests in your environment. All the sample playbook collections are included in Appendix: Sample playbooks zip files.
Observations
The data in the following table outlines the number of alerts ingested, the total time taken to ingest those alerts, and the total time taken for all the triggered playbooks to complete their execution:
| Number of alerts created in FortiSOAR | Total number of playbooks executed in FortiSOAR | Total time (in minutes) taken to create all alerts in a standalone FortiSOAR system | Total time (in minutes) taken to create all alerts in an active-active FortiSOAR HA cluster with two systems |
|---|---|---|---|
| 100 | 101 | 0.20 | 0.15 |
| 500 | 501 | 1.19 | 1.04 |
| 1000 | 1001 | 2.33 | 2.19 |
| 1500 | 1501 | 3.71 | 3.13 |
| 2000 | 2001 | 5.05 | 4.17 |
| 2500 | 2501 | 6.19 | 5.21 |
Note: Once this test is completed, refer to the pre-test conditions before starting a new test.
Test 3: Ingest alerts into FortiSOAR, automated indicator extraction, followed by enrichment of the extracted indicators
The test was executed using an automated testbed that starts the ingestion which in turn creates alerts in FortiSOAR. Once the alerts are created in FortiSOAR, "Extraction" and "Enrichment" playbooks are triggered, and the total time taken for all the extraction and enrichment playbooks to complete their execution is calculated.
|
|
The setup for this test is exactly the same as Test 2, however this test additionally requires any enrichment connector to be configured. |
Steps followed
- Created the alerts using an ingestion playbook.
- On alert creation, the "Extraction" and "Enrichment" playbooks are triggered. You can download and use the sample playbooks contained in the "PerfBenchmarking_Test03_PB_Collection_7_4.zip" file if you want to run the tests in your environment. All the sample playbook collections are included in Appendix: Sample playbooks zip files.
Observations
The data in the following table outlines the number of alerts ingested, the total time taken to ingest those alerts, and the total time taken for all the triggered playbooks to complete their execution.
| Number of alerts created in FortiSOAR | Total number of playbooks executed in FortiSOAR | Total time (in minutes) taken to create all alerts in a standalone FortiSOAR system | Total time (in minutes) taken to create all alerts in an active-active FortiSOAR HA cluster with two systems |
|---|---|---|---|
| 100 | 1001 | 2.13 | 1.31 |
| 500 | 5001 | 10.47 | 7.14 |
| 1000 | 10001 | 22.52 | 14.42 |
| 1500 | 15001 | 34.31 | 22.10 |
| 2000 | 20001 | 46.20 | 28.90 |
| 2500 | 25001 | 57.53 | 36.35 |
Note: Once this test is completed, refer to the pre-test conditions before starting a new test. Also, note that enrichment playbooks make API calls over the Internet, and the times mentioned in this table to execute playbooks is inclusive of this time.
Test 4: Data Ingestion Test on a sizable data set
This test aims to evaluate FortiSOAR's performance during a prolonged data ingestion. The primary focus of these tests is to assess the efficiency and performance of the alert creation process and the execution of SFSP playbooks executions on a large data set. The objective is to gather data on the time taken to complete these operations in both a single-node FortiSOAR system and an active-active FortiSOAR HA cluster with two systems. The data gathered allows for a comparison between a single-node FortiSOAR system and a FortiSOAR HA cluster in regards to their performance in handling a significant number of alerts and playbook executions; summary of which is added in the Summary of the Data Ingestion Test on sizable data: Performance comparison of a single FortiSOAR system and a FortiSOAR HA cluster topic.
Data Ingestion Test on a sizable data set for a single-node FortiSOAR system
Steps followed
- Created the alerts using an ingestion playbook.
You can download and use the sample playbooks contained in the "PerfBenchmarking_Test04_PB_Collection_7_4.zip" file if you want to run the tests in your environment. All the sample playbook collections are included in Appendix: Sample playbooks zip files. - On alert creation, the default SFSP playbooks for extraction and enrichment of indicators, calculation of SLA, etc. are automatically triggered.
- Record the total execution time for all these playbooks.
This test followed an ingestion rate of 50 alerts in bulk with a delay between each batch. Each alert generates 3 unique indicators in the FortiSOAR system, and the indicator enrichment process sets their reputation to 'Malicious'. Additionally, hourly, a burst of 100 alerts is ingested in bulk, which maintain the same indicator values as the previously injected data.
Number of alerts ingested: 29700
Extracted indicator count: 85500
Duration: 18 hours, 43 minutes, and 8 seconds
Total number of playbooks executed: 474607
Results
The system performed well under the sustained load. All 29700 alerts were successfully ingested and all the SFSP playbooks executed without any issues.
Graphs
The following graphs are plotted for the vital statistics for the system that was under test during the period of the test run.
Rate of Alert Ingestion
Analysis of alert ingestion when the test run was in progress on the system:

50 alerts were ingested in bulk with a delay of 50 seconds, followed by a burst of 100 alerts after 1 hour. The total number of alerts ingested was 29,700.
Active Playbook Graph
Analysis of active playbooks that were running when the test run was in progress on the system:

Celery workers were responsible for distribution of the tasks and execution of playbooks in parallel. On an average 34 playbooks were executed in a minute.
RabbitMQ Playbook Queue Graph
Analysis of RabbitMQ Playbook Queue Count when the test run was in progress on the system:
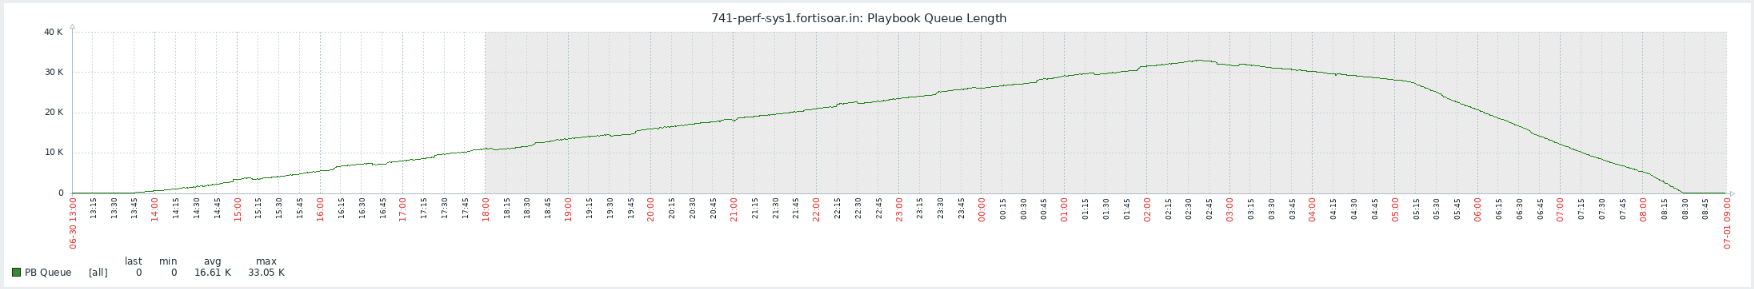
It was observed that during the test the rabbitmq_pb_queue rose to a maximum of 33.05k playbooks queued on the system for some time but eventually went back to 0. This means that no playbooks remained in the queue and that all the required playbooks associated with the alerts were getting completed, i.e., all alerts were created, and their indicators were extracted and enriched.
CPU Utilization Graph
Analysis of CPU Utilization when the test run was in progress on the system:

Using the system resources specified in the "Environment" topic, it was observed that this test was running the CPU utilization was around 83%.
Memory Utilization Graph
Analysis of Memory Utilization when the test run was in progress on the system:

Using the system resources specified in the "Environment" topic, it was observed that this test was running the CPU utilization was around 48.36%.
PostgreSQL Disk Utilization and Read/Write IO Wait Graph
The Disk Utilization graph represent the percentage of elapsed time during which the PostgreSQL disk drive was busy while servicing 'Read' or 'Write' requests.
Analysis of PostgreSQL Disk Utilization when the test run was in progress on the system:

Using the system resources specified in the "Environment" topic, it was observed that when the test was running the PostgreSQL disk utilization averaged at 57.67%. The "Read" Wait for the PostgreSQL disk averaged around 0.3 milliseconds. The "Write" Wait for the PostgreSQL disk averaged around 0.5 millisecond, with the maximum wait of 10.20 milliseconds and the minimum wait of 0.22 milliseconds.
ElasticSearch Disk Utilization and Read/Write IO Wait Graph
The Disk Utilization graph represent the percentage of elapsed time during which the ElasticSearch disk drive was busy while servicing 'Read' or 'Write' requests.
Analysis of ElasticSearch Disk Utilization when the test run was in progress on the system:

Using the system resources specified in the "Environment" topic, it was observed that when the test was running the ElasticSearch disk utilization averaged at 1.56%. The "Read" Wait for the ElasticSearch disk averaged around 0 milliseconds. The "Write" Wait for the ElasticSearch disk averaged around 0.5 millisecond, with the maximum wait of 16.55 milliseconds and the minimum wait of 0.16 milliseconds.
Data Ingestion Test on a sizable data set for an active-active FortiSOAR HA cluster with two systems
Steps followed
- Created the alerts using an ingestion playbook.
You can download and use the sample playbooks contained in the "PerfBenchmarking_Test04_PB_Collection_7_4.zip" file if you want to run the tests in your environment. All the sample playbook collections are included in Appendix: Sample playbooks zip files. - On alert creation, the default SFSP playbooks for extraction and enrichment of indicators, calculation of SLA, etc. are automatically triggered.
- Record the total execution time for all these playbooks.
This test followed an ingestion rate of 50 alerts in bulk with a delay between each batch. Each alert generates 3 unique indicators in the FortiSOAR system, and the indicator enrichment process sets their reputation to 'Malicious'. Additionally, hourly, a burst of 100 alerts is ingested in bulk, which maintain the same indicator values as the previously injected data.
Number of alerts ingested: 29700
Extracted indicator count: 85500
Duration: 12 hours, 9 minutes, 42 seconds
Total number of playbooks executed: 474607
Results
The system performed well under the sustained load. All 29700 alerts were successfully ingested and all the SFSP playbooks executed without any issues.
Graphs
The following graphs are plotted for the vital statistics for the system that was under test during the period of the test run.
Rate of Alert Ingestion
Analysis of alert ingestion when the test run was in progress on the system:

50 alerts were ingested in bulk with a delay of 50 seconds, followed by a burst of 100 alerts after 1 hour. The total number of alerts ingested was 29,700.
Active Playbook Graph
Analysis of active playbooks that were running when the test run was in progress on the system:

Celery workers were responsible for distribution of the tasks and execution of playbooks in parallel. On an average 68 playbooks were executed in a minute.
RabbitMQ Playbook Queue Graph
Analysis of RabbitMQ Playbook Queue Count when the test run was in progress on the system:
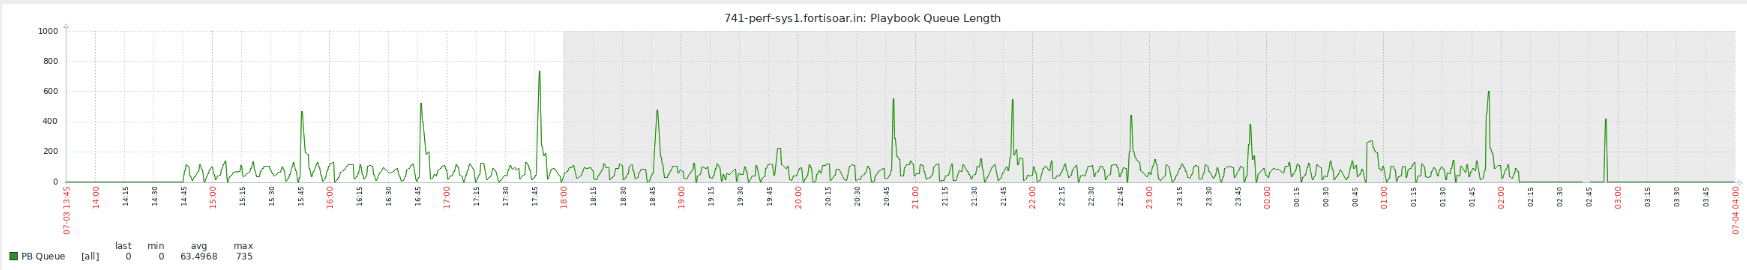
It was observed that during the test the rabbitmq_pb_queue rose to a maximum of 735 playbooks queued on the system for some time but eventually went back to 0. This means that no playbooks remained in queue and that all the required playbooks associated with the alerts were getting completed, i.e., all alerts were created, and their indicators were extracted and enriched.
CPU Utilization Graph
Analysis of CPU Utilization when the test run was in progress on the system:

Using the system resources specified in the "Environment" topic, it was observed that this test was running the CPU utilization was around 71.89%.
Memory Utilization Graph
Analysis of Memory Utilization when the test run was in progress on the system:

Using the system resources specified in the "Environment" topic, it was observed that this test was running the CPU utilization was around 43.90%.
PostgreSQL Disk Utilization and Read/Write IO Wait Graph
The Disk Utilization graph represent the percentage of elapsed time during which the PostgreSQL disk drive was busy while servicing 'Read' or 'Write' requests.
Analysis of PostgreSQL Disk Utilization when the test run was in progress on the system:

Using the system resources specified in the "Environment" topic, it was observed that when the test was running the PostgreSQL disk utilization averaged at 62.28%. The "Read" Wait for the PostgreSQL disk averaged around 0 milliseconds. The "Write" Wait for the PostgreSQL disk averaged around 0.6 millisecond, with the maximum wait of 14.74 milliseconds and the minimum wait of 0.20 milliseconds.
ElasticSearch Disk Utilization and Read/Write IO Wait Graph
The Disk Utilization graph represent the percentage of elapsed time during which the ElasticSearch disk drive was busy while servicing 'Read' or 'Write' requests.
Analysis of ElasticSearch Disk Utilization when the test run was in progress on the system:

Using the system resources specified in the "Environment" topic, it was observed that when the test was running the ElasticSearch disk utilization averaged at 2%. The "Read" Wait for the ElasticSearch disk averaged around 0 milliseconds. The "Write" Wait for the ElasticSearch disk averaged around 0.54 millisecond, with the maximum wait of 13 milliseconds and the minimum wait of 0.16 milliseconds.
Summary of the Data Ingestion Test on sizable data: Performance comparison of a single FortiSOAR system and a FortiSOAR HA cluster
In the standalone FortiSOAR system, it took 18 hours, 43 minutes, and 8 seconds to process the 29,700 alerts. However, in the active-active FortiSOAR HA cluster with two systems, the same set of alerts was processed in 12 hours, 9 minutes, and 42 seconds. Therefore, for the same workload, a two-node HA cluster saves 6 hours, 34 minutes, and 34 seconds while ingesting data, making the FortiSOAR HA cluster around 35-40% faster when compared to a single node FortiSOAR system.
Test 5: Sustained Invocation Test for a single-node FortiSOAR system
The objective of this test is to process the ingested alert data in a minute without building up the queue.
Steps followed
- Created the alerts using an ingestion playbook.
You can download and use the sample playbooks contained in the "PerfBenchmarking_Test05_PB_Collection_7_4.zip" file if you want to run the tests in your environment. All the sample playbook collections are included in Appendix: Sample playbooks zip files. - On alert creation, the default SFSP playbooks for extraction and enrichment of indicators, calculation of SLA, etc. are automatically triggered.
- Record the total execution time for all these playbooks.
This test followed an ingestion rate of 20 alerts in bulk with a delay between each batch. Each alert generates 3 unique indicators in the FortiSOAR system, and the indicator enrichment process sets their reputation to 'Malicious'.
Number of alerts ingested: 14400
Duration: 12 hours 23 minutes
Total number of playbooks executed: 232253
Results
The system performed well under the sustained load. All 14400 alerts were successfully ingested and all the SFSP playbooks executed without any queuing.
Graphs
The following graphs are plotted for the vital statistics for the system that was under test during the period of the test run.
Rate of Alert Ingestion
Analysis of alert ingestion when the test run was in progress on the system:

20 alerts were ingested in bulk with a delay of 55 seconds for 12 hours.
Active Playbook Graph
Analysis of active playbooks that were running when the test run was in progress on the system:

Celery workers were responsible for distribution of the tasks and execution of playbooks in parallel. On an average 34 playbooks were executed in a minute.
RabbitMQ Playbook Queue Graph
Analysis of RabbitMQ Playbook Queue Count when the test run was in progress on the system:
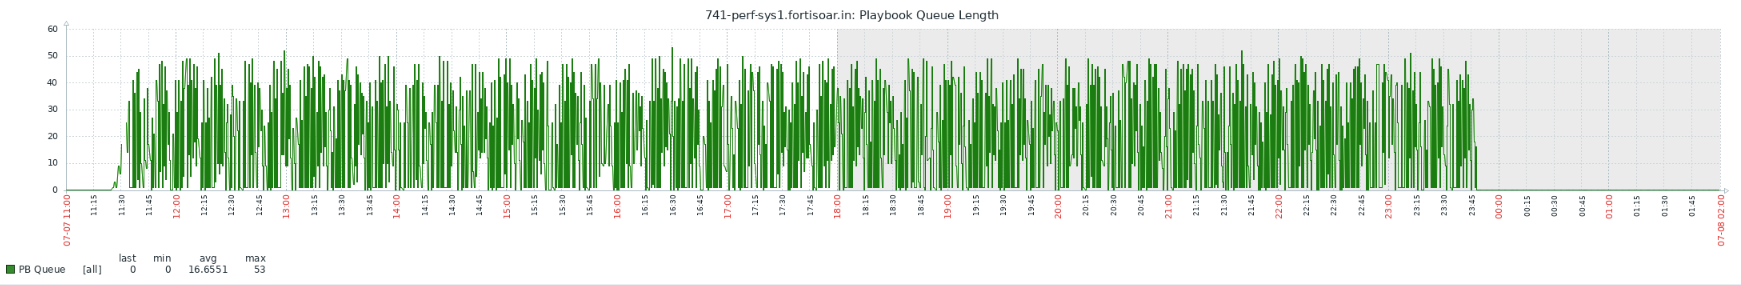
It was observed that during the test the rabbitmq_pb_queue rose to a maximum of 53 playbooks queued on the system for some time but eventually went back to 0. This means that no playbooks remained in queue and that all the required playbooks associated with the alerts were getting completed, i.e., all alerts were created, and their indicators were extracted and enriched.
CPU Utilization Graph
Analysis of CPU Utilization when the test run was in progress on the system:

Using the system resources specified in the "Environment" topic, it was observed that this test was running the CPU utilization was around 50%.
Memory Utilization Graph
Analysis of Memory Utilization when the test run was in progress on the system:

Using the system resources specified in the "Environment" topic, it was observed that this test was running the CPU utilization was around 46%.
PostgreSQL Disk Utilization and Read/Write IO Wait Graph
The Disk Utilization graph represent the percentage of elapsed time during which the PostgreSQL disk drive was busy while servicing 'Read' or 'Write' requests.
Analysis of PostgreSQL Disk Utilization when the test run was in progress on the system:

Using the system resources specified in the "Environment" topic, it was observed that when the test was running the PostgreSQL disk utilization averaged at 37.94%. The "Read" Wait for the PostgreSQL disk averaged around 0.01 milliseconds. The "Write" Wait for the PostgreSQL disk averaged around 0.3 millisecond, with the maximum wait of 3.8 milliseconds and the minimum wait of 0.47 milliseconds.
ElasticSearch Disk Utilization and Read/Write IO Wait Graph
The Disk Utilization graph represent the percentage of elapsed time during which the ElasticSearch disk drive was busy while servicing 'Read' or 'Write' requests.
Analysis of ElasticSearch Disk Utilization when the test run was in progress on the system:

Using the system resources specified in the "Environment" topic, it was observed that when the test was running the ElasticSearch disk utilization averaged at 1.8%. The "Read" Wait for the ElasticSearch disk averaged around 0 milliseconds. The "Write" Wait for the ElasticSearch disk averaged around 0.39 millisecond, with the maximum wait of 12.8 milliseconds and the minimum wait of 0.16 milliseconds
Appendix: Sample playbooks zip files
You can download the following sample playbook collections so that you can run the same tests in your environment to see the performance in your version/hardware platforms. Or, if you want to make some additions that are specific to your environment, you can also tweak the existing playbooks.