SNMP polling
After adding a network device to FortiMonitor, the OnSight automatically detects its type then provisions the appropriate standard metrics. If you require additional metrics beyond the provisioned standard metrics, use the SNMP catalog to add the metrics. SNMP polling is available to users who have installed an OnSight vCollector on their private network and want to monitor SNMP-capable network devices. For instructions on how to set up an OnSight vCollector, see OnSight vCollector overview.
To get started with SNMP polling, perform the following steps:
-
From the Monitoring Config tab of the network device's Instance Details page, select Add Monitoring > SNMP.
-
Select Configure Metrics.
-
Select a model from the SNMP Catalog. You can also use the MIB Browser or, if you know the OID, add the SNMP metric manually.
Note: If you do not see your device here or in the MIB Browser, please contact our support team.
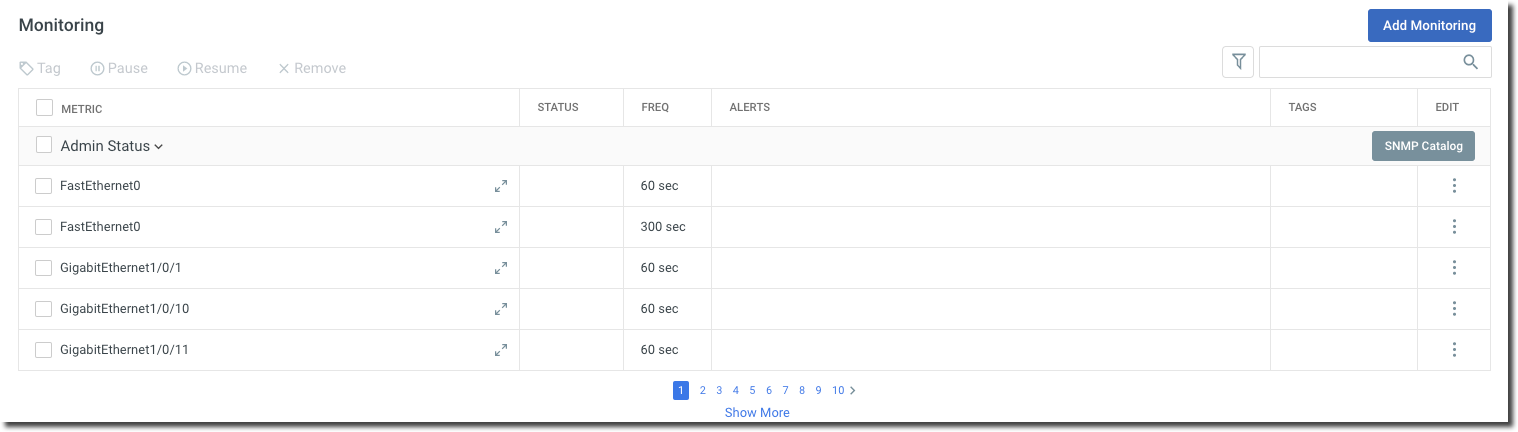
Selecting the model type will bring you into the catalog with the OID’s for that device. The list includes the name, OID, and a description of the metric. You can also search for a particular metric with keywords that may be contained in the description or name using the magnifying glass icon at the top right.
-
Select the metrics to monitor for this device.
Metrics like Admin Status or ifInOctets will expand into a number of individual metrics, based on the number of ports on your device.