


System Configuration
You can customize FortiSOAR and configure several default options used throughout the system, including the way FortiSOAR gets displayed to the users and the way notifications are sent to the users. To configure the system, you must be assigned CRUD permissions to the Application module. The Application module is assigned by default to the Application Administrator role. For information about roles, refer to the Default Roles section in the Security Management chapter.
Click the Settings ( ) icon to open the
 System (System Configuration) page. Use the Application Configuration tab on the System Configuration page to edit several default options found throughout the system, especially in the user profile. These include the following:
- Default notifications mechanism
- Default notifications for system and health monitoring
- Default Comment Modification
- Default Playbook Recovery options
- Default timezone for exporting reports
- Default theme
- Purging of audit logs and executed playbook logs
- Default country code
- Default navigation bar style
For more information on user profile configuration, refer to the User Profiles section in the Security Management chapter.

|
|
You can modify all the default values on a per-user basis on any user's Profile page. |
To enable sending system notifications, including requests for resetting passwords, and also for sending emails outside FortiSOAR you must configure the SMTP connector. For more information on FortiSOAR Built-in connectors, including the SMTP connector, see the "FortiSOAR Built-in connectors" article.
Click Settings > Audit Log to open the Audit Log page. Use the Audit Log page to view a chronological record of all actions across FortiSOAR. For more information, see Audit Log.
Click Settings > License Manager to open the License Manager page. Use the License Manager page to update your license and view the details of your FortiSOAR license. For more information, see License Manager.
Use the Environment Variables tab on the System Configuration page to add proxies to serve HTTP, HTTPS, or other protocol requests from FortiSOAR or define environment variables. For the procedure for configuring proxy settings and defining environment variables is included in the Configuring Proxy Settings and environment variables topic in the Additional configuration settings for FortiSOAR chapter of the "Deployment Guide."
Use the Branding tab on the System Configuration page to customize FortiSOAR branding based on your license type. For more information, see Branding.
Use the System Fixtures tab on the System Configuration page to view the links to various playbook collections and templates, which are included by default with FortiSOAR. For more information, see System Fixtures.
Application Configuration
On the Application Configuration page, you can configure settings that will apply across FortiSOAR. You can edit the settings and then click Save to apply the changes or click Revert to revert your changes.
Configuring Notifications
Currently, FortiSOAR supports only email as a notification mechanism.
FortiSOAR sends notifications to users for updates to tasks or activities. Non-admin users can change their notification setting by editing their user profile to either enable or disable email notifications. Changes made by a non-admin user to the notification settings are applicable only to those users who have not changed their default user profile settings.
|
|
You must configure your SMTP connector before you can configure notifications and to complete the process of adding new users. If you do not configure the SMTP connector, users are created. However, the password reset notification link cannot be sent to the users. For more information on FortiSOAR Built-in connectors, including the SMTP connector, see the "FortiSOAR Built-in connectors" article. |
Configuring System and Cluster Health Monitoring
From version 6.4.3 onwards, you can set up system monitoring for FortiSOAR, both in case of a single node system and High Availability (HA) clusters. To receive email notifications of any FortiSOAR service failure, or of any monitored thresholds exceeding the set threshold, etc., click the Enable Notification checkbox in the System & Cluster Health Monitoring section.

Once you click the Enable Notification checkbox, from the Service drop-down list, select the service to be used for notifications. You can choose between SMTP or Exchange. In the Email field, specify the email address that will be notified in case of any service failures, threshold breaches, etc.
|
|
From version 7.0.0 onwards, the email that is sent for high CPU consumption will also contain information about the processes that are consuming the most memory. |
In the Monitoring Interval (Minutes) field specify the interval in minutes at which you want to monitor the system and perform the health check of the HA cluster. By default, the system is monitored every 5 minutes.
In the System Health Thresholds section, you can set the thresholds, in percentages, for Memory Utilization (80% default), CPU Utilization (80% default), Disk Utilization (80% default), and Swap Memory Utilization (50% default). From version 7.0.0 onwards, you can also set the Workflow Queue Threshold, i.e., the value of the celery queue size. The default value of the workflow queue is set at 100. If the thresholds set are reached or crossed for any of the monitored parameters, an email notification is sent to the specified email addresses.
If you have an HA environment, then in addition to the above settings, you can also monitor and get notified in case of heartbeat failures and high replication lags between nodes of your HA cluster. You can specify values for these parameter in the Cluster Health section:

In the Missed Heartbeat Count field, specify the count of missed heartbeats after which notifications of failure will be sent to the email addresses you have specified.
|
|
You cannot specify a value lesser than 3 in the Missed Heartbeat Count field. |
In the Replication Lag field, specify the threshold, in percentage, for the replication lag between nodes. By default, this is set to 60%. This 60% is relative of the total max lag of 10 GB (wal_segment_count, 640 in postgresql.conf). If the replication lag threshold is reached or crossed, then an email notification is sent to the specified email addresses.
Some examples of how Monitoring Interval (Minutes) and Missed Heartbeat Count values help you in monitoring heartbeats between nodes in an HA cluster:
Case 1
If you have set the Monitoring Interval to 5 minutes and the Missed Heartbeat Count to 3, this means that when the heartbeat is missed (the cyops-ha service is down) for the last >=15 minutes (monitoring interval * missed heartbeat count), the heartbeat missed notification will be sent to the email address that you have specified in the Email field.
The cluster health check is performed based on the monitoring interval specified. For example, if you specify 3 minutes in the Monitoring Interval (Minutes) field, then the HA cluster health check will be run every 3 minutes.
Notifications get sent based on the multiplication of the values that you have set in the monitoring interval and missed heartbeat count. For example, if you have set monitoring interval to 3 and missed heartbeat count to 4, and if the heartbeat is missed for the last >=12 minutes, then heartbeat missed notifications will be sent to the email address that you have specified in the Email field.
Case 2
If you have no heartbeats missed for the last >=15 minutes, considering monitoring interval set to 5 minutes and missed heartbeat count set to 3; however, there is a service down or a service connectivity failure found in the health check, then a notification for service down or service connectivity failure will be sent to the email address that you have specified in the Email field.
For more information on HA, see the High Availability support in FortiSOAR chapter.
Configuring Comments
A user who has Security Update permissions can edit comments of any FortiSOAR user, and a user who has Security Delete permissions can delete comments of any FortiSOAR user. There is no time limit for the Security user to update or delete comments.
Users can edit and delete their own comments in the "Collaboration" window or in the Comments widget, if you (the administrator) has enabled the settings for comment modification and if the user has appropriate CRUD permissions on the Comments module.
To allow users to edit and delete their own comments, click the Settings icon, which opens the System Configuration page. On the Application Configuration tab, in the Comment Modification section, select the Allow Comment Modification checkbox.

You can also specify the time until when the user can edit or delete their comments in the Allow users to modify /delete their comments for a duration of field. For example, if you select 1 minute from this field, then users can edit and delete their comments until 1 minute after which they have added the comment. By default, the Allow users to modify/delete their comments for a duration of field is set to 5 minutes. Users cannot edit or delete their comments after the time specified in the Allow users to modify/delete their comments for a duration of field.
From version 6.4.1 onwards, you can specify the behavior of the comment "delete" action, i.e., when a user deletes a comment, you can choose to permanently delete the comment or flag the comment for deletion, i.e., Soft Delete. If you choose to keep the Soft Delete checkbox checked (default), then the comments will be soft deleted, i.e., on the UI you will see --Comment Deleted-- instead of the comment. In case you have cleared the Soft Delete checkbox, you will not see anything on the UI since the comment has been permanently deleted.
Version 7.0.0 introduces the Comment Email Notifications On @ Mentions field, which is used to determine whether users should receive email notifications if they get mentioned or tagged in comments. By default this checkbox is selected, i.e., users will get an email notification when anyone tags that user in a comment, You can clear this checkbox, if you do not want users to receive the email notification for mentions in comments.
Purging of audit logs and executed playbook logs
You can schedule purging, on a global level, for both audit logs and executed playbook logs. Click the Settings icon, which opens the System Configuration page. In the Purge Logs section, you can define the schedule for purging both Audit Logs and Executed Playbook Logs.
By default, audit logs are not purged and executed playbooks logs are purged.

|
|
The Purging activity deletes logs permanently, and you cannot revert this operation. |
Scheduling purging of audit logs
To purge Audit Logs, you must be assigned a role that has a minimum of Read permission on the Security module, Read permission on the Application module, and Delete permissions on the Audit Log module.
To enable purging of Audit logs, select the Enable Purging checkbox that appears in the Audit Logs section.
Once you select the Enable Purging checkbox, you require to define the schedule for purging of audit logs. To specify the time for which you want to retain the logs, you must select the appropriate option from the Keep logs Of drop-down list. You can choose from the following options: Last month, Last 3 months, Last 6 months, Last year, or Custom as shown in the following image:

If you choose Custom, then you must specify the number of days for which you want to retain the logs.
|
|
For purging purposes, 1 month is considered as 30 days and 1 year is considered as 365 days. |
The purging schedule clears all logs that belong to a timeframe earlier than what you have specified.
For example, if you want to retain audit logs for a month, then select Last month from the Keep logs of drop-down list. Once you save this setting all audit logs that are older than 1 month (30 days) will be cleared, and this will be an ongoing process, as the audit log records will all be time-stamped and the ones older than 30 days will be purged.
|
|
By default, the purge schedule job, runs every midnight (UTC time) and clears all logs that have exceeded the time duration that you have specified. If you want to run the purging activity at a different time of the day or for a different duration, you can do so by editing the schedule of purging on the |
Scheduling purging of executed playbook logs
To purge Executed Playbook Logs, you must be assigned a role that has a minimum of Read and Update permissions on the Security module, Read and Update permissions on the Application module, and Delete permissions on the Playbooks module.
Purging of executed playbook logs based on date or days criteria
Executed Playbook Logs are purged by default, and therefore the Enable Purging checkbox is already selected in the Executed Playbook Logs section. By default, any executed playbook logs that are older than 15 days are purged. You can change time for which you want to retain the playbook execution logs by selecting the appropriate option from the Keep logs Of drop-down list, as is the case with audit logs.
A system schedule, named "Purge Executed Playbook Logs" is also already created and active on the Schedules page. This schedule runs every midnight (UTC time) and clears all logs that have exceeded the time duration that is specified. If you want to run the purging activity at a different time of the day or for a different duration, you can do so by editing this schedule.
Purging of executed playbook logs based on criteria other than date or days
From version 7.0.0 onwards, you can purge executed playbook logs based on some complex query condition that involves multiple parameters and not just the date or days criteria. For example, clearing logs of ingestion playbooks that have completed their execution. Being able to clear logs based on these criteria is useful since ingestion playbooks are generally scheduled and they can occupy a major chunk of playbook history in the database. Therefore, this feature provides you with an option to build desired queries for purging executed playbook logs and scheduling the purging.
To add the custom criteria, based on the clearing ingestion playbook that have completed their execution example, do the following:
-
Click the +Add link in the "Additional Criteria" section.
-
In the Criteria Title field, enter the title of the criteria based on which you want to purge the executed playbook logs. For example,
Purging Ingestion Playbook Logs. -
Select the logical operator, All of the below are True (AND), or Any of the below is True (OR). For our example, we require the AND operator, since we want to purge all playbooks that contain the "ingestion" tag and whose status is finished, so select All of the below are True (AND).
-
Click the Add Condition link to add conditions for purging the executed playbook logs:
From the Select a field drop-down, select Tags, from the Operator drop-down list select Contains and in the Add Tags field, enteringestion. Click the Add Condition link again, and from the Select a field drop-down, select Status, from the Operator drop-down list select Equals, in the Status drop-down list select finished.
You can add additional conditions or criteria as per your requirements. -
Schedule the purging of the executed playbooks logs based on the above-specified criteria by selecting the appropriate option from the Keep Logs Of drop-down list. You can choose from the following options: Last month, Last 3 months, Last 6 months, Last year, or Custom.
For our example, we choose the Custom option and specify1for days, which means that keep the logs for the ingestion playbooks that have finished their execution for just 1 day in the database.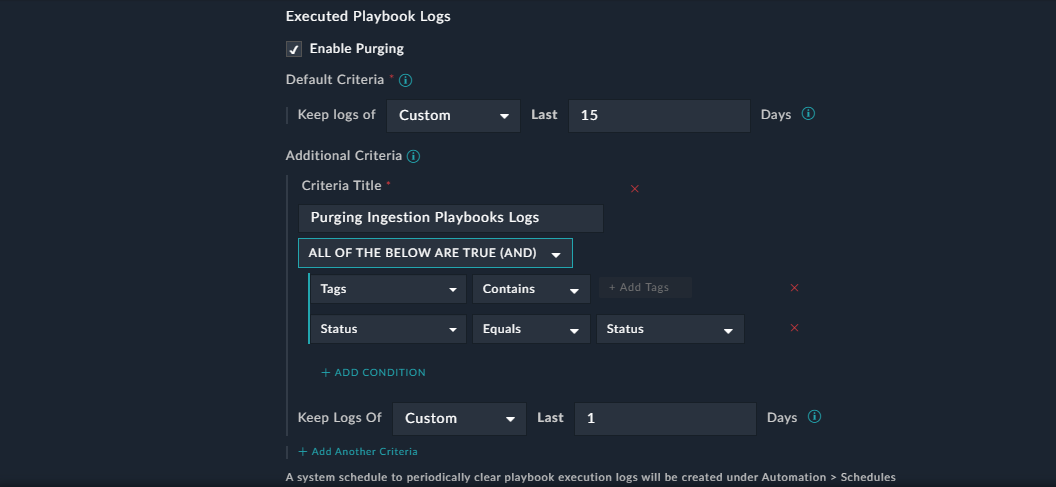
-
To save the criteria for purging executed playbook logs, click Save.
Points to be considered while setting multiple purging criteria
If you have added multiple purging criteria, then the purge functionality purges logs sequentially.
For example, if you have defined the following criteria
- Default: Keep logs of the last 2 days.
- If 'Playbook Execution Status = Failed', then keep logs for last 1 day.
- If Tags contain Ingest, then keep logs for last 1 day.
In such a scenario, logs are purged as follows:
- Retains logs for the last 2 days only, and purges the remaining logs.
- From the logs of the last 2 days, looks for logs that have 'Playbook Execution Status = Failed', and keeps such logs for the last 1 day only.
- Looks for logs that have 'Tags' containing 'Ingest', and keeps such logs for the last 1 day only.
Configuring Playbook Recovery
Use the autosave feature in playbooks to recover playbook drafts in cases where you accidentally close your browser or face any issues while working on a playbook.
In the Playbook Recovery section, you can define the following:
- If you do not want FortiSOAR to save playbook drafts, clear the Enable Playbook Recovery option. By default, this option is checked.
- In the Save Drafts Every field, enter the time, in seconds, after which FortiSOAR will save playbook drafts. By default, FortiSOAR saves playbook drafts 15 seconds after the last change.
The minimum time that you can set for saving playbook drafts is 5 seconds after the last change.
Configuring the default timezone for exporting reports
You can define a timezone that will be used by default for exporting reports. This timezone will be applied by default to all reports that you export from the Reports page. To apply the default timezone, click the Enable Timezone Selection option in the Report Export section. Then from the Timezone drop-down list, search for and select the timezone in which you want to export the report. For example, if you want to search for the timezone of Los Angeles, you can type los in the search box below the Timezone field to find the correct timezone, as shown in the following image:

Managing user listings in people lookup fields
From version 7.0.1 onwards, you can choose to display only active users in 'people lookup' fields, such as assignedTo, across FortiSOAR. To manage user listings in people look up fields, ensure that the Restrict People Lookups To Active Users checkbox in the People Lookup Filter section is selected. If the Restrict People Lookups To Active Users checkbox is cleared then both active and inactive users will be displayed in people lookup fields.
Configuring Themes
You can configure the FortiSOAR theme that will apply to all the users in the system.
Non-admin users can change the theme by editing their user profile. Changes made by a non-admin user to the theme are applicable only to those users who have not changed their default user profile settings.
There are currently three theme options, Dark, Light, and Space, with Space being the default. On the Application Configuration page, select the theme that you want to apply across FortiSOAR. Click Preview Theme to view how the theme would look and click Save to apply the theme.
To revert the theme to the default, click Revert Theme.
Configuring Default Country Code
You can configure country code format for contact numbers that will apply to all users in the system. In the Phone Number section, select the Default Country and thereby the default country code that you want to apply across FortiSOAR and click Save to apply the code.
Configuring Navigation Preferences
You can configure the behavior of the left navigation bar across FortiSOAR. You can choose whether you want the left navigation bar to collapse to just display icons of the modules or expand to display both icons and titles of modules. In the Navigation Preferences section, click Collapse Navigation to collapse the left navigation bar and click Save to apply the behavior of the left navigation bar across the system.
Log Forwarding
Many organizations use an external log management server to manage logs and maintain all logs at a single place, making analysis efficient. From version 6.4.3 onwards, FortiSOAR application logs and audit logs can be forwarded to your central log management server that supports a Rsyslog client, using both the FortiSOAR UI and the csadm CLI. You can also select the category of the logs you want to forward to the external log management server. For information about configuring syslog forwarding using the CLI, see the FortiSOAR Admin CLI chapter.
|
|
If you have a FortiSOAR HA setup, then note that Syslog settings are not replicated to the passive node. If you want to forward logs from the passive node, you must enable it manually using the |
You could also send FortiSOAR logs to a SIEM, since all SIEMs support syslog ingestion, and which would help you achieve the following
- Ease High Availability (HA) troubleshooting since now you can use consolidated logs instead of having to go individual nodes to debug HA issues.
- Ability to forward FortiSOAR logs to your SIEM, if you have a policy of setting up log forwarding to SIEM for all your production devices.
Once the logs are in the a SIEM, you can further configure rules for raising alerts for specific failure, making system monitoring more effective.
Click Settings > System Configuration and then click the Log Forwarding tab to open the Log Forwarding page. Use the Log Forwarding page to setup, modify, and enable or disable your syslog forwarding of FortiSOAR logs to your central syslog server. To enable syslog forwarding, click the Enable Log Forwarding check box.

Once you select the Enable Log Forwarding, you require to fill in the details of the syslog server to which you want to forward the FortiSOAR logs, the type of logs to forward, etc.
|
|
You can configure only a single syslog server. |
- In the Configuration Name field, add the name of the configuration in which you want to store the log forwarding configuration details.
Note: The name that you specify must not have any special characters, underscores, or spaces. - In the
Syslog Server Detailssection, enter the following details:- In the Server field enter the DNS name or IP address of the syslog server to which you want to forward the FortiSOAR logs.
- From the Protocol drop-down list, select the protocol that you want to use to communicate with the syslog server. You can choose between UDP, TCP, or RELP.
- In the Port field enter the port number that you want to use to communicate with the syslog server.
- (Optional) To securely communicate with the syslog server, click Enable TLS.
Once you click Enable TLS, in the Certificate field, you must enter your CA certificate.
If you have a client certificate for your FortiSOAR client, then in the Client Certificate and Client Key fields, you must enter the client certificate and the client key.
- In the
Choose Log Types To Forwardsection, choose the types of FortiSOAR logs you want to forward to the syslog server.
Application Logs include OS logs, and this checkbox is selected by default. To also forward FortiSOAR audit logs, click the Audit Logs checkbox. Once you select audit logs, you can define the following:- From the Specify Audit Log Detail Level drop-down list, select the amount of data, Basic or Detailed that you want to forward to the syslog server. Basic (default and recommended) sends high-level details of the event per audit log, whereas Detailed sends detailed information about the event per audit log.
- In the
Configure Audit Log Forward Rulessection, define the rules to forward audit logs:
From the Record Type drop-down list, select the record types such as, Alerts, Incidents, etc. whose audit logs you want to forward to the syslog server.
From the User drop-down list, select the users such as, CS Admin etc., whose audit logs you want to forward to the syslog server.
From the Operation drop-down list, select the operations such as Create, UpdateConfig, Delete, etc., whose audit logs you want to forward to the syslog server.
From the Playbooks drop-down list, select the operations such as Generate Incident Summary Report, Playbook Execution History Cleanup, etc., whose audit logs you want to forward to the syslog server.
To add more rules, click the Define More Rules link.
Important: If you do not define rules, then all the audit logs will be forwarded.
- Once you have completed configuring syslog forwarding, click Save.
FortiSOAR performs validations such as, whether the syslog server is reachable on the specified port etc. before adding the syslog server.
Once the syslog server is added, you can update or remove the configuration as per your requirements.
Persisting the FortiSOAR logs
If your external log management server goes down, then the FortiSOAR logs generated during that time period will not be sent by FortiSOAR to your syslog server. If you want to persist the logs for the time frame when external log management server is down and send those logs when server comes back online, you need to do the following:
In the /etc/rsyslog.d/00-rsyslog-fortisoar-settings.conf file, add the following contents after the #### add the server details after this #### line:
#### add the server details after this ####
$ActionQueueType LinkedList
$WorkDirectory /home/csadmin/.offline-rsyslogs/
#
# for the workdir mentioned above, make sure you run
# chown -R -t syslogd_var_lib_t /home/csadmin/.offline-rsyslogs/
#
$ActionQueueMaxDiskSpace 1gb # 1gb space limit (You can change this value)
$ActionQueueFileName fortisoar-offline-rsyslog
$ActionResumeRetryCount -1
$ActionQueueSaveOnShutdown on
Next, run the following commands:mkdir -p /home/csadmin/.offline-rsyslogs/chcon -R -t syslogd_var_lib_t /home/csadmin/.offline-rsyslogs/systemctl restart rsyslog
Environment Variables
You can use the Environment Variables tab on the System Configuration page to configure proxy settings for FortiSOAR and to define any other environment variables.
The procedure of how to configure proxy settings and define environment variables is included in the Configuring Proxy Settings and environment variables section in the Additional configuration settings for FortiSOAR chapter of the "Deployment Guide".

|
|
External web pages that you open (for example, from a link included in the description field of an alert) or view (for example, using the iFrame Widget) in FortiSOAR goes through the configured proxy server if you have configured the proxy in the web browser's settings. If the proxy is not configured in the web browser's settings, then the external web pages are opened directly without using the configured proxy server. |
Branding
You can customize branding of FortiSOAR as per your requirement. From version 6.4.0 onwards, branding is not bound based on licensing, i.e., all customers can customize FortiSOAR branding as per their requirements.
To customize your branding in FortiSOAR, you must have a role which has a minimum of Application Update permission and then can do any or all of the following branding changes:

-
Changing Logos: You can update the FortiSOAR logo to reflect your logo in the FortiSOAR UI. However, note that the maximum size for a logo is 1 MB.
Update your logo in theLogo Settingssection:
Brand Logo (Small) - Dark Theme and Brand Logo (Large) - Dark Theme: Click the FortiSOAR logos and browse to the logos that you want to display in FortiSOAR Dark or Steel theme in two sizes: Small (90px X 72px) and Large (210px X 24px).
Brand Logo (Small) - Light Theme and Brand Logo (Large) - Light Theme: Click the FortiSOAR logos and browse to the logos that you want to display in FortiSOAR Light theme in two sizes: Small (90px X 72px) and Large (210px X 24px).
Note: You can hover on the information icon to view where these logos will appear in FortiSOAR. -
Changing the Favicon: To change the favicon that is displayed in FortiSOAR, click the FortiSOAR favicon and browse to the icon that you want to display as a favicon.
Note: You can hover on the information icon to view where this favicon will appear in FortiSOAR.
- Editing the Product Name: To change the name of the product displayed in the FortiSOAR UI, in the Product Name field, enter the name of the product that you want to display in the UI.
- Editing the Company Name: To change the name of the company displayed in the FortiSOAR UI, in the Company Name field, enter the name of the company that you want to display in the UI.
-
Editing the Login Tagline: To change the customized messages or taglines that appears to all users on their login screen, you can deselect the default tagline(s) by clicking the red cross that appears beside the tag line. The tagline that you deselect will not appear on the login page.
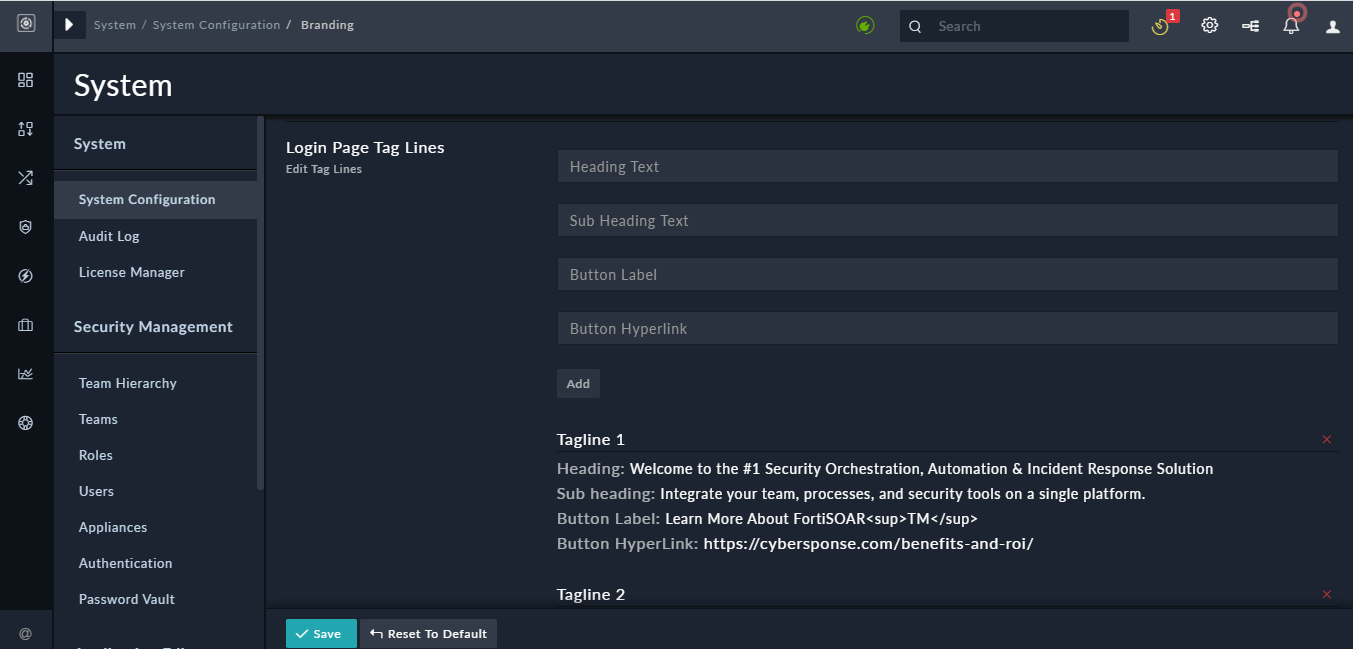
You can then add your own tag line in theLogin Page Tag Linessection as follows:
In the Heading Text field: Enter the heading for your tagline.
In the Sub Heading Text field: Enter the sub-heading for your tagline.
In the Button Label and Button Hyperlink fields: If you want to add a button on your login page, which on clicking by the user, navigates the user to another web page, then enter the label of the button and the URL of the other web page in the Button Label and Button Hyperlink fields respectively.
Once you complete adding your tag line, click Add.
To save your branding updates, click Save, to reset the branding to its default, click Reset to Default.
System Fixtures
The FortiSOAR UI includes links in the System Configuration page to the various playbook collections and templates, which are included by default when you install your FortiSOAR instance. Click the System Fixtures tab on the System Configuration page to view the links to the system playbook collections and templates. Administrators can click these links to easily access all the system fixtures to understand their workings and make changes in them if required. In the previous versions, administrators required to know the complete URL for these fixtures to access them and make required changes.

The following fixtures are included:
Playbooks:
- System Playbook collection (System Notification and Escalation Playbooks collection): Includes a collection of system-level playbooks that are used to automate tasks, such as the
Escalateplaybook which is used to escalate an alert to an incident based on specific inputs from the user and linking the alert(s) to the newly created incident. - Approval/Manual Task Playbooks collection: Includes a collection of system-level playbooks that are used to automate approvals and manual task, such as the playbook that will be triggered when an approval action is requested from a playbook.
- SLA Management Playbooks collection: Includes a collection of system-level playbooks that are used to auto-populate date fields in the following cases: when the status of incident or alert records have been changed to Resolved or Closed or when incident or alert records are assigned to a user.
- Schedule Management Playbooks collection: Includes a collection of system-level playbooks that are used for the scheduler module and used for various scheduler actions such as scheduling playbook execution history cleanup, audit log cleanup, etc.
- Report Management Playbooks collection: Includes a collection of system-level playbooks that are used to manage generation of FortiSOAR Reports.
- Utilities Playbook collection: Includes a collection of system-level playbooks that are used by system utilities.
- Data Ingestion Playbooks collection: Includes a collection of data ingestion playbooks for all the connectors that are enabled for data ingestion. This has been deprecated.
For more information on system-level playbooks, see the Introduction to Playbooks chapter in the "Playbooks Guide."
Email Templates
- Password Reset Token: Includes an email template that is sent to FortiSOAR users' who forget their password and click on the Forgot Password link, so that they can reset their password. This email contains a link that the user can use to create their new password.
- Send Email To New User: Includes an email template that is sent to a new FortiSOAR users' and it contains a link that the new user can use to create their own new password.
- Send Email For Password Change: Includes an email template that is sent when a user requests for a change in their FortiSOAR password.
- Send Email For Reset Password By Admin: Includes an email template that is sent to FortiSOAR users' whose password has been reset by an administrator.
To modify the content of the email templates, click the email template whose content you want to change, for example, click Password Reset Token to open the email template. Click the Edit Record button to edit the contents of the template. You can also click the Edit Template icon to edit the structure of the email or click Actions to perform actions on the record.

To change the content of the email, click the Edit icon, or click the Edit Record to open the email template in a "form" format in which you can change the contents of the email as per your requirement, and then click Save to save your changes.

In case you have deleted the email templates, and you require to update or modify the default email templates, then you require to edit the mailtemplate.yml file located at /opt/cyops/configs/cyops-api/.
Audit Log
You can view the historical record of activities across FortiSOAR using the Audit Log, the User-Specific Audit Logs, and the graphical representation of the Audit Log in the detail view of a record.
Audit Log Permissions
- To view your own audit logs, you must have a role with a minimum of
Readpermission on theAudit Log Activitiesmodule. To view audit logs of all users, you must have a role with a minimum ofReadpermission on theSecurityandAudit Log Activitiesmodules. - To delete your own audit logs, you must have a role with a minimum of
Deletepermission on theAudit Log Activitiesmodule. To delete audit logs of all users, you must have a role with a minimum ofDeletepermission on theSecurityandAudit Log Activitiesmodules.
Note: TheDeletepermission on theAudit Log Activitiesmodule will be removed for bothcsadminand playbook appliances roles, and also this will not be enabled (checked) by default for the Full App Permissions role. Therefore, if you want any user or role to have the right to delete audit logs, you must explicitly assign theDeletepermission on theAudit Log Activitiesmodule to that particular user or role.
If you cannot access the Audit Log, you must ask your administrator for access. FortiSOAR displays an error, as shown in the following image, if you do not have access to Audit Logs:

You can view historical record of activities across FortiSOAR using the following options:
-
Audit Log: Audit Log displays a chronological list of all the actions across all the modules of FortiSOAR. Click Settings > Audit Log to open the
Audit Logpage. - User-Specific Audit Logs: User-Specific Audit Logs displays a chronological list of all the actions across all the modules of FortiSOAR for a particular user.
-
Viewing Audit Log in the detailed view of a record: You can view a graphical presentation, or grid view, of all the actions performed on that particular record. The audit log is displayed in a graphical format using the
Timelinewidget.
Audit Logs include data such as, recording the name of the user who had deleted the record, linking and delinking events, picklist events, and model metadata events (including changes made in model metadata during the staging phrase). Free text search, additional filtering criteria, the ability to quickly add auditing for a new service and lazy loading has also been implemented in audit logs.
Audit logs also contain operations related to playbooks such as trigger, update, terminate, resume, create and delete playbook versions, etc. From version 6.4.1 onwards, the operations such as Snapshot Created and Snapshot Deleted operations are renamed to Version Created and Version Deleted since snapshots have been renamed to versions. However, for older audit logs in cases of an upgrade, you will see the old audit log entries with the older names such as Snapshot Created or Snapshot Deleted.
The data included in the audit log also contain the following types of entries:
- Users' login success or failures and logout events. The login event includes all three supported login types, which are DB Login, LDAP Login, and SSO Login.
- Users' login with an invalid username.
- Locked users's attempts to log on to FortiSOAR.
- Inactive users's attempts to log on to FortiSOAR.
- Forced log out events by an administrator using the UI (new in version 7.0.1)
- Forced log out events by an administrator using the CLI (new in version 7.0.1)
- Change in user's access type, i.e., Named to Concurrent, or vice-versa, by an administrator (new in version 7.0.1)
|
|
|
You can purge Audit Logs using the Purge Logs button on the top-right of the Audit Log page. You will see the Purge Logs button only if you have Delete permissions on the Audit Log Activities module.

You can also use the Audit Log Purge API to purge audit logs on an automated as well as an on-demand basis. For more information, see the API Methods chapter in the "API Guide."
Viewing Audit Log
Use the Audit Log to view a chronological list of all the actions across all the modules of FortiSOAR. To view the Audit Log page, you must have access to the Audit Log Activities module. Click Settings > Audit Log to open the Audit Log page. The audit log also displays users' login success or failures and logout events. The login event includes all three supported login types, which are DB Login, LDAP Login, and SSO Login.

You can filter the audit logs to display the audit logs for a particular record type by selecting the record type (module) from the Record Type drop-down list. You can also filter audit logs on users, operations, and data range, apart from modules.
To filter audit logs on for a particular user, select the user from the Select User drop-down list.
To filter audit logs on for a particular operation, select the operation from the Select Operation drop-down list. You can choose from the operations such as, Comment, Create, Delete, Link, Login Failed, Snapshot Created, Trigger, Unlink, Update, etc.
You can also filter audit logs for a particular date range by selecting the From Date and To Date using the calendar icon.
You can also search for audit logs using free text search. Click the Search icon and enter a search criterion in the Search Logs field to search the audit logs.
The Audit Log displays the following historical information for each record:
-
Title: Title of the record on which the action was performed.
Note: In case of Approval playbooks the playbook audit log displays the Approval Description field, which represents the name of the approval record, in the Title field. In this case, the Title field will be displayed in the formatApproval [Approval Description] Operation Performed. For example,Approval [Approval Test] Created. -
Record Type: Type (module) of the record on which the action was performed. -
Operation: Operation that was performed. -
User: User who performed the operation -
Source: Source IP address where the operation that was performed. -
Transaction date: Date and time that the record was updated in the formatDD/MM/YYYY HH:MM.
To view the details of an audit log entry, click the expand icon (>) in the audit entry row. Details in the audit log entry are present in the JSON format, and include the old data and updated (new) data for a record, in case of an update operation, and all attributes and their details, such as ID and type, for a record, in case of a create operation. You can copy the data using the Copy to Clipboard button.

You can perform the following operations on the Audit Log page, by clicking the More Options icon ( ) to the right of the table header:
-
Export All Columns As CSV: Use this option to export all the columns of the audit log to a
.csvfile. -
Export Visible Columns As CSV: Use this option to export visible columns of the audit log to a
.csvfile.
Note: You can hide columns by deselecting a column from the list of columns present within the More Options menu. The hidden columns appear with a red cross.
-
Export Visible Columns As PDF: Use this option to export visible columns of the audit log to a
.pdffile. - Reset Columns To Default: Use this option to reset the audit log fields to the default fields specified for the audit log.
You can view logs specific to a particular module, by clicking Settings > Modules (in the Application Editor section) and from the Select a module to edit or create new module drop-down list, select the module whose audit log you want to view, and then click the Audit Logs button.

You view the same details and perform the same actions as mentioned earlier on the Audit Logs Dialog. You can filter the audit logs for modules on users, operations, and date range. For example, you can filter logs which have an Create operation performed on a particular record type (module), as shown in the following image:

Similarly, you can also view logs specific to a particular picklist, go to Settings > Picklists (in the Application Editor section). From the Select a picklist or edit or create a new picklist drop-down list select the picklist whose audit log you want to view and click the Audit Logs button. You view the same details and perform the same actions as mentioned earlier on the Audit Logs Dialog. You can filter the audit logs for picklists on users, operations, and date range.
Audit logs also include the auditing of the following actions so that you can get comprehensive records of all activities across FortiSOAR :
- Schedule actions - Create, update and delete, start, and stop
- Rules actions - Create, update, delete, activate, and deactivate
- Dashboard/Report actions - Create, update, and delete
- Navigation actions - All
- License Update actions - All
- SVT Update actions - All
- Role - Modification (Create and Delete already gets audited)
- Team - Modification (including team hierarchy updates), User Link/Unlink (Create and Delete already gets audited)
From version 7.0.0 onwards, the following fields have been added to audit and system logs to provide more information about your FortiSOAR system and to help FortiAnalyzer (FAZ) integration:
- vd(enterprise|master|tenant) - The value of this field is "enterprise" for an enterprise setup, "master" for the master node in a multi-tenant setup, and "tenant" for the tenant node in a multi-tenant setup.
-
level(emerg|alert|crit|err|warning|notice|info|debug) - The severity level of the event.
Note that the following audit operations will be considered as 'warning' severity operations: Delete, Unlink, Terminate, Version Deleted, Uninstall, DeleteConfig, Deactivate and Replication Failed. All other audit operations are considered as 'info' severity.
- devid - FortiSOAR's SNO, i.e., the same serial number from the license file.
- datetime - Event timestamp in the 'epoch' format. This is applicable only for audit logs.
-
type(AuditLog|System Log) - The Log type.
Sample Audit log:2021-02-19T06:17:24.958779+00:00 fsrprimary fortisoar-audit-log: CEF:0|Fortinet Inc|FortiSOAR|7.0.0|Alert Deleted|Alert Deleted|1|devid="FSRVMPTM20000061" vd="enterprise" level="warning" type="Audit Log" msg="Alert [1] Deleted " src="192.168.56.1" suid="3451141c-bac6-467c-8d72-85e0fab569ce" suser="CS Admin" end=1613634028029 playbookName="" playbookId="" eventTimeStr="18 Feb 2021 07:40:28.029"
Viewing User-Specific Audit Logs
Use the User-Specific Audit Logs to view the chronological list of all the actions across all the modules of FortiSOAR for a particular user. Users can view their own audit logs by clicking the User Profile icon and selecting the Edit Profile option and clicking the Audit Logs panel. Administrators who have a minimum of Read access on the Audit Log Activities module along with access to the People module, which allows them to access a user's profile, can view User Specific Audit Logs. The user-specific audit log also displays user's login success or failures and logout events. The login event includes all three supported login types, which are DB Login, LDAP Login, and SSO Login.

Use the same filtering and searching techniques mentioned in the Viewing Audit Log section. You can filter the user-specific audit logs on record types (modules) and date range.
The user-specific audit logs display the same information as the audit log, and you can also perform the same actions here as you can perform in case of audit logs. For more information, see the Viewing Audit Log section.
Viewing Audit Log in the detailed view of a record
Use the Audit Log tab, which is present in the detail view of a record, to view the graphical presentation of all the actions performed on that particular record. The Audit Log tab uses the Timeline widget to display the graphical representation of the details of the record. You cannot edit the Timeline widget. For more information about widgets, see the Using Template Widgets topic in the "User Guide."
You can toggle the view in the Audit Log tab to view the details in both the grid view and the timeline (graphical) view. Use the same filtering and searching techniques mentioned in the Viewing Audit Log section. You can filter the user-specific audit logs on record types and date range.
Click a record within a module to open the detail view of a record and then click the Audit Log tab to view the graphical representation, or grid view of the details of the record, as shown in the following image:

A timeline item mentions the action performed on the record, such as Created, Updated, Commented, Attached, or Linked, the name of the person who has made the update, and the date and time that the update was made.
|
|
In the timeline, you might see some records created by |
When you update any detail in a record, then you can click the refresh button in the timeline to view the updates in timeline immediately. To view the complete details of the updates made at a particular timeline item, click the arrow (>) present to the right of the item. The following image displays the details shown for a specific timeline item:

You can toggle between the expanded and collapsed view of the audit log tab, using the Full-screen Mode icon. To move to a full screen view of the audit log, click the Full-screen Mode icon, which opens the audit log in the full screen as shown in the following image:

To exit the full screen, press ESC.
You can toggle between the timeline view and grid view in the Audit Log tab. The grid view in the detailed view of a record appears as shown in the following image:

The grid view also displays the same information as the audit log, and you can also perform the same operations here as you can perform in case of audit logs. For more information, see the Viewing Audit Log section.
Purging Audit Logs
You can purge Audit Logs using the Purge Logs button on the top-right of the Audit Log page. Purging audit logs allows you to permanently delete old audit logs that you do not require and frees up space on your FortiSOAR instance. You can also schedule purging, on a global level, for both audit logs and executed playbook logs. For information on scheduling Audit Logs and Executed Playbook Logs, see Scheduling purging of audit logs and executed playbook logs.
To purge Audit Logs, you must be assigned a role that has a minimum of Read permission on the Security module and Delete permissions on the Audit Log Activies module.
To purge Audit Logs, click the Purge Logs button on the Audit Log page, which displays the Purge Audit Logs dialog:

In the Purge all logs before, field, select the time frame (using the calendar widget) before which you want to clear all the audit logs. For example, if you want to clear all audit logs before January 1st, 2019, 12:00 AM, then select this date and time using the calendar widget.

By default, logs of all events are purged. However, you can control the event types that will be chosen for purging. For example, if you do not want to purge events of type "Login Failure" and "Trigger", then you must clear the Login Failure and Trigger checkboxes, as shown in the following image:

To purge the logs, click the Purge Logs button, which displays a warning as shown in the following image:

Click the I Have Read the warning - Purge Logs to continue the purging process.
License Manager
FortiSOAR enforces licensing using the License Manager. The License Manager restricts the usage of FortiSOAR by specifying the following:
- The maximum number of active named users in FortiSOAR at any point in time.
- The type and edition of the license.
- The expiry date of the license.
For details of the FortiSOAR licensing process, including deploying your FortiSOAR license for the first time, see the Licensing FortiSOAR chapter in the "Deployment Guide."
Click Settings > License Manager to open the License Manager page as shown in the following image:

You can use the License Manager page to view your license details and to update your license. FortiSOAR displays a message about the expiration of your license 15 days prior to the date your license is going to expire. If you license type is Evaluation or Perpetual, then you must update your license within 15 days, if you want to keep using FortiSOAR. To update your license, click Update License and either drag-and-drop your updated license or click and browse to the location where your license file is located, then select the file and click Open. If your license type is Subscription, you must renew your subscription.
For more information on licensing and for details about the various parameters on the License Manager page, see the Licensing FortiSOAR chapter in the "Deployment Guide."