


Microsoft SQL Server
Support Added: FortiSIEM 4.7.2
Last Modification: FortiSIEM 6.3.1
Supported Versions:
-
SQL Server 2014
-
SQL Server 2016
-
SQL Server 2017
-
SQL Server 2019
-
SQL Server 2022
Vendor: Microsoft
Product Information: https://www.microsoft.com/en-us/sql-server/
What is Discovered and Monitored
The following protocols are used to discover and monitor various aspects of Microsoft SQL server.
| Protocol | Information discovered | Metrics collected | Used for |
|---|---|---|---|
| SNMP | Application type | Process level CPU and memory utilization | Performance Monitoring |
| WMI | Application type, service mappings | Process level metrics: uptime, CPU utilization, Memory utilization, Read I/O KBytes/sec, Write I/O KBytes/sec | Performance Monitoring |
| WMI | Windows application event logs - successful and failed login | Security Monitoring | |
| JDBC | General database info: database name, database version, database size, database owner, database created date, database status, database compatibility level Database configuration Info: Configure name, Configure value, Configure max and min value, Configure running value Database backup Info: Database name, Last backup date, Days since last backup |
Availability Monitoring | |
| JDBC | Database performance metrics (per-instance): Buffer cache hit ratio, Log cache hit ratio, Transactions /sec, Page reads/sec, Page writes/sec, Page splits/sec, Full scans/sec, Deadlocks/sec, Log flush waits/sec, Latch waits/sec, Data file(s) size, Log file(s) used, Log growths, Log shrinks, User connections, Target server memory, Total Server Memory, Active database users, Logged-in database users, Available buffer pool pages, Free buffer pool pages, Average wait time Database performance metrics (per-instance, per-database): Database name, Data file size, Log file used, Log growths, Log shrinks, Log flush waits/sec, Transaction /sec, Log cache hit ratio |
Performance Monitoring | |
| JDBC | Locking info: Database id, Database object id, Lock type, Locked resource, Lock mode, Lock status Blocking info: Blocked Sp Id, Blocked Login User, Blocked Database, Blocked Command, Blocked Process Name, Blocking Sp Id, Blocking Login User, Blocking Database, Blocking Command, Blocking Process Name, Blocked duration |
Performance Monitoring | |
| JDBC | Database error log
Database audit trail:Failed database logon is also collected through performance monitoring as logon failures cannot be collected via database triggers. |
Availability / Performance Monitoring | |
| JDBC | None | Database audit trail: Successful and failed database logon, Various database operation audit trail including CREATE/ALTER/DROP/TRUNCATE operations on tables, table spaces, databases, clusters, users, roles, views, table indices, triggers etc | Security Monitoring and compliance |
Recommended Configuration
-
SNMP or WMI for discovery and system level performance metrics
-
FortiSIEM Windows Agent for Database Audit logs – Note that these logs can also be pulled via WMI, however performance is limited because of WMI limitations.
-
JDBC for Database Performance metrics
-
JDBC for DDL changes
SNMP Configuration
See SNMP Configurations in the Microsoft Windows Server Configuration section.
WMI Configuration
See WMI Configurations in the Microsoft Windows Server Configuration section.
Configuration for Database Audit Logs
Database Audit logs include failed and successful logons and other C2 audit activity. These logs are written to the Windows Application logs.
Configuration occurs in two parts.
SQL Server Configuration
Step 1: Configure Login Auditing using SQL Server Management studio
Take the following steps to configure Login Auditing.
-
In SQL Server Management Studio, connect to an instance of the SQL Server Database Engine with Object Explorer.
-
In Object Explorer, right-click the server name, and then click Properties.
-
On the Security page, under Login auditing, select the desired option
-
On the Security page, under Options, click on the Enable C2 audit tracing check box and close the Server Properties page.
-
In Object Explorer, right-click the server name, and then click Restart.

Note: You must restart the SQL Server before this option will take effect.
Step 2: Enabling SQL Server Audit
Create a Server-level audit object by taking the following steps:
-
In SQL Server Management Studio, connect to an instance of the SQL Server Database Engine with Object Explorer.
-
In the Object Explorer panel on the left, expand Security.
-
Right-click Audits, and select New Audit… from the menu. This will create a new SQL Server Audit object for server-level auditing.

-
In the Create Audit window, give the audit settings a name in the Audit name field.
-
For On Audit Log Failure, select the Continue option.
-
For Audit destination, select Application Log from the drop-down list.

-
Click OK.
-
You will now find the new audit configuration in Object Explorer below Security > Audits. Right-click the new Audit configuration and select Enable Audit from the menu.

-
Click Close in the Enable Audit dialog.
FortiSIEM Configuration
Step1: Define the Windows Agent Monitor Template for SQL Server
Complete these steps to add a Windows Agent Monitor Template:
-
Navigate to ADMIN > Setup and click the Windows Agent tab.
-
Under Windows Agent Monitor Templates click New.
-
In the Windows Agent Monitor Template dialog box, in the Name field, enter a name.
-
Click on Event tab, and take following steps:
-
In the Event Log row, click New.
-
From the Type drop-down list, select Security and click Save.
-
In the Event Log row, click New again.
-
From the Type drop-down list, select Application.
-
From the Source drop-down list, select SQL Server.
-
Click Save.

-
Step 2: Associate Windows Agents to Templates
Complete these steps to associate a Host to Template:
-
Under Host To Template Associations, click New.
-
In the Host To Template Associations dialog box, enter the following information.
Settings
Guidelines
Name Name of the Host to Template Association. Organization Select the organization. Host Use the drop-down list to browse the folders and select the Devices or/and Business Services to monitor and click Save. Template Select one or more monitoring templates from the list, or select All Templates to include all. You can also use the serarch bar to find any specific template. Collector Select the Collector from the list or select All Collectors to include all. Agents forward events to Collectors via HTTP(S). A Collector is chosen at random and if that Collector is not available or non-responive, then another Collector in the list is chosen. -
Associate the recently added SQL Server template to SQL server host.
-
Click Save and Apply.
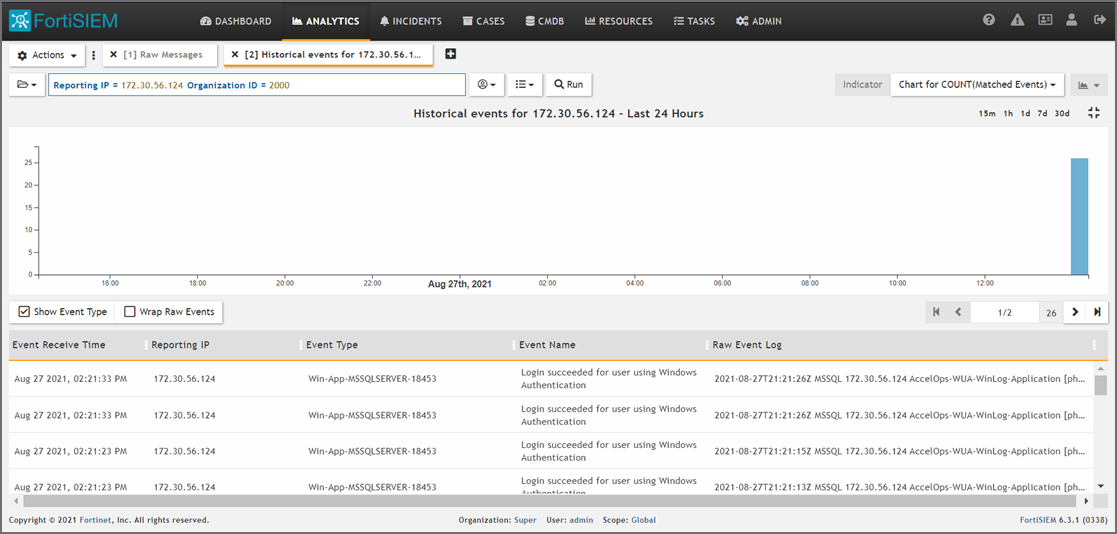
Step 3: Check Events via Analytics
JDBC Configuration for Database Performance Metrics
FortiSIEM can pull SQL Server performance metrics via JDBC.
Configuration occurs in two parts.
SQL Server Configuration
Step 1: Create a Read-Only User for SQL Server Monitoring
A regular Windows account cannot be used for SQL Server monitoring. FortiSIEM runs on Linux and certain Windows libraries needed for SQL Server monitoring are not available on Linux. You have to create a separate user with read-only privileges.
-
Log in to your SQL Server with sa account, and then create a read-only user to access system tables.
EXEC SP_ADDLOGIN 'AOPerfLogin','ProspectHills!','master';
EXEC SP_ADDROLE 'AOPerfRole';
EXEC SP_ADDUSER 'AOPerfLogin', 'AOPerfUser', 'AOPerfRole';
GRANT VIEW SERVER STATE TO AOPerfLogin;
GRANT SELECT ON dbo.sysperfinfo TO AOPerfRole;
GRANT EXEC on xp_readerrorlog to AOPerfRole;
-
Log in with your newly created read-only account (AOPerfLogin) and run these commands.
SP_WHO2 'active';
SELECT * FROM sys.databases; SELECT * FROM dbo.sysperfinfo;
SELECT COUNT(*) as count FROM sysprocesses GROUP BY loginame;
Check to see if you get the same results with your read-only account (AOPerfLogin) as you do with your sa account. You should get the same results.
Step 2: Changing Authentication mode to SQL Server and Windows Authentication Mode
It is common practice to enable SQL Server and Windows Authentication mode before accessing read-only user. To enable this mode, take the following steps:
-
In SQL Server Management Studio Object Explorer, right click the server, then click Properties.
-
On the Security page, under Sever authentication, select SQL Server and Windows Authentication mode.

-
Click OK.
-
In the SQL Server Management Studio dialog box, click OK to acknowledge the requirement to restart the SQL Server.
-
In Object Explorer, right click your server, and then click Restart. If the SQL Server Agent is running, it must also be restarted.
FortiSIEM Configuration
Settings for SQL Server JDBC Access Credentials for Performance Monitoring
Use these Access Method Definition settings to allow FortiSIEM to communicate with your SQL Server over JDBC for performance monitoring:
Step 1: Create a Separate Credential for Each Database Instance
If multiple database instances are running on the same server, then each instance must run on a separate port, and you must create a separate access credential for each instance. You must also remember to associate each instance with the server's IP number for the Device Credential Mapping Definition.
Take the following steps:
-
Go to the ADMIN > Setup > Credentials tab.
-
In Step 1: Enter Credentials, click New to create a new credential.
-
Follow the instructions in “Setting Credentials“ in the User's Guide to create a new credential.
-
Enter these settings in the Access Method Definition dialog box and click Save when done:
-
Setting Value Name The name of the database instance you're creating the credential for. Access Protocol JDBC Used For Performance Monitoring Pull Interval (minutes) 5 Port 1433 Database Name <leave this field blank> User Name The user you created in step 1 of the JDBC configuration. Password The password associated with the user you created in step 1. 
-
-
-
In Step 2: Enter IP Range to Credential Associations, click New to create a new mapping.
-
Select the name of your credential from the Credentials drop-down list.
-
In the IP/Host Name field, enter a host name, an IP, or an IP range.
-
Click Save.
-
-
Click the Test drop-down list and select Test Connectivity to test the connection to the Microsoft SQL Server.
-
To discover the device, take the following steps:
-
Navigate to ADMIN > Setup > Discovery.
-
Create a Discovery entry using the information here. For more information on how to create a discovery entry, see here.
Setting Value Name The name of the device to discover Discovery Type Leave as default (Range Scan). Include Provide the IP address of the device you want discovered. -
Click Save when done.

-
-
Select the discovery entry you created and click Discover.
-
After Discovery is completed, navigate to ADMIN > Setup > Monitor Performance to check the monitor performance job.

-
Click on the More drop-down list and select Report to check related events.

JDBC Configuration for DDL Changes
FortiSIEM can pull SQL Server Data Definition Language (DDL) changes via JDBC. These changes include CREATE, ALTER, DROP, GRANT, DENY, REVOKE or UPDATE STATISTICS operations on database tables. This information is not naturally generated by a SQL Server. Hence, this involves creating database tables to store them and then creating triggers to populate those tables. Then FortiSIEM can pull them via JDBC.
Configuration occurs in two parts.
SQL Server Configuration
-
Save the SQL Server script (provided – link here) as separate file to My Documents > SQL Server Management Studio > SQLServer_DDL_Events.sql.
-
Login to SQL Server Management Studio with sa account.
-
Browse to and execute the SQLServer_DDL_Events.sql script to create the database, tables and trigger events.
Creating a Database Truncate Script
Since DDL tables grow after time, it is often a good idea to create a database truncate script that can run as a maintenance task and keep the table size under control. it is often necessary to create a database truncate procedure as follows.
-
Log into Microsoft SQL Management Studio and connect to the DB instance.
-
Under Management, go to Maintenance Plans, and create a new plan with the name RemoveOldLogs.
-
For Subplan, enter TRUNCATE, and for Description, enter TRUNCATE TABLE.
-
Click the Calendar icon to create a recurring, daily task starting at 12:00AM and running every 30 minutes until 11:59:59PM.
-
Go to View > Tool Box > Execute T-SQL Statement. A T-SQL box will be added to the subplan.
-
In the T-SQL box, enter this command
use PH_Events;
EXEC sp_MSForEachTable 'TRUNCATE TABLE DDLEvents'; -
Click OK.
You will be able to see the history of this script's actions by right-clicking on the maintenance task, and then selecting View History.
FortiSIEM Configuration
Settings for SQL Server JDBC Access Ccredentials for DDL Events Collection
Use these Access Method Definition settings to allow FortiSIEM to communicate with your SQL Server database instance over JDBC for database DDL events collection.
Step 1: Create a Separate Credential for Each Database Instance
If multiple database instances are running on the same server, then each instance must run on a separate port, and you must create a separate access credential for each instance. You must also remember to associate each instance with the server's IP number for the Device Credential Mapping Definition.
Take the following steps:
-
Go to the ADMIN > Setup > Credentials tab.
-
In Step 1: Enter Credentials, click New to create a new credential.
-
Follow the instructions in “Setting Credentials“ in the User's Guide to create a new credential.
-
Enter these settings in the Access Method Definition dialog box, and click Save when done:
Setting
Value
Name The name of the database instance you are creating the credential for Device Type Microsoft SQL Server Used For Audit Pull Interval (minutes) 5 Port 1433 Database Name <leave this field blank> Logon Event Table PH_Events.dbo.LogOnEvents DDL Event Table PH_Events.dbo.DDLEvents User Name The user you created in step 1 of the JDBC configuration Password The password associated with the user you created in step 1. 
-
-
In Step 2: Enter IP Range to Credential Associations, click New to create a new mapping.
-
Select the name of your credential from the Credentials drop-down list.
-
In the IP/Host Name field, enter a host name, an IP, or an IP range.
-
Click Save.
-
-
Click the Test drop-down list and select Test Connectivity to test the connection to the Microsoft SQL Server.
-
To discover the device, take the following steps:
-
Navigate to ADMIN > Setup > Discovery.
-
Create a Discovery entry using the information here. For more information on how to create a discovery entry, see here.
Setting Value Name The name of the device to discover Discovery Type Leave as default (Range Scan). Include Provide the IP address of the device you want discovered. -
Click Save when done.
-
-
Select the discovery entry you created and click Discover.
-
After Discovery is completed, navigate to ADMIN > Setup > Pull Events to check the pull events job.

-
Click on Report to check related events.

Sample Events
Per Instance Performance Metrics
<134>Apr 16 10:17:56 172.16.22.100 java: [PH_DEV_MON_PERF_MSSQL_SYS|PH_DEV_MON_PERF_MSSQL_SYS]:[eventSeverity]=PHL_INFO,[hostIpAddr]=172.16.22.100,[hostName]=wwwin.accelops.net,
[appGroupName]=Microsoft SQL Server,[dbDataFileSizeKB]=13149056,[dbLogFileUsedKB]=26326,[dbLogGrowthCount]=4,[dbLogShrinkCount]=0,[dbLogFlushPerSec]=1.69,[dbTransPerSec]=4.44,
[dbDeadLocksPerSec]=0,[dbLogCacheHitRatio]=60.01,[dbUserConn]=16,[dbTargetServerMemoryKB]=1543232,[dbTotalServerMemoryKB]=1464760,[dbPageSplitsPerSec]=0.45,
[dbPageWritesPerSec]=0.01,[dbLatchWaitsPerSec]=0.77,[dbPageReadsPerSec]=0.01,[dbFullScansPerSec]=1.83,[dbBufferCacheHitRatio]=100,[dbCount]=8,[dbUserCount]=25,
[dbLoggedinUserCount]=2,[dbPagesInBufferPool]=116850,[dbPagesFreeInBufferPool]=2336,[dbAverageWaitTimeMs]=239376,
[appVersion]=Microsoft SQL Server 2008 R2 (RTM) - 10.50.1600.1 (X64),[serverName]=WIN-08-VCENTER,[instanceName]=MSSQLSERVER,[appPort]=1433
Per Instance, per Database Performance Metrics
[PH_DEV_MON_PERF_MSSQL_PERDB]:[eventSeverity]=PHL_INFO,[hostIpAddr]=172.16.22.100,[hostName]=wwwin.accelops.net,[dbName]=tempdb,[appGroupName]=Microsoft SQL Server,
[dbDataFileSizeKB]=109504,[dbLogFileUsedKB]=434,[dbLogGrowthCount]=4,[dbLogShrinkCount]=0,[dbTransPerSec]=0.96,[dbLogFlushPerSec]=0.01,[dbLogCacheHitRatio]=44.44,
[appVersion]=Microsoft SQL Server 2008 R2 (RTM) - 10.50.1600.1 (X64),[serverName]=WIN-08-VCENTER,[instanceName]=MSSQLSERVER,[appPort]=1433
Generic Info
[PH_DEV_MON_PERF_MSSQL_GEN_INFO]:[eventSeverity]=PHL_INFO,[dbName]= tempdb,[dbSize]= 3.0,[dbowner]= sa,[dbId]= 2,[dbcreated]= 1321545600,
[dbstatus]= Status=ONLINE; Updateability=READ_WRITE; UserAccess=MULTI_USER; Recovery=SIMPLE; Version=655; Collation=SQL_Latin1_General_CP1_CI_AS; SQLSortOrder=52; IsAutoCreateStatistics; IsAutoUpdateStatistics,
[dbcompatibilityLevel]= 100,[spaceAvailable]= 0.9,[appVersion]= Microsoft SQL Server 2008 (RTM) - 10.0.1600.22 (Intel X86),[serverName]= WIN03MSSQL\SQLEXPRESS
Config Info
[PH_DEV_MON_PERF_MSSQL_CONFIG_INFO]:[eventSeverity]=PHL_INFO,[configureName]= user instances enabled,[configMinimum]= 0,[configMaximum]= 1,[dbConfigValue]= 1,
[configRunValue]= 1,[appVersion]= Microsoft SQL Server 2008 (RTM) - 10.0.1600.22 (Intel X86),[serverName]= WIN03MSSQL\SQLEXPRESS
Locking Info
[PH_DEV_MON_PERF_MSSQL_LOCK_INFO]:[eventSeverity]=PHL_INFO,[dbId]= 4,[objId]= 1792725439,[lockType]= PAG,[lockedResource]= 1:1256,[lockMode]= IX,
[lockStatus]= GRANT,[appVersion]= Microsoft SQL Server 2008 (RTM) - 10.0.1600.22 (Intel X86),[serverName]= WIN03MSSQL\SQLEXPRESS
Blocking Info
[PH_DEV_MON_PERF_MSSQL_BLOCKBY_INFO]:[eventSeverity]=PHL_INFO,[blockedSpId]= 51,[blockedLoginUser]= WIN03MSSQL\Administrator,[blockedDbName]= msdb,
[blockedCommand]= UPDATE,[blockedProcessName]= Microsoft SQL Server Management Studio - Query,[blockingSpId]= 54,[blockingLoginUser]= WIN03MSSQL\Administrator,
[blockingDbName]= msdb,[blockingCommand]= AWAITING COMMAND,[blockingProcessName]= Microsoft SQL Server Management Studio - Query,[blockedDuration]= 5180936,
[appVersion]= Microsoft SQL Server 2008 (RTM) - 10.0.1600.22 (Intel X86),[serverName]= WIN03MSSQL\SQLEXPRESS
Error Log
[PH_DEV_MON_PERF_MSSQL_ERROR_LOG_INFO]:[eventSeverity]=PHL_INFO,[logDate]= 1321585903,[processInfo]= spid52,[logText]= Starting up database 'ReportServer$SQLEXPRESSTempDB'.,
[appVersion]= Microsoft SQL Server 2008 (RTM) - 10.0.1600.22 (Intel X86),[serverName]= WIN03MSSQL\SQLEXPRESS
Logon Events
134>Feb 08 02:55:34 10.1.2.54 java: [MSSQL_Logon_Success]:[eventSeverity]=PHL_INFO, [eventTime]=2014-02-08 02:54:00.977, [rptIp]=10.1.2.54, [relayIp]=10.1.2.54, [srcName]=<local machine>, [user]=NT SERVICE\ReportServer$MSSQLSERVEJIANFA, [srcApp]=Report Server, [instanceName]=MSSQLSERVEJIANFA, [procId]=52, [loginType]=Windows (NT) Login, [securityId]=AQYAAAAAAAVQAAAALJAZf5XMbcLh8PUDY31LioZ3Uwo=, [isPooled]=1, [destName]=WIN-S2EDLFIUPQK, [destPort]=1437,
DDL Events - Create Database
<134>Sep 29 15:34:48 10.1.2.54 java: [MSSQL_Create_database]:[eventSeverity]=PHL_INFO, [eventTime]=2013-09-29 15:34:05.687, [rptIp]=10.1.2.54, [relayIp]=10.1.2.54, [user]=WIN-S2EDLFIUPQK\Administrator, [dbName]=JIANFA, [instanceName]=MSSQLSERVER, [objName]=, [procId]=59, [command]=CREATE DATABASE JIANFA, [destName]=WIN-S2EDLFIUPQK, [destPort]=1433,
DDL Events - Create Index
<134>Sep 29 15:34:48 10.1.2.54 java: [MSSQL_Create_index]:[eventSeverity]=PHL_INFO, [eventTime]=2013-09-29 15:30:40.557, [rptIp]=10.1.2.54, [relayIp]=10.1.2.54, [user]=WIN-S2EDLFIUPQK\Administrator, [dbName]=master, [instanceName]=MSSQLSERVER, [objName]=IndexTest, [procId]=58, [command]=create index IndexTest on dbo.MSreplication_options(optname);, [schemaName]=dbo, [objType]=INDEX, [destName]=WIN-S2EDLFIUPQK, [destPort]=1433