


Connectivity Issues
One of your first tests when configuring a new device should be to determine whether video is being received from your camera, and whether commands/schedules are being sent to it. You should also test whether notification email can be sent, and accounts (administrators, operators, etc.) can log in to the web UI and view live video feeds.
After initial setup, connectivity should not be interrupted. FortiRecorder may sometimes be able to recover if, for example, a DHCP-addressed camera changes its IP. However this may result in disruptions to recording, and camera log messages such as:
Camera 'c1' experienced an interruption that may result in a loss of recording.
If connections fail or perform erratically, check the following in order:
- Checking hardware connections
- Bringing up network interfaces
- Examining the ARP table
- Checking routing
- Facilitating discovery
- DHCP issues
- Unauthorized DHCP clients or DHCP pool exhaustion
- Establishing IP sessions
- Resolving IP address conflicts
- Packet capture
|
|
Troubleshooting is in order from more fundamental OSI layers of your network to the higher, more application-specific. If you are not setting up a new network, you may prefer to start with the more FortiRecorder-specific layers of your network, later in this section. |
Checking hardware connections
If there is no traffic whatsoever arriving to the FortiRecorder appliance, even though the configuration appears to be correct, it may be a hardware problem.
- Verify that the LEDs for the ports light to indicate firm electrical contact when you plug network cables into the appliance. For LED indications, see your model’s QuickStart Guide.
- If the cable or its connector are loose or damaged, or you are unsure about the cable’s type or quality, change it or test with a loopback jack.
If traffic ingresses and egresses but performance is not what you expect, verify that the MTU matches other devices on your network.
If the hardware connections are functional and the appliance is powered on, but you cannot connect — even using a local console connection to the CLI rather then a network connection — you may be experiencing bootup problems. Contact Fortinet Technical Support.
Bringing up network interfaces
If the network interface was disabled, all connections will fail even though the cable has connectivity physically.
|
|
If the network interface’s Status column is a red “down” arrow, its administrative status is currently “down” and it will not receive or emit packets, even if you otherwise configure it. To bring up the network interface, edit the Administrative status setting. This Status column is not the detected physical link status; it is the administrative status that indicates whether you permit network interface to receive and/or transmit packets. For example, if the cable is physically unplugged, diagnose netlink interface list port1 may indicate that the link is down, even though you have administratively enabled it by Administrative status. By definition, HA heartbeat and synchronization links should always be “up.” Therefore, if you have configured FortiWeb to use a network interface for HA, its Status column will always display HA Member. |
In the web UI, go to System > Network > Interface. If the status is down (a down arrow on red circle), click Bring Up next to it in the Status column to bring up the link.
Alternatively you can enable an interface in CLI:
config system interface
edit port2
set status up
end
Examining the ARP table
When connectivity cannot be established or is periodically interrupted, but hardware and link status is not an issue, the first place to look is at a slightly higher layer in network connections: the address resolution protocol (ARP) table. While most devices’ MAC address is bound to the hardware at the manufacturer and not easily changed, some devices have configurable or virtual MACs. In this case, you should make sure there is no conflict which could cause the IP to resolve to a different network port whenever that other device is connected to your network.
Functioning ARP is especially important in high availability (HA) topologies. If changes in which MAC address resolves to which IP address are not correctly propagated through your network, failovers may not work.
To display the ARP table in the CLI, enter:
diagnose network arp list
Checking routing
If the MAC resolves correctly, but IP connectivity fails, try using ICMP (ping and traceroute) to determine if the host is reachable, or to locate the point on your network at which connectivity fails. You can do this from the FortiRecorder appliance using CLI commands.
IP layer connectivity fails when routes are incorrectly configured. Static routes direct traffic exiting the FortiRecorder appliance — you can specify through which network interface a packet will leave, and the IP address of a next-hop router that is reachable from that network interface. Routers are aware of which IP addresses are reachable through various network pathways, and can forward those packets along pathways capable of reaching the packets’ ultimate destinations. Your FortiRecorder itself does not need to know the full route, as long as the routers can pass along the packet.
You must configure FortiRecorder with at least one static route that points to a router, often a router that is the gateway to the Internet. You may need to configure multiple static routes if you have multiple gateway routers (e.g. each of which should receive packets destined for a different subset of IP addresses), redundant routers (e.g. redundant Internet/ISP links), or other special routing cases.
However, often you will only need to configure one route: a default route.
For example, if a web server is directly attached to one physical port on the FortiRecorder, but all other destinations, such as connecting clients, are located on distant networks, such as the Internet, you might need to add only one route: a default route that indicates the gateway router through which the FortiRecorder appliance can send traffic in the direction towards the Internet.
|
|
If your management computer is not directly attached to one of the physical ports of the FortiRecorder appliance, you may also require a static route so that your management computer is able to connect with the web UI and CLI. |
To determine which route a packet will be subject to, FortiRecorder examines each packet’s destination IP address and compares it to those of the static routes. It will forward the packet along to the route with the largest prefix match, automatically egressing from the network interface on that network. (Egress port for a route cannot be manually configured.) If multiple routes match the packet, the FortiRecorder appliance will apply the route with the smallest index number. For this reason, you should give more specific routes a smaller index number than the default route. CS: Verify. Based on FortiOS.
The ping command sends a small data packet to the destination and waits for a response. The response has a timer that may expire, indicating that the destination is unreachable via ICMP. ICMP is part of Layer 3 on the OSI Networking Model. ping sends Internet Control Message Protocol (ICMP) ECHO_REQUEST packets to the destination, and listens for ECHO_RESPONSE packets in reply. Beyond basic existence of a possible route between the source and destination, ping tells you the amount of packet loss (if any), how long it takes the packet to make the round trip (latency), and the variation in that time from packet to packet (jitter).
Similarly, traceroute sends ICMP packets to test each hop along the route. It sends three packets to the destination, and then increases the time to live (TTL) setting by one, and sends another three packets to the destination. As the TTL increases, packets go one hop farther along the route until they reach the destination.
Most traceroute commands display their maximum hop count — that is, the maximum number of steps it will take before declaring the destination unreachable — before they start tracing the route. The TTL setting may result in routers or firewalls along the route timing out due to high latency. If you specify the destination using a domain name, the traceroute output can also indicate DNS problems, such as an inability to connect to a DNS server.
By default, FortiRecorder appliances will respond to ping and traceroute. However, if FortiRecorder does not respond, and there are no firewall policies that block it, ICMP type 0 (ECHO_REPSPONSE or “pong”) might be effectively disabled. By default, traceroute uses UDP with destination ports numbered from 33434 to 33534. The traceroute utility usually has an option to specify use of ICMP ECHO_REQUEST (type 8) instead, as used by the Windows tracert utility. If you have a firewall and you want traceroute to work from both machines (Unix-like systems and Windows) you will need to allow both protocols inbound through your firewall (UDP ports 33434 - 33534 and ICMP type 8).
Some networks block ICMP packets because they can be used in a ping flood or denial of service (DoS) attack if the network does not have anti-DoS capabilities, or because ping can be used by an attacker to find potential targets on the network.
To enable ping & traceroute responses from FortiRecorder
- Go to System > Network > Interface. To access this part of the web UI, you must have Read and Write permission in your administrator's account access profile to items in the Router Configuration category.
- In the row for the network interface which you want to respond to ICMP type 8 (ECHO_REQUEST) for ping and UDP for traceroute, click Edit.
- Enable PING.

Disabling PING only prevents FortiRecorder from receiving ICMP type 8 (ECHO_REQUEST) or type 30 and traceroute-related UDP.
It does not disable FortiRecorder CLI commands such as execute ping or execute traceroute that send such traffic.
Since you typically use these tools only during troubleshooting, you can allow ICMP, the protocol used by these tools, on interfaces only when you need them. Otherwise, disable ICMP for improved security and performance
- Select OK. The appliance should now respond when another device such as your management computer sends a ping or traceroute to that network interface.
To verify routes between cameras & your FortiRecorder
- Use FortiRecorder’s execute ping command with the camera’s IP address to verify that a route exists between the two.
-
If possible, temporarily connect a computer at the camera’s usual physical location, using the camera’s usual IP address, so that you can use its ping command to test traffic movement along the path in both directions: from the location of the camera (temporarily, the computer) to the FortiRecorder, and the FortiRecorder to the camera.
notetable - text middled. Note bulb icon - text middled. Note bulb icon - text middled. Note bulb icon - text middled. Note bulb icon - text middled. Note bulb icon - text middled. Note bulb icon - text middled...
If the routing test succeeds, continue with step 4
Connectivity via ICMP only proves that a route exists. It does not prove that connectivity also exists via other protocols at other layers such as HTTP.
If ping shows some packet loss, investigate:
- cabling to eliminate loose connections
- ECMP, split horizon, or network loops
- dynamic routing such as OSPF
- all equipment between the ICMP source and destination to minimize hops
If the routing test fails, and ping shows total packet loss:
- verify cabling to eliminate loose connections
- continue to the next step

Both ping and traceroute require that network nodes respond to ICMP. If you have disabled responses to ICMP on your network, hosts may appear to be unreachable to ping and traceroute, even if connections using other protocols can succeed.
For example, you might use ping to determine that 172.16.1.10 is reachable:
FortiRecorder-200D# execute ping 172.16.1.10
PING 172.16.1.10 (172.16.1.10): 56 data bytes
64 bytes from 172.16.1.10: icmp_seq=0 ttl=64 time=2.4 ms
64 bytes from 172.16.1.10: icmp_seq=1 ttl=64 time=1.4 ms
64 bytes from 172.16.1.10: icmp_seq=2 ttl=64 time=1.4 ms
64 bytes from 172.16.1.10: icmp_seq=3 ttl=64 time=0.8 ms
64 bytes from 172.16.1.10: icmp_seq=4 ttl=64 time=1.4 ms
--- 172.20.120.167 ping statistics ---
5 packets transmitted, 5 packets received, 0% packet loss
round-trip min/avg/max = 0.8/1.4/2.4 ms
or that 192.168.1.10 is not reachable:
FortiRecorder-200D# execute ping 192.168.1.10
PING 192.168.1.10 (192.168.1.10): 56 data bytes
Timeout ...
Timeout ...
Timeout ...
Timeout ...
Timeout ...
--- 192.168.1.10 ping statistics ---
5 packets transmitted, 0 packets received, 100% packet loss
-
Use the tracert or traceroute command on both the camera (temporarily, the computer) and FortiRecorder to locate the point of failure along the route, the router hop or host at which the connection fails. For example, if it fails at the second hop, you might see:
FortiRecorder-200D# execute traceroute 192.168.1.10
traceroute to 192.168.1.10 (192.168.1.10), 32 hops max, 72 byte packets
1 192.168.1.2 2 ms 0 ms 1 ms
2 * * *
Each line lists the routing hop number, the IP address and FQDN (if any) of that hop, and the 3 response times from that hop. Typically a value of <1ms indicates a local router. The asterisks ( * ) indicate no response from that hop in the network routing.
If the route is broken when it reaches the FortiRecorder, first examine its network interfaces and routes. To display network interface addresses and subnets, enter:
FortiRecorder-200D# show system interface
To display all recently-used routes (the routing table cache) with their priorities, enter:
FortiRecorder-200D# diagnose netlink rtcache list
The index number of the route in the list of static routes in the web UI is not necessarily the same as its position in the cached routing table (diagnose netlink rtcache list).
You may need to verify that there are no misconfigured DNS records, and otherwise rule out problems at the physical, network, and transport layer.
If these tests succeed, a route exists, but you cannot receive video feeds or use FortiRecorder to update the camera’s network settings, an application-layer problem is preventing connectivity.
-
For application-layer problems, on the FortiRecorder, examine the:
- camera network settings (these may have become out-of-sync if you modified them while the camera was disabled)
- certificates (if connecting via HTTPS)
On routers and firewalls between the host and the FortiRecorder appliance, verify that they permit HTTP, HTTPS, and RTP connectivity between them.
Relatedly, if the computer’s DNS query cannot resolve the host name, output similar to the following appears:
example.lab: Name or service not known
Cannot handle "host" cmdline arg `example.lab' on position 1 (argc 1)
Facilitating discovery
Discovery of the cameras by the FortiRecorder uses UPnP and ONVIF. For it to work, cameras usually must be on the same IP subnet as the FortiRecorder, and must not be impeded by firewalls or other network filtering. If cameras are not on the same subnet, you may still be able to facilitate discovery traffic by configuring your FortiGate or other device with multicast forwarding.
If you do not know which device is impeding discovery, you can either:
- Temporarily attach the cameras to a closer point on the network, such as a local switch or directly to the FortiRecorder, so that discovery is not blocked.
- Manually add the camera to the FortiRecorder’s list of known cameras, skipping discovery.
DHCP issues
The FortiRecorder appliance has a built-in DHCP server. By default, it is disabled.
If you enable it and your network has another DHCP server (e.g. your ISP’s cable modem, a router, or a Windows or Linux server), verify that:
- both are not serving requests on the same network segment (which could create a race condition)
- both are not using the same pool of IP addresses (which could lead to IP address conflicts — see “Resolving IP address conflicts”)
To verify that your appliance and cameras are sending and receiving lease requests, you can perform a packet trace (see “Packet capture”) and/or use the event log to look for:
- DHCPDISCOVER (destination IP is broadcast, not FortiRecorder’s)
- DHCPOFFER
- DHCPREQUEST
- DHCPACK
Unauthorized DHCP clients or DHCP pool exhaustion
Typically returning DHCP clients will receive the same IP address lease. However if computers or other devices are accidentally using IP addresses that the FortiRecorder’s built-in DHCP server should be allocating to cameras, and the pool of available DHCP IP addresses becomes exhausted, cameras may be unable to get or retain an IP address.
To determine which devices are using your pool of DHCP IP addresses, compare the MAC address of each device’s network adapter to the list of current DHCP clients in Monitor > DHCP > DHCP or enter this command in the CLI:
execute dhcp lease-list
Output will resemble the following:

To correct this situation, first configure unintentional DHCP clients so that they do not use DHCP (that is, they have a static IP address) and so their IP address is not in the range used by the DHCP pool. Second, clear the list of DHCP clients to allow legitimate DHCP clients (your cameras) to obtain a lease:
execute dhcp clear-lease
New clients that were previously unable to get an IP address will obtain an IP address for the first time. Returning clients’ s IP addresses may change as the built-in DHCP server no longer has any memory of their previous lease, and may assign them a new IP address if another client has claimed that IP address first. (This may result in temporary IP address conflicts and therefore connectivity interruptions while the DHCP server assigns new leases.)
Establishing IP sessions
If a route exists, but there appears to be a problem establishing or maintaining TCP or IP-layer sessions between FortiRecorder and a computer or camera on your IP network, there are multiple possible causes, such as:
- Trusted hosts
- protocols/port numbers mismatched or blocked by NAT or firewalls
- IP address conflicts
- short DHCP leases (Lease time (Seconds) in “Configuring the DHCP server”)
- socket exhaustion
You can view a snapshot of FortiRecorder’s session table according to the IP layer. Go to FortiView > Sessions > Sessions.

|
GUI Item |
Description |
|---|---|
|
Protocol |
The protocol of the session according to the “protocol” ID number field (or, for IPv6, “next header”) in the IP header of the packets.
|
|
From IP |
The source of the session according the source field in the IP header. If source NAT is occurring, this is not necessarily the IP in the original frame from the client. |
|
From Port |
The source port number. For a list of port numbers that can originate from the FortiRecorder, see “Appendix A: Port numbers”. |
|
To IP |
The destination according to the destination field in the IP header. If destination NAT is occurring, this is not necessarily the IP in the original frame from the client. |
|
To Port |
The destination port number. For a list of port numbers that can be received by the FortiRecorder, see “Appendix A: Port numbers”. |
|
Expire (seconds) |
The session timeout in seconds. The expiry counter is reset when packets are sent or received, indicating that the session is still active. |
To refresh the session list snapshot with the most current list, click the dotted circle (Refresh) icon to the left of Records per page.
To sort the session list based upon the contents of a column, hover your mouse cursor over the column’s heading then click the arrow that appears on the right side of the heading, and select either Sort Ascending or Sort Descending.
If you expect sessions that do not exist, be aware that some protocol designs (notably UDP) do not feature persistent sessions. Their sessions will almost immediately expire and be removed from the session list, and therefore it may be very difficult to capture a session list snapshot during the brief moment that the datagram is being transmitted. TCP features persistent connections, where the socket is maintained until the data transmission either is confirmed to be finished or times out, and therefore TCP connections will persist in the session table for a much longer time.
If you still do not see the sessions that you expect, verify that your firewall or router allows traffic to or from those IP addresses, on all expected source and destination port numbers (see “Appendix A: Port numbers”).
If you see sessions with the FortiRecorder web UI or CLI that should not be allowed to exist, be sure to configure all accounts’ Trusted hosts setting.
Resolving IP address conflicts
If two or more devices are configured to use the same IP address on your network, this will cause a problem called an IP address conflict. Only one of those identically addressed devices can have IP-layer connectivity at a given time. The other will be ignored, effectively causing it to behave as if it were disconnected. (If multiple devices were to use the same IP address, routers and switches would not be able to determine with certainty where to deliver a packet destined for that IP address. To prevent this, routers and switches will only let one of the devices use the IP.)
Typically IP conflicts are caused when either:
- you have accidentally configured 2 devices with the same static IP address
- you have accidentally configured a device with a static IP address that belongs to the DHCP pool
- 2 DHCP servers accidentally have pools in the same range of IP addresses, and are each independently assigning their clients the same IPs
Your cameras, of course, have no screen, and cannot display any IP address conflict error message. However, you may notice symptoms such as interrupted video streams whenever a new device connects to the network or reboots.
If you have configured your FortiRecorder’s built-in DHCP server, first verify that it is not using the same DHCP pool as another DHCP server on your network. Next, you can use the CLI to determine whether MAC addresses from other devices’ network adapters have stolen IP addresses that should belong to your cameras. See “Unauthorized DHCP clients or DHCP pool exhaustion”. If, however, you have transitioned your cameras to use static IP addresses, you must use another method.
- Use the ARP table of either your FortiRecorder (see “Examining the ARP table”) or router to determine which MAC address (and therefore which computer/device’s network adapter) has taken the IP address.
- If a computer is using the same IP address as another device, such as your cameras, it may periodically complain of an IP address conflict. This computer may be the source of the conflict.
Once you have found the source of the problem, configure that computer or device to use a unique IP address that is not used by any other device on your network.
Packet capture
Packet capture, also known as sniffing, packet trace, or packet analysis, records some or all of the packets seen by a network interface (that is, the network interface is used in promiscuous mode). By recording packets, you can trace TCP connection states and HTTP request transactions to the exact point at which they fail, which may help you to diagnose some types of problems that are otherwise difficult to detect, such as malformed packets, differentiated services misconfiguration, or non-RFC protocol incompatibilities.
|
|
Packet capture can be very resource intensive. To minimize the performance impact on your FortiRecorder appliance, use packet capture only during periods of minimal traffic, with a local console CLI connection rather than a Telnet or SSH CLI connection, and be sure to stop the command when you are finished. |
FortiRecorder appliances have a built-in sniffer. Packet capture on FortiRecorder appliances is similar to that of FortiGate appliances. To use the built-in sniffer, connect to the CLI and enter the following command:
diagnose sniffer packet [{any | <interface_name>}
[{none | '<filter_str>'} [{1 | 2 | 3 | 4 | 5 | 6} [<packets_int>
[{a | <any_str>}]]]]]
where:
- <interface_name> is either the name of a network interface, such as port1, or enter any for all interfaces. If you omit this and the following parameters for the command, the command captures all packets on all network interfaces.
- '<filter_str>' is the sniffer filter that specifies which protocols and port numbers that you do or do not want to capture, such as 'tcp port 80', or enter none for no filters. Filters use tcpdump syntax.
- <packets_int> is the number of packets the sniffer reads before stopping. Packet capture output is printed to your CLI display until you stop it by pressing Ctrl+C, or until it reaches the number of packets that you have specified to capture.
- {a | <any_str>} is either a (to include an absolute, full UTC timestamp in the format yyyy-mm-dd hh:mm:ss.ms), or any other text (to include a timestamp that is the amount of time since he start of the packet capture, in the format ss.ms)
- {1 | 2 | 3 | 4 | 5 | 6} is an integer indicating whether to display the network interface names, packet headers, and/or payloads for each packet that the network interface sends, receives, or sees:
- 1 — Display the packet capture timestamp, plus basic fields of the IP header: the source IP address, the destination IP address, protocol name, and destination port number.
- Does not display all fields of the IP header; it omits:
- IP version number bits
- Internet header length (ihl)
- type of service/differentiated services code point (tos)
- explicit congestion notification
- total packet or fragment length
- packet ID
- IP header checksum
- time to live (TTL)
- IP flag
- fragment offset
- options bits
example:
-
2 — All of the output from 1, plus the packet payload in both hexadecimal and ASCII.
example: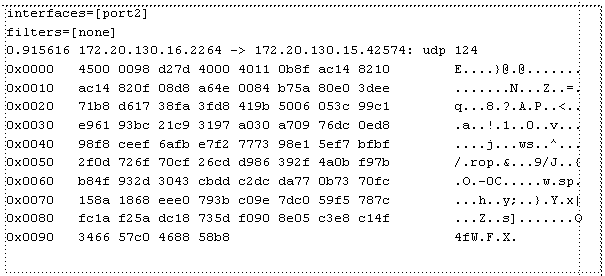
- 3 — All of the output from 2, plus the link layer (Ethernet) header.
example:
- 4 — All of the output from 1, plus the network interface name. This can be necessary if you are capturing packets from multiple network interfaces at once, and need to know which packet was seen by which interface.
example: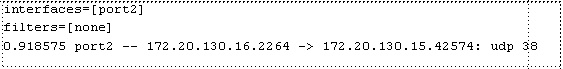
- 5 — All of the output from 2, plus the network interface name.
example:
- 6 — All of the output from 3, plus the network interface name.
example: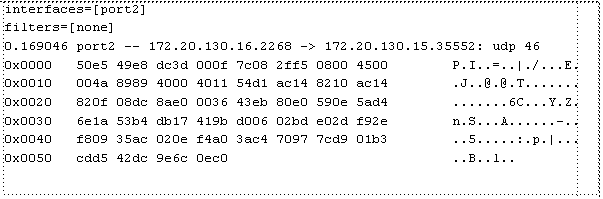
For example, you might capture all TCP port 443 (typically HTTPS) traffic occurring through port1, regardless of its source or destination IP address. The capture uses a high level of verbosity (indicated by 3).
A specific number of packets to capture is not specified. As a result, the packet capture continues until the administrator presses Ctrl+C. The sniffer then confirms that five packets were seen by that network interface.
(Verbose output can be very long. As a result, output shown below is truncated after only one packet.)
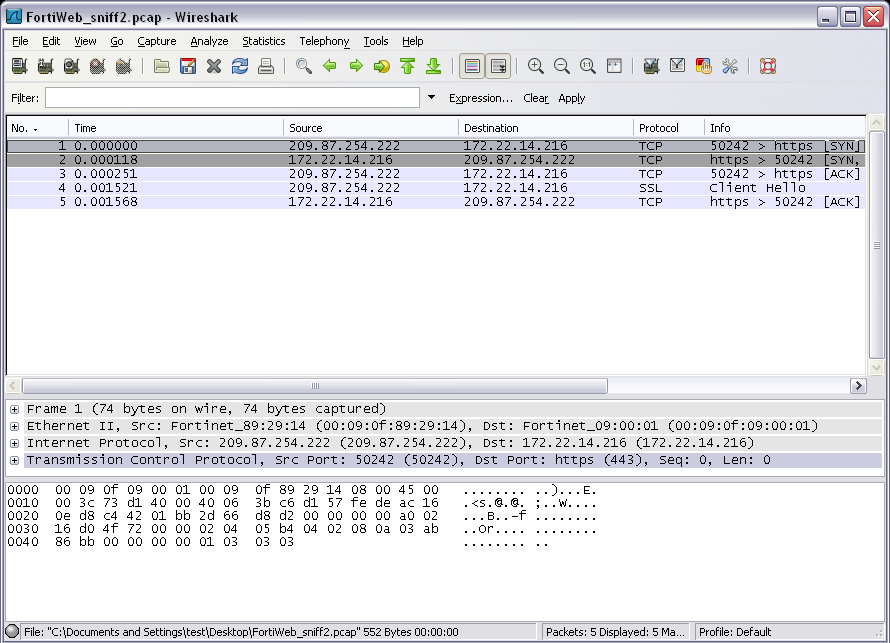
Instead of reading packet capture output directly in your CLI display, you usually should save the output to a plain text file using your CLI client. Saving the output provides several advantages. Packets can arrive more rapidly than you may be able to read them in the buffer of your CLI display, and many protocols transfer data using encodings other than US-ASCII. It is often, but not always, preferable to analyze the output by loading it into in a network protocol analyzer application such as Wireshark (http://www.wireshark.org/).
For example, you could use PuTTY or Microsoft HyperTerminal to save the sniffer output to a file. Methods may vary. See the documentation for your CLI client.
Requirements
- terminal emulation software such as PuTTY
- a plain text editor such as Notepad
- a Perl interpreter
- network protocol analyzer software such as Wireshark
To view packet capture output using PuTTY and Wireshark
- On your management computer, start PuTTY.
- Use PuTTY to connect to the FortiRecorder appliance using either a local console, SSH, or Telnet connection.
-
Type the packet capture command, such as:
diag sniffer packet port1 'src host 10.0.0.1 and tcp port 443' 3
but do not press Enter yet.
-
In the upper left corner of the window, click the PuTTY icon to open its drop-down menu, then select Change Settings.

A dialog appears where you can configure PuTTY to save output to a plain text file.
- In the Category tree on the left, go to Session > Logging.
- In Session logging, select Printable output.
- In Log file name, click the Browse button, then choose a directory path and file name such as C:\Users\MyAccount\packet_capture.txt to save the packet capture to a plain text file. (You do not need to save it with the .log file extension.)
- Select Apply.
- Press Enter to send the CLI command to the FortiRecorder appliance, beginning packet capture.
- If you have not specified a number of packets to capture, when you have captured all packets that you want to analyze, press Ctrl + C to stop the capture.
- Close the PuTTY window.
-
Open the packet capture file using a plain text editor such as Notepad.

-
Delete the first and last lines, which look like this:
=~=~=~=~=~=~=~=~=~=~=~= PuTTY log 2020.07.25 11:34:40 =~=~=~=~=~=~=~=~=~=~=~=
FortiRecorder-200 #
These lines are a PuTTY timestamp and a command prompt, which are not part of the packet capture. If you do not delete them, they could interfere with the script in the next step.
-
Convert the plain text file to a format recognizable by your network protocol analyzer application.
You can convert the plain text file to a format (.pcap) recognizable by Wireshark (formerly called Ethereal) using the fgt2eth.pl Perl script. To download fgt2eth.pl, see the Fortinet Knowledge Base article Using the FortiOS built-in packet sniffer.
The fgt2eth.pl script is provided as-is, without any implied warranty or technical support, and requires that you first install a Perl module compatible with your operating system.
To use fgt2eth.pl, open a command prompt, then enter a command such as the following:
Methods to open a command prompt vary by operating system. On Windows XP, go to Start > Run and enter cmd. On Windows 7, click the Start (Windows logo) menu to open it, then enter cmd. fgt2eth.pl -in packet_capture.txt -out packet_capture.pcap
where:
- fgt2eth.pl is the name of the conversion script; include the path relative to the current directory, which is indicated by the command prompt
- packet_capture.txt is the name of the packet capture’s output file; include the directory path relative to your current directory
- packet_capture.pcap is the name of the conversion script’s output file; include the directory path relative to your current directory where you want the converted output to be saved

-
Open the converted file in your network protocol analyzer application. For further instructions, see the documentation for that application.
For additional information on packet capture, see the Fortinet Knowledge Base article Using the FortiOS built-in packet sniffer.